Wigan Metropolitan Borough Council election, 1984
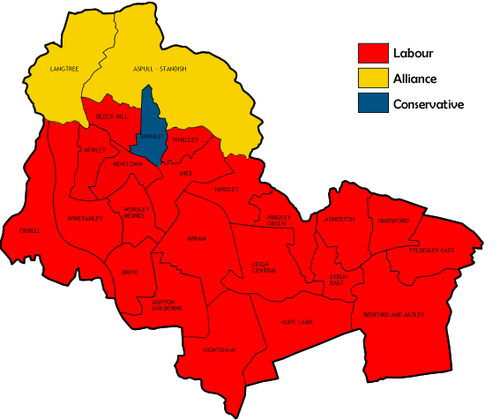
Map of the results of the 1984 Wigan council election.
Elections to the Wigan council were held on Thursday, 3 May 1984, with one third of the seats up for vote. Three wards – Abram, Hindley and Lightshaw – were unopposed, leaving only twenty one of the twenty four wards going to vote – a number not seen since 1975. Also of note was the re-emergence of a fourth party, in the way of persistent Communist candidate H. Kedward contesting Leigh Central after a three-year absence. The election itself seen a Labour gain in Orrell from the Conservatives, which cancelled out the simultaneous Alliance gain from Labour in Aspell-Standish, leaving their majority unchanged. Overall turnout slumped to 29.2%, the lowest level since the aforementioned 1975 election.[1]
Election result
| Wigan Local Election Result 1984 |
| Party |
Seats |
Gains |
Losses |
Net gain/loss |
Seats % |
Votes % |
Votes |
+/− |
| |
Labour |
21 |
1 |
1 |
0 |
87.5 |
62.2 |
43,977 |
+5.2% |
| |
SDP–Liberal Alliance |
2 |
1 |
0 |
+1 |
8.3 |
19.6 |
13,856 |
-6.3% |
| |
Conservative |
1 |
0 |
1 |
-1 |
4.2 |
18.0 |
12,762 |
+0.9% |
| |
Communist |
0 |
0 |
0 |
0 |
0.0 |
0.1 |
59 |
+0.1% |
This result had the following consequences for the total number of seats on the Council after the elections:
| Party |
Previous council |
New council |
|
Labour |
60 |
60 |
|
SDP-Liberal Alliance |
7 |
8 |
|
Conservatives |
5 |
4 |
| Total |
72 |
72 |
| Working majority |
48 |
48 |
Ward results
| Bedford-Astley[1] |
| Party |
Candidate |
Votes |
% |
±% |
|
Labour |
J. Jones |
2,039 |
54.5 |
+7.4 |
|
Conservative |
F. Hawley |
1,036 |
27.7 |
+0.9 |
|
SDP–Liberal Alliance |
R. Mateer |
668 |
17.8 |
-8.3 |
| Majority |
1,003 |
26.8 |
+6.5 |
| Turnout |
3,743 |
38.4 |
-2.1 |
|
Labour hold |
Swing |
+3.2 |
|
| Beech Hill[1] |
| Party |
Candidate |
Votes |
% |
±% |
|
Labour |
T. Bishop |
1,963 |
69.0 |
+11.4 |
|
SDP–Liberal Alliance |
G. Pullin |
483 |
17.0 |
-1.0 |
|
Conservative |
J. Wolstenholme |
397 |
14.0 |
-10.3 |
| Majority |
1,480 |
52.1 |
+21.7 |
| Turnout |
2,843 |
32.1 |
-6.6 |
|
Labour hold |
Swing |
+6.2 |
|
| Bryn[1] |
| Party |
Candidate |
Votes |
% |
±% |
|
Labour |
G. Lockett |
2,355 |
72.6 |
+6.5 |
|
SDP–Liberal Alliance |
D. Seary |
480 |
14.8 |
-19.1 |
|
Conservative |
C. Michaels |
408 |
12.6 |
+12.6 |
| Majority |
1,875 |
57.8 |
+25.6 |
| Turnout |
3,243 |
32.9 |
-6.9 |
|
Labour hold |
Swing |
+12.8 |
|
| Hindley Green[1] |
| Party |
Candidate |
Votes |
% |
±% |
|
Labour |
S. Murphy |
2,387 |
77.8 |
+30.7 |
|
SDP–Liberal Alliance |
M. O'Halloran |
681 |
22.2 |
-3.9 |
| Majority |
1,706 |
55.6 |
+35.3 |
| Turnout |
3,068 |
28.4 |
-12.1 |
|
Labour hold |
Swing |
+17.3 |
|
| Hope Carr[1] |
| Party |
Candidate |
Votes |
% |
±% |
|
Labour |
A. Roberts |
2,179 |
60.8 |
+6.1 |
|
Conservative |
E. Manson |
1,122 |
31.3 |
-1.5 |
|
SDP–Liberal Alliance |
L. Seal |
284 |
7.9 |
-4.5 |
| Majority |
1,057 |
29.5 |
+7.6 |
| Turnout |
3,585 |
37.4 |
-5.2 |
|
Labour hold |
Swing |
+3.8 |
|
| Ince[1] |
| Party |
Candidate |
Votes |
% |
±% |
|
Labour |
A. Banks |
2,017 |
89.2 |
+7.0 |
|
SDP–Liberal Alliance |
A. Robinson |
244 |
10.8 |
-7.0 |
| Majority |
1,773 |
78.4 |
+14.0 |
| Turnout |
2,261 |
28.2 |
-9.8 |
|
Labour hold |
Swing |
+7.0 |
|
| Langtree[1] |
| Party |
Candidate |
Votes |
% |
±% |
|
SDP–Liberal Alliance |
J. Pigott |
2,053 |
45.2 |
-3.6 |
|
Labour |
T. O'Hagan |
1,762 |
38.8 |
+6.7 |
|
Conservative |
R. Gibson |
723 |
15.9 |
-3.1 |
| Majority |
291 |
6.4 |
-10.2 |
| Turnout |
4,538 |
43.7 |
+2.1 |
|
SDP–Liberal Alliance hold |
Swing |
-5.1 |
|
| Leigh East[1] |
| Party |
Candidate |
Votes |
% |
±% |
|
Labour |
J. Riley |
1,914 |
64.0 |
+11.3 |
|
Conservative |
M. Stewart |
830 |
27.7 |
-0.2 |
|
SDP–Liberal Alliance |
I. Smith |
248 |
8.3 |
-11.1 |
| Majority |
1,084 |
36.2 |
+11.5 |
| Turnout |
2,992 |
29.8 |
-5.4 |
|
Labour hold |
Swing |
+5.7 |
|
| Newtown[1] |
| Party |
Candidate |
Votes |
% |
±% |
|
Labour |
A. Peet |
2,195 |
80.1 |
+7.8 |
|
Conservative |
J. Lawson |
357 |
13.0 |
-1.8 |
|
SDP–Liberal Alliance |
W. Hewer |
189 |
6.9 |
-6.0 |
| Majority |
1,838 |
67.1 |
+9.5 |
| Turnout |
2,741 |
29.9 |
-3.8 |
|
Labour hold |
Swing |
+4.8 |
|
| Norley[1] |
| Party |
Candidate |
Votes |
% |
±% |
|
Labour |
E. Maddocks |
2,444 |
88.2 |
+9.6 |
|
Conservative |
J. Davies |
168 |
6.1 |
+0.4 |
|
SDP–Liberal Alliance |
R. Richardson |
158 |
5.7 |
-10.0 |
| Majority |
2,276 |
82.2 |
+19.3 |
| Turnout |
2,770 |
33.1 |
-3.7 |
|
Labour hold |
Swing |
+5.0 |
|
| Swinley[1] |
| Party |
Candidate |
Votes |
% |
±% |
|
Conservative |
C. Bond |
1,637 |
43.9 |
-2.1 |
|
Labour |
P. Lees |
1,395 |
37.4 |
+3.7 |
|
SDP–Liberal Alliance |
E. Parkin |
697 |
18.7 |
-1.5 |
| Majority |
242 |
6.5 |
-5.8 |
| Turnout |
3,729 |
41.0 |
-3.6 |
|
Conservative hold |
Swing |
-2.9 |
|
| Whelley[1] |
| Party |
Candidate |
Votes |
% |
±% |
|
Labour |
A. Coyle |
2,224 |
76.5 |
+12.4 |
|
Conservative |
F. Sidebotham |
362 |
12.4 |
-0.8 |
|
SDP–Liberal Alliance |
K. Latham |
322 |
11.1 |
-11.6 |
| Majority |
1,862 |
64.0 |
+22.7 |
| Turnout |
2,908 |
32.8 |
-5.5 |
|
Labour hold |
Swing |
+6.6 |
|
| Winstanley[1] |
| Party |
Candidate |
Votes |
% |
±% |
|
Labour |
J. Whittle |
1,798 |
43.6 |
+4.0 |
|
SDP–Liberal Alliance |
H. Evans |
1,757 |
42.6 |
+5.9 |
|
Conservative |
C. Mugan |
570 |
13.8 |
-9.9 |
| Majority |
41 |
1.0 |
-1.9 |
| Turnout |
4,125 |
37.9 |
-3.3 |
|
Labour hold |
Swing |
-0.9 |
|
References
|
|---|
| | Metropolitan boroughs | |
|---|
| | District councils (England) | |
|---|
| | District councils (Scotland) |
- Aberdeen
- Angus
- Annandale and Eskdale
- Argyll and Bute
- Badenoch and Strathspey
- Banff and Buchan
- Bearsden and Milngavie
- Berwickshire
- Caithness
- Clackmannan
- Clydebank
- Clydesdale
- Cumbernauld and Kilsyth
- Cumnock and Doon Valley
- Cunninghame
- Dumbarton
- Dundee
- Dunfermline
- East Kilbride
- East Lothian
- Eastwood
- Edinburgh
- Ettrick and Lauderdale
- Falkirk
- Glasgow
- Gordon
- Hamilton
- Inverclyde
- Inverness
- Kilmarnock and Loudoun
- Kincardine and Deeside
- Kirkcaldy
- Kyle and Carrick
- Lochaber
- Midlothian
- Monklands
- Moray
- Motherwell
- Nairn
- Nithsdale
- North East Fife
- Perth and Kinross
- Renfrew
- Ross and Cromarty
- Roxburgh
- Skye and Lochalsh
- Stewartry
- Stirling
- Strathkelvin
- Sutherland
- Tweeddale
- West Lothian
- Wigtown
|
|---|
| |
|