Wigan Metropolitan Borough Council election, 1983
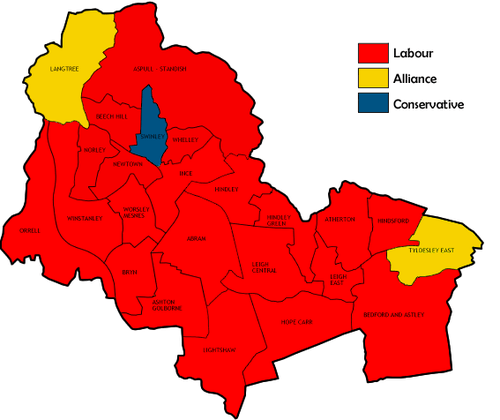
Map of the results of the 1983 Wigan council election.
Elections to the Wigan Council were held on Thursday, 5 May 1983, with one third of the council up for election. The election seen only the main three parties contesting for the first time and one gain in Tyldesley East with Alliance winning their seventh seat from Labour. The Conservatives, contesting a low of seventeen wards, managed their lowest voter share since the council's creation. Overall turnout rose to a relative high of 39.1%.[1]
Election result
| Wigan Local Election Result 1983 |
| Party |
Seats |
Gains |
Losses |
Net gain/loss |
Seats % |
Votes % |
Votes |
+/− |
| |
Labour |
21 |
0 |
1 |
-1 |
87.5 |
57.0 |
49,230 |
+6.5% |
| |
SDP–Liberal Alliance |
2 |
1 |
0 |
+1 |
8.3 |
25.9 |
22,342 |
-3.3% |
| |
Conservative |
1 |
0 |
0 |
0 |
4.2 |
17.1 |
14,790 |
-1.8% |
This result had the following consequences for the total number of seats on the Council after the elections:
| Party |
Previous council |
New council |
|
Labour |
61 |
60 |
|
SDP-Liberal Alliance |
6 |
7 |
|
Conservatives |
5 |
5 |
| Total |
72 |
72 |
| Working majority |
50 |
48 |
Ward results
| Abram[1] |
| Party |
Candidate |
Votes |
% |
±% |
|
Labour |
N. Cumberbatch |
3,071 |
84.5 |
+10.5 |
|
SDP–Liberal Alliance |
M. Belshaw |
565 |
15.5 |
+0.2 |
| Majority |
2,506 |
68.9 |
+10.3 |
| Turnout |
3,636 |
36.3 |
+3.3 |
|
Labour hold |
Swing |
+5.1 |
|
| Bedford-Astley[1] |
| Party |
Candidate |
Votes |
% |
±% |
|
Labour |
H. Hayes |
1,849 |
47.1 |
+3.4 |
|
Conservative |
J. Davies |
1,053 |
26.8 |
+0.4 |
|
SDP–Liberal Alliance |
B. Aitken |
1,026 |
26.1 |
-3.8 |
| Majority |
796 |
20.3 |
+6.5 |
| Turnout |
3,928 |
40.5 |
+2.2 |
|
Labour hold |
Swing |
+1.5 |
|
| Beech Hill[1] |
| Party |
Candidate |
Votes |
% |
±% |
|
Labour |
H. Antill |
1,989 |
57.7 |
+1.7 |
|
SDP–Liberal Alliance |
P. Coleman |
943 |
27.3 |
-0.7 |
|
Conservative |
J. Wolstenholme |
517 |
15.0 |
-1.0 |
| Majority |
1,046 |
30.3 |
+2.4 |
| Turnout |
3,449 |
38.7 |
+6.6 |
|
Labour hold |
Swing |
+1.2 |
|
| Bryn[1] |
| Party |
Candidate |
Votes |
% |
±% |
|
Labour |
J. Foster |
2,597 |
66.1 |
+15.0 |
|
SDP–Liberal Alliance |
D. Seary |
1,333 |
33.9 |
+2.0 |
| Majority |
1,264 |
32.2 |
+13.1 |
| Turnout |
3,930 |
39.9 |
+4.4 |
|
Labour hold |
Swing |
+6.5 |
|
| Hindley Green[1] |
| Party |
Candidate |
Votes |
% |
±% |
|
Labour |
H. Hayes |
1,849 |
47.1 |
-1.8 |
|
Conservative |
J. Davies |
1,053 |
26.8 |
+2.2 |
|
SDP–Liberal Alliance |
B. Aitken |
1,026 |
26.1 |
-0.4 |
| Majority |
796 |
20.3 |
-2.1 |
| Turnout |
3,928 |
40.5 |
+13.2 |
|
Labour hold |
Swing |
-2.0 |
|
| Hindsford[1] |
| Party |
Candidate |
Votes |
% |
±% |
|
Labour |
S. Little |
2,302 |
66.2 |
+19.4 |
|
SDP–Liberal Alliance |
W. Jones |
1,176 |
33.8 |
-3.9 |
| Majority |
1,126 |
32.4 |
+23.3 |
| Turnout |
3,478 |
32.6 |
+0.0 |
|
Labour hold |
Swing |
+11.6 |
|
| Hope Carr[1] |
| Party |
Candidate |
Votes |
% |
±% |
|
Labour |
F. Newton |
2,222 |
54.7 |
+12.1 |
|
Conservative |
E. Manson |
1,335 |
32.9 |
+2.4 |
|
SDP–Liberal Alliance |
J. Thomson |
506 |
12.5 |
-14.5 |
| Majority |
887 |
21.8 |
+9.7 |
| Turnout |
4,063 |
42.6 |
+2.3 |
|
Labour hold |
Swing |
+4.8 |
|
| Ince[1] |
| Party |
Candidate |
Votes |
% |
±% |
|
Labour |
D. Molyneaux |
2,565 |
82.2 |
+10.2 |
|
SDP–Liberal Alliance |
P. Coleman |
555 |
17.8 |
-3.4 |
| Majority |
2,010 |
64.4 |
+13.6 |
| Turnout |
3,120 |
38.0 |
+11.2 |
|
Labour hold |
Swing |
+6.8 |
|
| Langtree[1] |
| Party |
Candidate |
Votes |
% |
±% |
|
SDP–Liberal Alliance |
E. Hill |
2,077 |
48.8 |
-2.0 |
|
Labour |
P. Sawbridge |
1,368 |
32.2 |
+2.6 |
|
Conservative |
M. Clark |
809 |
19.0 |
-0.6 |
| Majority |
709 |
16.7 |
-4.7 |
| Turnout |
4,254 |
41.5 |
+5.5 |
|
SDP–Liberal Alliance hold |
Swing |
-2.3 |
|
| Leigh Central[1] |
| Party |
Candidate |
Votes |
% |
±% |
|
Labour |
P. Hull |
2,179 |
74.0 |
+1.6 |
|
Conservative |
S. Emerton |
462 |
15.7 |
+1.6 |
|
SDP–Liberal Alliance |
H. Crook |
304 |
10.3 |
-3.2 |
| Majority |
1,717 |
58.3 |
-0.0 |
| Turnout |
2,945 |
32.6 |
+1.6 |
|
Labour hold |
Swing |
-0.0 |
|
| Leigh East[1] |
| Party |
Candidate |
Votes |
% |
±% |
|
Labour |
D. Caley |
1,836 |
52.7 |
-9.0 |
|
Conservative |
M. Stewart |
975 |
28.0 |
+28.0 |
|
SDP–Liberal Alliance |
J. Hampson |
675 |
19.4 |
-19.0 |
| Majority |
861 |
24.7 |
+1.3 |
| Turnout |
3,486 |
35.2 |
+7.7 |
|
Labour hold |
Swing |
-18.5 |
|
| Lightshaw[1] |
| Party |
Candidate |
Votes |
% |
±% |
|
Labour |
B. Strett |
2,733 |
64.5 |
+11.1 |
|
Conservative |
M. Sharland |
955 |
22.5 |
-2.0 |
|
SDP–Liberal Alliance |
M. Beasley |
551 |
13.0 |
-9.1 |
| Majority |
1,778 |
41.9 |
+13.1 |
| Turnout |
4,239 |
41.8 |
+4.4 |
|
Labour hold |
Swing |
+6.5 |
|
| Newtown[1] |
| Party |
Candidate |
Votes |
% |
±% |
|
Labour |
M. Milligan |
2,233 |
72.3 |
+6.7 |
|
Conservative |
J. Lawson |
457 |
14.8 |
+0.7 |
|
SDP–Liberal Alliance |
P. Gibbons |
399 |
12.9 |
-7.5 |
| Majority |
1,176 |
57.5 |
12.4 |
| Turnout |
3,089 |
33.7 |
+5.3 |
|
Labour hold |
Swing |
+3.0 |
|
| Norley[1] |
| Party |
Candidate |
Votes |
% |
±% |
|
Labour |
J. Smith |
2,441 |
78.6 |
-1.3 |
|
SDP–Liberal Alliance |
R. Richardson |
489 |
15.7 |
+2.7 |
|
Conservative |
J. Davies |
176 |
5.7 |
-1.4 |
| Majority |
1,952 |
62.8 |
-4.0 |
| Turnout |
3,106 |
36.8 |
+8.0 |
|
Labour hold |
Swing |
-2.0 |
|
| Swinley[1] |
| Party |
Candidate |
Votes |
% |
±% |
|
Conservative |
T. Peet |
1,864 |
46.0 |
-0.9 |
|
Labour |
K. Pye |
1,366 |
33.7 |
+4.1 |
|
SDP–Liberal Alliance |
H. Hughes |
819 |
20.2 |
-3.1 |
| Majority |
498 |
12.3 |
-5.0 |
| Turnout |
4,049 |
44.6 |
+4.7 |
|
Labour hold |
Swing |
-2.5 |
|
| Tyldesley East[1] |
| Party |
Candidate |
Votes |
% |
±% |
|
SDP–Liberal Alliance |
J. Dean |
2,310 |
54.8 |
+3.9 |
|
Labour |
F. Walker |
1,902 |
45.2 |
-3.9 |
| Majority |
408 |
9.7 |
+7.7 |
| Turnout |
4,212 |
43.6 |
+7.4 |
|
SDP–Liberal Alliance gain from Labour |
Swing |
+3.9 |
|
| Whelley[1] |
| Party |
Candidate |
Votes |
% |
±% |
|
Labour |
M. Pendleton |
2,190 |
64.0 |
+7.0 |
|
SDP–Liberal Alliance |
P. Wilson |
776 |
22.7 |
-8.1 |
|
Conservative |
C. Bond |
454 |
13.3 |
+1.1 |
| Majority |
1,414 |
41.3 |
+15.1 |
| Turnout |
3,420 |
38.3 |
+4.6 |
|
Labour hold |
Swing |
+7.5 |
|
| Winstanley[1] |
| Party |
Candidate |
Votes |
% |
±% |
|
Labour |
G. Taberner |
1,730 |
39.6 |
+8.4 |
|
SDP–Liberal Alliance |
C. Ryan |
1,602 |
36.7 |
-4.2 |
|
Conservative |
J. Michaels |
1,038 |
23.8 |
-4.3 |
| Majority |
128 |
2.9 |
-6.8 |
| Turnout |
4,370 |
41.2 |
+7.9 |
|
Labour hold |
Swing |
+6.3 |
|
References