White Latin American
| Total population | |
|---|---|
|
White people
| |
| Regions with significant populations | |
| 91M[3] | |
| 38M[2] | |
| 27M[4] | |
| 20M (est.)[5] | |
| 18M[6] | |
| 13.1M[7][8] | |
| 9.1M (est.)[2] | |
| 7.3M[9] | |
| 4.5M[10] | |
| 3.5M[2] | |
| 3.3M[11] | |
| 2.8M[12] | |
| 2.7M[13] | |
| 2.0M[14] | |
| 1.6M[15] | |
| 1.3M[2] | |
| 1M[16] | |
| 0.95M[17] | |
| 0.495M (whites and mulattos)[18] | |
| Languages | |
| Spanish, Portuguese, French, English and other languages[19] | |
| Religion | |
| Predominantly Christian (mainly Roman Catholic, with a minority of Protestants); and other religions[20] | |
White Latin Americans are the people of Latin America who are considered white, typically due to European, or in some cases, Levantine descent.
Latin American countries have often had miscegenation, since even small amounts of European ancestry could entail significant upwards social mobility.[21][22][23]
Throughout Latin America people who are White identify with heritage from European settlers arriving in the Americas throughout the colonial and post-independence periods. Many of the earliest settlers were Spanish and Portuguese, and after independence, Italians have led numerically among the millions of immigrants. Notably large immigration occurred as well by Germans, Poles, Irish, British, French, Russians, Belgians, Dutch, Scandinavians, Ukrainians, Hungarians, Lebanese, Croats, Armenians, Syrians, Swiss, Greeks and other Europeans.[24][25][26]
Composing about 33% or 36% of the population as of 2010 according to some sources,[1][2][27] White Latin Americans constitute the largest racial-ethnic group in the region. White is the self-identification of many Latin Americans in some national censuses, as seen further on in this article. According to a survey conducted by consultant Cohesión Social in Latin America, conducted on a sample of 10,000 people from seven different countries of the region, 34% of those interviewed identified themselves as White.[28]
Being White
Being White is a classificatory term that emerges from the tradition of racial classification, a system that developed as Europeans colonized large parts of the world and employed classificatory systems to distinguish themselves from the local inhabitants of those countries. However, while most racial classifications include a concept of being White that is ideologically connected to European heritage and specific phenotypic, biological features associated with European heritage, there is a wide variability about the ways in which they are used to classify people. These differences have to do with the particular historical processes and social contexts in which a given racial classification is used. Since Latin America is characterized by widely differing histories and social contexts, there is also wide variability in the use of the classification white throughout Latin America.[29]
According to Peter Wade specialist in race concepts of Latin America
...racial categories and racial ideologies are not simply those that elaborate social constructions on the basis of phenotypical variation or ideas about innate difference but those that do so using the particular aspects of phenotypical variation that were worked into vital signifiers of difference during European colonial encounters with others.[30]
In many parts of Latin America being white is connected more to socio-economic status than to specific phenotypic traits - and it is often said that in Latin America "Money Whitens"[31] Also within Latin America there is variation in how racial boundaries have been defined. In Argentina, for example, the notion of mixture has been downplayed resulting in the country having no real Mestizo group, whereas in countries like Mexico and Brazil the notion of mixedness has been fundamental for nation-building, resulting in a large group of Mestizos in Mexico or Pardos in Brazil (unlike the Mestizos of Mexico, most non-White Brazilians self-identify as Pardo, not Mestiço;[32] the ancestral background of most Pardo Brazilians is a mix of mostly African, Native American and European ancestries)[33] being considered neither fully white nor fully non-white.[34]
Unlike the U.S where ancestry is used to define race, Latin American scholars came to agree by the 1970s that race in Latin America could not be understood as the "genetic composition of individuals" but instead "based upon a combination of cultural, social, and somatic considerations. In Latin America, a person's ancestry is quite irrelevant to racial classification. For example, full-blooded siblings can often be classified different races (Harris 1964).[35][36]
For these reasons the distinction between "white" and "mixed", and between "mixed" and "black" or "indigenous" is largely subjective and situational meaning that any attempt to quantify racial categories into discrete categories is fraught with problems.[37]
History

After the period of the Wars of Independence, the elites of most of the countries of the region concluded that the cause of their underdevelopment was their populations being mostly Amerindian, Mestizo or Mulatto,[38] so a major process of "whitening" was required, or at least desirable.[39][40] Then, most Latin American countries implemented blanqueamiento policies to promote and incentivate European immigration, and some were quite successful at it, especially Argentina, Uruguay and Brazil. The amount of European immigrants arrived from the late 19th century and the early 20th century far surpassed the figures of original colonists. Numbers vary according to the period taken into account, but it is evident that, of a total 15 million immigrants arrived in Latin America,[24] Argentina received 6.4 million and Brazil welcomed 5.5 million immigrants between 1821 and 1932.[41]
Historical demographic growth
The following chart displays estimates (in thousands) of White, Black/Mulatto, Amerindian and Mestizo population of the subcontinent from the 17th to the 20th centuries. The figures shown for the years between 1650 and 1980 are taken from The Cry of My People. Out of Captivity in Latin America, written by Esther and Mortimer Arias. New York Friendship Press, 1980. Pages 17 and 18.[42] Data belonging to year 2000 are taken from Lizcano's work.[2] Percentages are provided by the editor.
| Year | White | Black | Amerindian | Mestizo | Total |
|---|---|---|---|---|---|
| 1650 | 138 | 67 | 12,000 | 670 | 12,875 |
| Percentages | 1.1% | 0.5% | 93.2% | 5.2% | 100% |
| 1825 | 4,350 | 4,100 | 8,000 | 6,200 | 22,650 |
| Percentages | 19.2% | 18.1% | 35.3% | 27.3% | 100% |
| 1950 | 72,000 | 13,729 | 14,000 | 61,000 | 160,729 |
| Percentages | 44.8% | 8.5% | 8.7% | 37.9% | 100% |
| 1980 | 150,000 | 27,000 | 30,000 | 140,000 | 347,000 |
| Percentages | 43.2% | 7.7% | 8.6% | 40.3% | 100% |
| 2000 | 181,296 | 119,055 | 46,434 | 152,380 | 502,784 |
| Percentages | 36.1% | 23.6% | 9.2% | 30.3% | 100% |
Admixture
Since the European colonization, the evolution of Latin America's population is embedded in a long and widespread history of intermixing, so that many Latin Americans who have Native American and/or sub-Saharan African and/or, rarely, East Asian ancestry have also European ancestry. The casta classification of colonial Latin America defined a person of mixed European/Native American ancestry, or Mestizo ancestry. A castizo was someone whose mother was European and his father a criollo (who may himself have been mixed).
As it happened in Spain, persons of Jewish or Moorish ancestry up to several generations, were not allowed to enroll at the service of the Spanish Army or the Catholic Church in the Spanish colonies. All applicants to both institutions and their spouses had to obtain a Limpieza de sangre certificate in the same way as those in the Peninsula did, that proved that they had no Jewish or Moorish ancestors. However, being a medieval concept that targeted exclusively those religious groups, it was never an issue among the native population in the colonies of the Spanish Empire, that by law allowed people from all racial groups to join the Army, with the only prerequisite of embracing the Catholic faith. One notable example was that of Francisco Menendez, a freed black military officer of the Spanish Army during the 18th century at the Gracia Real de Santa Teresa de Mose fort in St. Augustine, Florida.[43]
Although historically both Colonial and Imperial Brazil had institutionalized discrimination against citizens which were deemed as people of color, contrary to the common sense in its population, it never had a casta classification like that of Hispanic America. White Brazilian people in the social status equivalent to the Hispanic criollo could have less than 80% of European (overwhelmingly Portuguese, seldom Spanish and much rarely other European ethnicities) ancestry. Aside some Amerindian and Black African descent which is knowly widespread among White populations in Brazil among all social classes in its five geographic regions since historically early times (c. 16th to 17th centuries), Moorish, Jewish, Arab and Romani mixed ancestry were also less significant to social status there than in Hispanic America.
It does not mean that social prestige of "fully non-whites" (people of color which are not mulattoes, mestizos, zambos, pardos, etc. in short, multiracial Brazilians, with Caucasian features i.e. Black Africans, Amerindians, their direct descendants and "westernized" Brazilians with wholly or almost fully non-Caucasian phenotypes, which also would be >70% European in their ancestry, since genes that form racial phenotypes are distributed random among the descendants of intermixing couples) and people with knowable non-European ancestry was equal, comparable or even acceptable among Brazilians elites, but that in Portuguese America, people were less concerned with ancestry and Limpeza de Sangue than its Spanish origin neighbours.
Populations
In terms of absolute numbers, the largest White population in Latin America is found in Brazil, with 65.3 million whites out of 191.9 million total Brazilians, or 29.7% of the total population.[44] Argentina, Mexico, Colombia, Chile and Venezuela contain the largest numbers of whites in Latin America. In terms of percentage of the total population, Argentina and Uruguay have the largest white populations, with roughly 60-90% of their respective populations being White, depending on the source and definition. Depending on the definition of "Latin America", the smallest White population in Honduras with only 1%. Guatemala's census groups both Whites and Mestizos (people of mixed White and Native American ancestry) in one category, so the exact percentage of White Guatemalans is undetermined.[45]

|
Self-reported races by percent in Latin America according to the 2011 Latinobarómetro survey.[52]
|
Central America
Costa Rica

In Costa Rica the estimates of White people slightly vary between 77%[53] and 82%,[2] or about 3.1 – 3.5 million people. A combined ratio of 83% is given for the White and Mestizo populations by the CIA World Factbook.[54] Costa Rican European ancestry is mostly Spanish, though there are significant numbers of Costa Ricans descended from Italian, Greek, German, English, Dutch, French, Irish, Portuguese, Lebanese and Polish families, as well as a sizable Jewish community.<ref group=http://books.google.co.cr/books?id=m0k-ulACLZkC&printsec=frontcover&source=gbs_ge_summary_r&cad=0#v=onepage&q&f=false>Herrera Balharry, Eugenio. Los alemanes y el estado cafetalero. Costa Rica. pp. 100–130. ISBN 9977-64-405-5.</ref>
European migrants used Costa Rica to get across the isthmus of Central America as well to reach the USA West Coast (California) in the late 19th century and until the 1910s (before the Panama Canal opened). Other European ethnic groups known to live in Costa Rica include Russians, Danes, Belgians, Portuguese, Croats, Hungarians, Turks, Armenians and Georgians.

Many of the first Spanish colonists in Costa Rica may have been Jewish converts to Christianity who were expelled from Spain in 1492 and fled to colonial backwaters to avoid the Inquisition.[55] The first sizable group of self-identified Jews immigrated from Poland, beginning in 1929. From the 1930s to the early 1950s, journalistic and official anti-Semitic campaigns fueled harassment of Jews; however, by the 1950s and 1960s, the immigrants won greater acceptance. Most of the 3,500 Costa Rican Jews today are not highly observant, but they remain largely endogamous.[56]

El Salvador
According to the official 2007 Census in El Salvador, 12.7% of El Salvadorians identified with being white.[57]
According to a genetic research by the University of Brasilia, Salvadorian genetic admixture consists in a 75.2% Amerindian, 15.1% European, and 9.7% African ancestry.[58]
Guatemala
Between the nineteenth and twentieth centuries, Guatemala counted with massive European immigration, mostly from Germany and in smaller proportion of other European nations. As of 2010-2012, a statistical study in Guatemala estimated that 18.5% of the population is white of European origin (2,7 millions),[13] mostly from Spain and Germany with other descendants of Italians, French, English, etc. This percentage was laid together with the percentage of the mestizo population, but later was clarified.
Honduras
Honduras contains perhaps the smallest percentage of whites in Latin America, with only 1% classified in this group, or up to 75,000 to 150,000 of the total population.[59] Of these, the majority are people of Spanish descent. A white population, especially descendants of Palestinians, is found in the city of San Pedro Sula, and another in the Bay Islands Department which descends from Caymanian settlers with English, Irish, Scottish, French, German, Italian and Greek descent.
Nicaragua
White Nicaraguans make up 17%, just over one million, of the Nicaraguan population,[16] mainly from Spanish, German, Italian, Portuguese, Belgian and French ancestry. In the 19th century Nicaragua experienced several waves of immigration, primarily from Europe.
Panama
White Panamanians form 10%,[60] with the Spanish being the majority. Other ancestries includes Dutch, English, French, German, Swiss, Danish, Irish, Greek, Italian, Lebanese, Portuguese, Polish, Russian and Ukrainian. There is also a sizable and very influential Jewish community.
Caribbean
Cuba
White people in Cuba make up 64.1% of the total population according to the 2012 census[61][62] with the majority being of diverse Spanish descent. However, after the mass exodus resulting from the Cuban Revolution in 1959, the number of white Cubans actually residing in Cuba diminished. Today various records claiming the percentage of whites in Cuba are conflicting and uncertain; some reports (usually coming from Cuba) still report a less, but similar, pre-1959 number of 65% and others (usually from outside observers) report a 40–45%. Despite most white Cubans being of Spanish descent, many others are of French, Portuguese, German, Italian and Russian descent.[63] During the 18th, 19th and early part of the 20th century, large waves of Canarians, Catalans, Andalusians, Castilians, and Galicians emigrated to Cuba. Also, one significant ethnic influx is derived from various Middle Eastern nations. Many Jews have also immigrated there, some of them Sephardic.[64] Between 1901 and 1958, more than a million Spaniards arrived to Cuba from Spain; many of these and their descendants left after Castro's communist regime took power.
An autosomal study from 2014 has found out the genetic ancestry in Cuba to be 72% European, 20% African and 8% native American.[65]
Dominican Republic

According to the CIA World Factbook, white persons in the Dominican Republic are 16% of the total population,[15] with the vast majority being of Spanish descent. Notable other ancestries includes French, Italian, Lebanese, German, and Portuguese.[66][67][68]
The government of Rafael Leónidas Trujillo made a point of increasing the white population, or "whitening" the racial composition of the country by rejecting black immigrants from Haiti and the local blacks as foreigners.[69] He also welcomed Jewish refugees in 1938 and Spanish farmers in the 1950s as part of this plan.[70][71] The country's German minority is the largest in the Caribbean.[72]
Haiti

The white and the mulatto population of Haiti make up about 5% of its population, while 95% is "black".[18]
However, in that minority group, Haiti is home to people of many different ethnic and national backgrounds who are French, Spanish, Middle Eastern, Portuguese, Russian, Dutch, Swiss, Armenian, Poles[73][74] (Polish legion), Jews[73][75] (arriving from the Polish legion and during the Holocaust), Germans[76][77] (18th century and World War I), and Italian influences.
Martinique
Note: Many definitions of Latin America do not include Martinique
White people in Martinique represent 5% of the population. As Martinique is an overseas French department, most whites are French.[78]
Puerto Rico
| Official census[79][80][81] | ||
|---|---|---|
| Year | White | Non-white |
| 1830 | 50.1 | 49.9 |
| 1899 | 61.8 | 38.2 |
| 2000 | 80.5 | 19.5 |
| 2010 | 75.8 | 24.2 |
| Racial composition (percentages) by the official Spanish and U.S census. | ||

White Puerto Ricans of European, mostly Spanish descent, are said to comprise the majority with 75.8% of the population identifying as white.[82] In the year 1899, one year after the U.S invaded and took control of the island, 61.8% of people identified as White. For the first time in fifty years, the 2000 United States Census asked people to define their race, the total has risen to 80.5% (3,064,862); not because there has been an influx of whites toward the island (or an exodus of non-White people), but a change of race conceptions, mainly because of Puerto Rican elites to portray Puerto Rico's image as the "white island of the Antilles", partly as a response to scientific racism.[79]
From the beginning of the 20th century American observers remarked on the "surprising preponderance of the white race" on the island. One travel writer called Puerto Rico "the whitest of the Antilles". In a widely distributed piece, a geologist, wrote that the island was "notable among the West Indian group for the reason that its preponderant population is of the white race." In a more academic book he reiterated that "Porto Rico, at least, has not become Africanized.[83]
During the 19th century, hundreds of Corsican, French, Middle Eastern, and Portuguese families, along with large numbers of immigrants from Spain (mainly from Catalonia, Asturias, Galicia, the Balearic Islands, Andalusia, and the Canary Islands) and numerous Spanish loyalists from Spain's former colonies in South America, arrived in Puerto Rico. Other settlers have included Irish, Scots, Germans, Italians, and thousands of others who were granted land from Spain during the Real Cedula de Gracias de 1815 (Royal Decree of Graces of 1815), which allowed European Catholics to settle in the island with a certain amount of free land.
According to a genetic research by the University of Brasilia, Puerto Rican genetic admixture consists in a 60.3% European, 26.4% African, and 13.2% Amerindian ancestry.[58]
Saint Barthélemy
Note: Many definitions of Latin America do not include Saint Barthélemy
Most of the population are French-speaking descendants of the first settlers from Normandy and Brittany.[84]
North America
Mexico

White people in Mexico are estimated to make up about 15% of the population,[2] although this figure varies according to the source with other estimates ranging from 9%[85] to almost 20%.[5] The majority are of Spanish descent, however many other non-Iberian immigrants (mostly French) also arrived during the Second Mexican Empire in the 1860s. During the late 19th and early 20th centuries, immigrants from Italy, Germany, Ireland, the United Kingdom, Lebanon and Palestine also made Mexico their home.[86][87] In the 20th century, White Americans, Canadians, Greeks, Romanians, Portuguese, Armenians, Poles, Russians, Jews,[87] along with many Spanish refugees fleeing the Spanish Civil War, also settled in Mexico.[88]
The central northern regions of Mexico, such as the states of Nuevo León, San Luis Potosí and Queretaro have shown the largest amount of European admixture out of all the states that have been genetically tested at 78.5%.[89]
In Mexico, the only ethnic census including categories other than Amerindian (dated back to 1921) performed by the government offered the following options in the questionnaire:[90]
- Full European heritage
- Mixed indigenous and European heritage (The term mestizo itself was never used by the government)
- Full indigenous
- Foreigners without racial distinction
- Other race
The census had the particularity that, unlike racial/ethnic census in other countries, it was focussed in the perception of cultural heritage rather than in a racial perception, leading to a good number of white people to identify with "Mixed heritage" due cultural influence.[91] In the final results, 10% of the population answered to be of entirely European heritage, while 59% of the population answered "Mixed heritage".
The weight of the cultural influence, as well as the cultural perspective the Mexican government have chosen to distinguish ethnicies is well marked: despite that based in the Mexican government's ethnic census performed on 1921 some extra official sources estimate the white population of Mexico to be only 9-16%, in genetic studies Mexico consistently shows a European admixture comparable to countries that report white populations of 52% - 77% (in the case of Chile and Costa Rica, who average 51%[92] & 60%[93] European admixture respectively, while studies in the general Mexican population have found European ancestry ranging from 56%[94] going to 60%,[95] 64%[96] and up to 78%[89]).
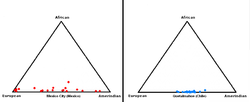
A 2012 study published by the Journal of Human Genetics found the ancestry of the Mexican mestizo population to be predominately European (64.9%), followed by Native American (30.8%) and African (4.2%). The European ancestry was prevalent in the north and west (66.7-95%) and Native American ancestry increased in the center and southeast (37-50%), the African ancestry was low and relatively homogeneous (0-8.8%).[96] The states that participated in this study were Aguascalientes, Chiapas, Chihuahua, Durango, Guerrero, Jalisco, Oaxaca, Sinaloa, Veracruz and Yucatan.[97]
Another study conducted by Mexico's National Institute of Genomic Medicine (INMEGEN) reported that mestizo Mexicans are 58.96% European, 35.05% "Asian" (Amerindian mostly), and 5.03% African. Sonora shows the highest European contribution (70.63%) and Guerrero the lowest (51.98%) which also has the highest Asian contribution (37.17%). African contribution ranges from 2.8% in Sonora to 11.13% in Veracruz. 80% of the Mexican population was classed as mestizo (defined as "being racially mixed in some degree"). The study was realized with volunteers from 6 states and an indigenous group known as Zapotecs, with these being Sonora, Zacatecas, Veracruz, Guanajuato, Oaxaca and Yucatan (Mexico is composed of 31 states and one federal district)[98]
The same study found that the Mexico's haplogroup was most similar to the European one, with the percentage of Haplotypes shared being 81%, followed by the Asian haplogroup with 74% and finally the African haplogroup, with a share rate of 64%. It was also noted by the investigators that the African admixture in general didn't came directly from the African slaves brought by the Europeans, but was already part of the genetic admixture of the colonizers themselves.[99] Another study which took place on Mexico city found the Mexican mestizo population to be the one who present the largest variation out of all the mestizo groups of Latin America (with its mestizos being either largely European or amerindian rather than having a uniform admixture) The results of this study are similar to the ones made by the INMEGEN with the European admixture being found to be dominant with 56.8% followed by the Asian (native American) ancestry with 39.8% and a small African contribution of 3.4%.[94] Additional studies suggests a tendency relating a higher European admixture with a higher socioeconomic status and a higher amerindian ancestry with a lower socioeconomic status: a study made exclusively on low income Mexicans found the mean admixture to be 0.590, 0.348, and 0.062 for amerindian, European and African respectively,[100] while a study made on Mexicans whose income was higher than the mean found their European admixture to be 81%.[101]
In the last decade, Mexico's economic growth have boosted international migration to the country, including people of European descent who leave their countries (particularly France and Spain) in search of better work opportunities. People from the United States have moved as well, now making up more than three-quarters of Mexico’s roughly one million documented foreigners, up from around two-thirds in 2000, nowadays, more people Originary from United States have been added to the population of Mexico than Mexicans have been added to the population of the United States, according to government data in both nations.[102]
United States of America


In the United States, a White Hispanic or White Latino[103] is a citizen or resident who is racially white and of Hispanic descent. White American, itself an official U.S. racial category, refers to people "having origins in any of the original peoples of Europe, the Middle East, or North Africa" who reside in the United States.[104]
Based on the definitions created by the Office of Management and Budget and the U.S. Census Bureau, the concepts of race and ethnicity are mutually independent, and respondents to the census and other Census Bureau surveys are asked to answer both questions. Hispanicity is independent of race, and constitutes an ethnicity category, as opposed to a racial category, the only one of which that is officially collated by the U.S. Census Bureau. For the Census Bureau, Ethnicity distinguishes between those who report ancestral origins in Spain or Hispanic America (Hispanic and Latino Americans), and those who do not (Non-Hispanic Americans).[105][106] The U.S. Census Bureau asks each resident to report the "race or races with which they most closely identify."[107]
White Americans are therefore divided between "White Hispanic" and "Non Hispanic White," the former consisting of White Americans who report Hispanophone ancestry (Spain and Hispanic Latin America), and the latter consisting of White Americans who do not report Hispanophone ancestry. (Note that Brazilian Americans are not considered "Hispanic" by the Census Bureau.)[108][109][110]
As of 2010, 50.5 million or 16.3% of Americans were ethnically Hispanic or Latino.[111] Of those, 26.7 million, or 53%, were White.
South America
Argentina
Genetically, the composition of Argentina is mostly European in ancestry, with both Native American and African contributions. A 2009 autosomal DNA study found out the Argentine population 78.5 percent European, 17.3 percent Native American and 4.2 percent sub-Saharan African.[112] A 2012 autosomal DNA study found out the following composition in Argentina: 65% European, 31% native American and 4% African [113]
Argentina's National Institute of Statistics and Censuses (INDEC) does not conduct ethnic/racial censuses, so no official data exist on the precise amount or percentage of White Argentines today. Nevertheless, various sources estimate the White Euro-descended population in the country to be between 85% and 86.4%.[2][114][115][116] These figures increase to between 86.1% and 89.7% if the non-European Caucasian groups (such as Jews, Lebanese and other Middle Easterners) are also counted. Summing up, these percentages would result in an estimated population of 34-36 million White people in Argentina. White Argentines are dispersed throughout the country, but their concentration is greatest in the east-central region of Pampas, the southern region of Patagonia, and in the west-central region of Cuyo. Their concentration is smaller in the north-eastern region of Litoral and much smaller in the north-western provinces of Salta, Jujuy, Tucumán, Catamarca, La Rioja and Santiago del Estero, This is because these provinces were the most densely populated region of the country (mainly by Amerindian and Mestizo people) before the immigratory wave of 1857-1940, and it was the area where the European newcomers settled the least.[117][118] During the last few decades, due to internal migration from these northern provinces as well as to immigration mostly from Bolivia, Peru and Paraguay, the percentage of White Argentines in certain areas of the Greater Buenos Aires, and the provinces of Salta and Jujuy has decreased significantly as well.[119]
White population residing in Argentina is mostly descendant of immigrants arrived from Europe and the Middle East between the late 19th Century and the early 20th century, and in smaller proportion from Spaniards of the colonial period. Out of the total estimation of 437,669 Spaniards who settled in the American Spanish colonies during the period 1506-1650 made by M. Möner, Peter Muschamp Boyd-Bowman estimated that a figure between 10,500 and 13,125 Peninsulares established in the Río de la Plata region.[120] The colonial censuses conducted after the creation of the Viceroyalty of the Río de la Plata showed that the proportion of Spaniards and Criollos was very significant in the cities and surrounding countryside, but not so much in the rural areas. The 1778 Census ordered by viceroy Juan José de Vértiz in Buenos Aires revealed that, of a total population of 37,130 inhabitants (including both city and surrounding countryside), the Spaniards and Criollos numbered 25,451, or 68.55% of the total. Another census carried out in the Corregimiento de Cuyo in 1777 showed that the Spaniards and Criollos numbered 4,491 (or 51.24%) out of a population of 8,765 inhabitants. In Córdoba (city and countryside) the Spanish/Criollo people comprised a 39.36% (about 14,170) of 36,000 inhabitants.[121]
Data provided by Argentina's Dirección Nacional de Migraciones (National Bureau of Migrations) states that the country received a total 6,611,000 European and Middle Eastern immigrants during the period 1857-1940.[122] The main immigrant group were the 2,970,000 Italians arrived in the period (44.9% of the total); initially they came from Piedmont, Veneto and Lombardy, and later from Campania, Calabria and Sicily.[123] The second group in importance were the Spaniards, some 2,080,000 (31.4% of the total); They were mostly Galicians and Basques, but also Asturians, Cantabrians, Catalonians and Andalucians). In smaller but significant numbers came Frenchmen from Occitania (239,000, 3.6% of the total) and Polish (180,000 – 2.7%). From the Russian Empire came some 177,000 people (2.6%); they were not only ethnic Russians, but also Ukrainians, Belarusians, Volga Germans, Lithuanians, etc. From the Ottoman Empire the contributors were mainly Armenians, Lebanese and Syrians, some 174,000 in all (2.6%). Very closely in numbers come the immigrants from the German Empire, some 152,000 (2.2%). From the Austro-Hungarian Empire came 111,000 people (1.6%), among them Austríans, Hungarians, Croatians, Bosniaks, Serbs, Ruthenians and Montenegrins. Among the 75,000 British immigrants there were many people from England and Wales, but most of them were Irish people who were escaping the potato famine or the British rule. Other minor groups were the Portuguese (65,000), the Slavic peoples from ex-Yugoslavia (48,000), the Swiss (44,000), the Belgians (26,000), the Danes (18,000), the White Americans (12.000), the Dutch (10,000), and the Swedish (7,000). Even colonists from Australia, and Boers from South Africa can be found in the Argentine immigration records.

In the 1910s, when the immigration rate reached its peak, more than 30% of Argentina’s population was born in Europe, and over half of Buenos Aires city's population was born abroad. According to the 1914 National Census, the 80% out of a total population of 7.903.662 people were either Europeans, or their children and grandchildren. Among the remaining 20% (the descendants of the residing population previous to the immigratory wave), about a third were White. Put down in numbers, that meant that an 86.6% or about 6.8 million people residing in Argentina were White.[126] European immigration continued accounting for over half the population growth of the nation during the 1920s,[127] and in smaller waves after the Second World War. Many Europeans migrated in Argentina after the great conflict, escaping hunger and destruction. According to the Argentine records, 392.603 people from the Old World entered the country in the 1940s. In the following decade, the flow diminished because the Marshall Plan improved Europe's economy, and emigration was not such a necessity; even then, immigratory records state that between 1951 and 1970 other 256,252 Europeans entered Argentina.[128] From the 1960s onwards, when it comprised 76.1% of the total, increasing immigration from the northern bordering countries (Bolivia, Peru and Paraguay)[129] has significantly increased the process of Mestizaje in certain areas of Argentina, especially the Greater Buenos Aires. This is mainly because the aforementioned countries have Amerindian and Mestizo majorities.[130][131][132]
In 1992, after the fall of the Communist regimes of the Soviet Union and its allies, the governments of Western Europe were worried about a possible massive exodus from Central Europe and Russia. President Carlos Menem offered to receive part of that emigratory wave in Argentina. On 19 December 1994, Resolution 4632/94 was enacted, allowing a "special treatment" for all the applicants who wished to emigrate from the republics of the ex-Soviet Union. Summarizing, from January 1994 till December 2000, a total 9,399 Central and Eastern Europeans travelled and settled in Argentina. Of the total, 6,720 were Ukrainians (71.5%), 1,598 were Russians (17%), 526 were Romanians, Bulgarians, Armenians, Georgians, Moldovans, and Poles, and 555 (5.9%) travelled with Soviet passport.[133] An 85% of the newcomers were under age 45, and 51% had tertiary level education, so most of them integrated quite rapidly into Argentine society, although some had to work for lower wages than expected at the beginning.[134]
Bolivia
White people in Bolivia make up less than 20% of the nation's population, or up to 2.0 million.[14] The white population consists mostly of criollos, which consist of families of unmixed Spanish ancestry from the Spanish colonists and also Spanish refugees fleeing the 1936–1939 Spanish Civil War. These have formed much of the aristocracy since independence. Other groups within the white population are Germans, who founded the national airline Lloyd Aéreo Boliviano, as well as Italians, Americans, Basques, Lebanese, Croats, Russians, Polish, English, Irish, and other minorities, many of whose members descend from families that have lived in Bolivia for several generations.
Brazil


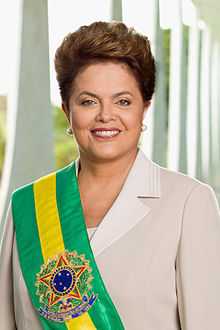
Brazil is one of the few countries in Latin America that includes racial categories in its censuses: Branco (White), Negro (Black), Pardo (Multiracial), Amarelo (Yellow) and Indígena (Amerindian); categorization is made by self-identification. Taking into account the data provided by the last National Household Survey conducted in 2010, Brazil would possess the most numerous White population in Latin America, given that a 47.7% -91 million people- of Brazilians self-declared "Brancos".[3] Comparing this survey with previous censuses, a slow but constant decrease in the percentages of self-identified White Brazilians can be noticed: in the 2000 Census it was 53.7%;[139][140] but in the 2006 Household Survey it was 49.9%[141] and in the last 2008 survey it diminished even more, down to current 48.4%.[142] Some analysts consider that this decreasing as more Brazilians reappreciate their mixed ancestry and then they re-classify themselves as "Pardos".[143]

Furthermore, some demographers estimate that a 15% of the self-declared White Brazilians have certain degree of African and Amerindian ancestry, for which -if the US one-drop rule was applied- they could be classified as "Pardos".[144]
White Brazilian population is spread all over the national territory, but it is concentrated in the four southernmost states, where a 79,6% of the population self-identify as White.[141] The states with more White people are: Santa Catarina (85,7%), Rio Grande do Sul (81,4%), Paraná (71,3%) and São Paulo (70.4%). Other four states have significant proportions of Whites; and they are: Rio de Janeiro (55,8%), Mato Grosso do Sul (51,6%), Minas Gerais (44,2%) and Goiás (40,1%).[145]
By the time Brazil became independent, an estimated 500,000–700,000 Europeans had already left for Brazil, most of them male colonial settlers from Portugal.[146][147] Rich immigrants, who established the first sugarcane plantations in Pernambuco and Bahia, and, on the other hand, banished New Christians and Gypsies fleeing from religious persecution were among the early settlers. In the 18th century, an estimated 600,000 Portuguese arrived, including wealthier immigrants, as well as poor peasants attracted by the Brazil Gold Rush that was going on in Minas Gerais.[148]
After its independence, declared by emperor Pedro I in 1822, Brazil began several campaigns to attract European immigrants, shaped by a manifest policy of Branqueamento (Whitening).[39] During the 19th century the slave labour force was gradually replaced by European immigrants, especially Italians.[149] This happened particularly after 1850, as a result of the end of slave traffic in the Atlantic Ocean and the growth of coffee plantations in São Paulo region.[150][151] European immigration had its momentum peak between the mid-19th century and mid-20th century, when nearly five million Europeans migrated to Brazil, most of them Italians, Portuguese, Germans, Spaniards, Poles, Lithuanians, and Ukrainians. Between 1877 and 1903, 1,927,992 immigrants entered Brazil, an average of 71.000 people per year. The process reached it peak in 1891, when 215,239 Europeans arrived. The period was characterized by an intense arrival of Italians (58.5%) and a lower income of Portuguese (20%).[152]

After the First World War, Portuguese became once more the main immigrant group, and Italians fell to third place. The Spanish immigrants rose to the second place because of the poverty that was affecting millions of rural workers;[154] Germans occupy the fourth place in the list; they arrived especially during the Weimar Republic, due to poverty and unemployment caused by the First World War. .[155] From 1914 to 1918, the entrance of Europeans of other ethnicities increased; among these were people from Poland, Russia and Romania, who emigrated in the 1920s, probably because of politic persecution. Other peoples migrated from the Middle East, especially immigrants from what now is Syria and Lebanon.[152] Summarizing, estimates affirm that during the period 1821-1932, Brazil received 4.431.000 European immigrants.[41]
After the end of the Second World War, European immigration diminished significantly, though between 1931 and 1963 1.1 million immigrants entered Brazil, mostly Portuguese.[149] Besides, by the mid-1970s, many Portuguese emigrated to Brazil after the independence of the African colonies: from Angola, Mozambique and Guinea-Bissau; some also migrated from Macao, because of the dictatorship installed there.[156][157]


The Brazilian population has European, African, and Native American contributions. The European is most significant among the "whites" and "pardos". African ancestry is greater among the "blacks." The Native American ancestry is present throughout Brazil, though to a lesser degree in "whites", "pardos" and "blacks."
An autosomal study from 2013, with nearly 1300 samples from all of the Brazilian regions, found a pred. degree of European ancestry combined with African and Native American contributions, in varying degrees. 'Following an increasing North to South gradient, European ancestry was the most prevalent in all urban populations (with values up to 74%). The populations in the North consisted of a significant proportion of Native American ancestry that was about two times higher than the African contribution. Conversely, in the Northeast, Center-West and Southeast, African ancestry was the second most prevalent. At an intrapopulation level, all urban populations were highly admixed, and most of the variation in ancestry proportions was observed between individuals within each population rather than among population'.[159]
| Region | European | African | Native American |
|---|---|---|---|
| North Region | 51% | 17% | 32% |
| Northeast Region | 56% | 28% | 16% |
| Central-West Region | 58% | 26% | 16% |
| Southeast Region | 61% | 27% | 12% |
| South Region | 74% | 15% | 11% |
According to an autosomal DNA study conducted in 2011, with nearly 1000 white pardo black Brazilian samples (according to their respective proportions), European ancestry is predominant in all regions of Brazil, with African and Native American contributions. According to this study, European ancestry accounts for 70% of the population.[160] This study verified that Brazilians from different regions are genetically more homogenous than some expected.[161] The 2011 autosomal study samples came from blood donors (the lowest classes constitute the great majority of blood donors in Brazil [162]), and also public health institutions personnel and health students.
| Region [160] | European | African | Native American |
|---|---|---|---|
| Northern Brazil | 68.80% | 10.50% | 18.50% |
| Northeast of Brazil | 60.10% | 29.30% | 8.90% |
| Southeast Brazil | 74.20% | 17.30% | 7.30% |
| Southern Brazil | 79.50% | 10.30% | 9.40% |
According to a DNA study from 2010, "a new portrayal of each ethnicity contribution to the DNA of Brazilians, obtained with samples from the five regions of the country, has indicated that, on average, European ancestors are responsible for nearly 80% of the genetic heritage of the population. The variation between the regions is small, with the possible exception of the South, where the European contribution reaches nearly 90%. The results, published by the scientific magazine American Journal of Human Biology by a team of the Catholic University of Brasília, show that, in Brazil, physical indicators such as skin colour, colour of the eyes and colour of the hair have little to do with the genetic ancestry of each person, which has been shown in previous studies (regardless of census classification).[163] "Ancestry informative SNPs can be useful to estimate individual and population biogeographical ancestry. Brazilian population is characterized by a genetic background of three parental populations (European, African, and Brazilian Native Amerindians) with a wide degree and diverse patterns of admixture. In this work we analyzed the information content of 28 ancestry-informative SNPs into multiplexed panels using three parental population sources (African, Amerindian, and European) to infer the genetic admixture in an urban sample of the five Brazilian geopolitical regions. The SNPs assigned apart the parental populations from each other and thus can be applied for ancestry estimation in a three hybrid admixed population. Data was used to infer genetic ancestry in Brazilians with an admixture model. Pairwise estimates of F(st) among the five Brazilian geopolitical regions suggested little genetic differentiation only between the South and the remaining regions. Estimates of ancestry results are consistent with the heterogeneous genetic profile of Brazilian population, with a major contribution of European ancestry (0.771) followed by African (0.143) and Amerindian contributions (0.085). The described multiplexed SNP panels can be useful tool for bioanthropological studies but it can be mainly valuable to control for spurious results in genetic association studies in admixed populations".[164] It is important to note that "the samples came from free of charge paternity test takers, thus as the researchers made it explicit: "the paternity tests were free of charge, the population samples involved people of variable socioeconomic strata, although likely to be leaning slightly towards the ‘‘pardo’’ group".[165]
| Region[165] | European | African | Native American |
|---|---|---|---|
| North Region | 71,10% | 18,20% | 10,70% |
| Northeast Region | 77,40% | 13,60% | 8,90% |
| Central-West Region | 65,90% | 18,70% | 11,80% |
| Southeast Region | 79,90% | 14,10% | 6,10% |
| South Region | 87,70% | 7,70% | 5,20% |
An autosomal DNA study from 2009 found a similar profile "all the Brazilian samples (regions) lie more closely to the European group than to the African populations or to the Mestizos from Mexico".[166]
| Region[167] | European | African | Native American |
|---|---|---|---|
| North Region | 60,6% | 21,3% | 18,1% |
| Northeast Region | 66,7% | 23,3% | 10,0% |
| Central-West Region | 66,3% | 21,7% | 12,0% |
| Southeast Region | 79,1% | 14,9% | 7,0% |
| South Region | 81,5% | 9,3% | 9,2% |
According to an autosomal genetic study by the University of Brasilia, in 2008, the composition of Brazil is about 65% European, 25% African and 9% native American.[168]
São Paulo state, the most populous state in Brazil, with about 40 million people, showed the following composition, according to an autosomal study from 2006: European genes account for 79% of the heritage of the people of São Paulo, 14% are of African origin, and 7% Native American.[169] A more recent study, from 2013, found the following composition in São Paulo state: 61,9% European, 25,5% African and 11,6% native American.[170]
A comprehensive genetic study presented by the Brazilian Journal of Medical and Biological Research found that. on average, 'White' Brazilians have >70% European genomic ancestry, whereas 'black' Brazilians have 37.1% European genomic ancestry. It concluded that "The high ancestral variability observed in Whites and Blacks suggests that each Brazilian has a singular and quite individual proportion of European, African and Amerindian ancestry in his/her mosaic genomes. Thus, the only possible basis to deal with genetic variation in Brazilians is not by considering them as members of colour groups, but on a person-by-person basis, as 190 million human beings, with singular genome and life histories".[171]
Chile


According to genetic research by Ricardo Cruz-Coke and Rodrigo Moreno in 1994, Chilean genetic admixture consists in a 64% European, 35% Amerindian, and 1% African ancestry.[172] The European admixture goes from 81% in East Santiago to 61% in West Santiago. Valparaiso (Chilean central coast) and Concepción (central southern Chile) have 77% and 75% of European genetic admixture respectively.[172]
Another autosomal DNA study from 2014 found out the results to be 44.34% (± 3.9%) native American, 51.85% (± 5.44%) European and 3.81% (± 0.45%) African.[92][173]
A 2015 autosomal DNA study found out Chile to be 42.38% native American, 55.16% European and 2.44% African (using LAMP-LD) and 43.22% native American, 54.38% European and 2.40% African (using RFMix)[174]
About 30% of Chilean population is Caucasian according to a research of the University of Chile.[175] Other studies estimates White population at 20%,[176] or 52.7% of Chilean population.[2] According to an international genetic research by the University of Brasilia, Chilean genetic admixture consists in a 51.6% European, 42.1% Amerindian, and 6.3% African ancestry.[58] According to an autosomal genetic study of 2014 carried out among soldiers in the city of Arica, Northern Chile, the European admixture goes from 56.8% in soldiers born in Magallanes to 41.2% for the ones who were born in Tarapacá.[177] According to an international genetic study from 2013 conducted by the Candela Project in Northern Chile as well, the genetic admixture of Chile is 52% European, 44% native American and 4% African.[178]
The genotype and phenotype in Chileans varies according to the different social classes. Upper-middle class Chileans are mostly of European ancestry. Their genetic admixture consists of 91% European and 9% Amerindian. On the other hand, middle class Chileans are 70% European, 29% Native American and 1% African, whilst lower class Chileans are 41% European, 57% Indigenous and 2% African.[172] 13% of lower class Chileans have at least one non-Hispanic European surname, compared to a 72% of those who belong to the upper-middle class.[179] Phenotypically, only a 9,6% among lower class girls have light eyes -either green or blue-, a percentage that reaches the 31,6% among upper-middle class girls.[179] Blonde hair is present in 21,3% and 2,2% of upper-middle and lower class girls respectively.,[179] whilst black hair is more common among lower class girls (24,5%) than the upper-middle class ones (9,0%).[179]
Chile was never an attractive place for migrants simply because it was far from Europe, and the difficulty of reaching such a remote place. However, during the 18th century an important flux of emigrants from Spain populated Chile, mostly Basques, who vitalized economy and rose rapidly in the social hierarchy and became the political elite that still dominates the country.[180][181]
An estimated 1.6 million (10%) and 3.2 million (20%) Chileans have a surname (one or both) of Basque origin.[182][183][184][185][186][187][188][189]
The Basques liked Chile because of its great similarity to their native land: similar geography, cool climate, fruits, seafood and wine.[181]
The Spaniard was actually the only relevant among European immigration to Chile,[190] since there was never a massive immigration, as happened in neighboring nations such as Argentina or Uruguay.[191] Therefore, neither have whitened the Chilean population to level of overall percentages.[191] However, it is undeniable that immigrants have played a role in Chilean society.[191] Between 1851 and 1924 Chile only received the 0.5% of the European immigration flow to Latin America, against 46% of Argentina, 33% of Brazil, 14% of Cuba, and 4% of Uruguay.[190] This was because most of the migration occurred across the Atlantic, not the Pacific, and that this migration occurred mostly before the construction of the Panama Canal.[190] Also, Europeans preferred to stay in countries closer to their homelands instead of taking that long tour across the Straits of Magellan or crossing the Andes.[190] In 1907, European-born reached a top of 2.4% of Chilean population,[192] it down to 1.8% in 1920,[193] and 1.5% in 1930.[194]
After the failed liberal revolution of 1848 in the German states,[191][195] an noticeable German immigration took place, laying the foundation for the German-Chilean community. Sponsored by the Chilean government for "unbarbarize" and colonize the southern region,[191] these Germans (including German-speaking Swiss, Silesians, Alsatians and Austrians) settled mainly in Valdivia, Llanquihue, Chiloé and Los Ángeles.[196] The Chilean Embassy in Germany estimated 150,000 to 200,000 Chileans are of German origin.[197][198]
It is estimated that nearly 5% of the Chilean population is of Asian descent, chiefly from the Middle East, i.e., Jews/Israelis, Palestinians, Syrians, and Lebanese, totaling around 800,000.[199][200] Chile is home to a large population of immigrants, mostly Christian, from the Levant.[201] Roughly 500,000 Palestinian descendants are believed to reside in Chile.[202][203][204][205][206]
Another historically significant immigrant group is Croatian. The number of their descendants today is estimated to be 380,000 persons, the equivalent of 2.4% of the population.[207][208] Other authors claim, on the other hand, that close to 4.6% of the Chilean population must have some Croatian ancestry.[209] Over 700,000 Chileans may have British (English, Scottish or Welsh) origin. 4.5% of Chile's population.[210] Chileans of Greek descent are estimated 90,000 to 120,000.[211] Most of them live either in the Santiago area or in the Antofagasta area, and Chile is one of the 5 countries with the most descendants of Greeks in the world.[212] The descendants of the Swiss reach 90,000[213] and it is estimated that about 5% of the Chilean population has some French ancestry.[214] 184,000 are descendants of Italians.[215] Other groups of European descendants have followed, but are found in smaller numbers. They did transform the country culturally, economically and politically.
Colombia
The 2005 census reported that the “nonethnic population,” consisting of whites and mestizos (those of mixed white European and Amerindian ancestry, including almost all of the urban business and political elite), constituted 86 percent of the national population. The 86 percent figure is subdivided into 49 percent mestizo and 37 percent white.The census figures show how Colombians see themselves in terms of race.
— Colombia: A Country Study, Colombia: A Country Study; pp. 86-87
The proportion of the Colombian population with primarily European ancestry is estimated at approximately 20%, but in the 2005 Census, 37% of the total population self identified as white.[6] According to genetic research by the University of Brasilia, Colombian genetic admixture consists in a 45.9% European, 33.8% Amerindian, and 20.3% African ancestry.[58]

White Colombians are mostly descendants of Spaniards although Italian, German, Irish, Portuguese, and Lebanese Colombians are found in notable numbers. Many Spanish began their explorations searching for gold, while others Spanish established themselves as leaders of the native social organizations teaching natives the Christian faith and the ways of their civilization. Catholic priest would provide education for Native Americans that otherwise was unavailable. Within 100 years after the first Spanish settlement, nearly 95 percent of all Native Americans in Colombia had died. The majority of the deaths of Native Americans were the cause of diseases such as measles and smallpox, which were spread by European settlers. Many Native Americans were also killed by armed conflicts with European settlers.[217] Between 1540 and 1559, 8.9 percent of the residents of Colombia were of Basque origin. It has been suggested that the present day incidence of business entrepreneurship in the region of Antioquia is attributable to the Basque immigration and Basque character traits. Today many Colombians of the Department of Antioquia region follow and preserve their Basque ethnic heritage. In Bogota, there is a small district/colonies of Spanish families who emigrated as a consequence of Spain's Civil War or because of different opportunities.[218] Basque priests were the ones that introduced handball into Colombia. Basque immigrants in Colombia were devoted to teaching and public administration. In the first years of the Andean multinational company, Basque sailors navigated as captains and pilots on the majority of the ships until the country was able to train its own crews.[219] In December 1941 the United States government estimated that there were 4,000 Germans living in Colombia. There were some Nazi agitators in Colombia, such as Barranquilla businessman Emil Prufurt. Colombia invited Germans who were on the U.S. blacklist to leave.[220] SCADTA, a Colombian-German air transport corporation which was established by German expatriates in 1919, was the first commercial airline in the western hemisphere.[221] In recent years, the celebration of Colombian-German heritage has grown increasingly popular in Bogota, Cartagena, and Bucaramanga. There are many annual festivals that focus German cuisine, specially pastry arts and beer. Beginning in 2009, there has been great increases in collaborative research though advanced business and educational exchanges such as those promoted by COLCIENCIAS and AIESEC . There are many Colombian-German companies focused on finance, science, education, technology and innovation, and engineering.[222] The first and largest wave of immigration from the Middle East began around 1880, and remained during the first two decades of the twentieth century. They were mainly Maronite Christians from Greater Syria (Syria and Lebanon) and Palestine, fleeing the then colonized Ottoman territories.[223] Syrians, Palestinians, and Lebanese continued since then to settle in Colombia. Due to poor existing information it's impossible to know the exact number of Lebanese and Syrians that immigrated to Colombia. A figure of 5,000-10,000 from 1880 to 1930 may be reliable and Syrians and Lebanese are perhaps the biggest immigrant group next to the Spanish since independence. Those who left their homeland in the Middle East to settle in Colombia left for different reasons such as religious, economic, and political reasons. Some left to experience the adventure of migration. After Barranquilla and Cartagena, Bogota stuck next to Cali, among cities with the largest number of Arabic-speaking representatives in Colombia in 1945.[224] The Arabs that went to Maicao were mostly Sunni Muslim with some Druze and Shiites, as well as Orthodox and Maronite Christians. The mosque of Maicao is the second largest mosque in Latin America. Middle Easterns are generally called Turcos (Turkish).[223]
Ecuador
According to the 2010 National Population Census, 6.1% of the population self recognized as white, down from 10.5% in 2001.[225] In Ecuador being white Ethnic is more a designator of social class than of ethnicity. Classifying oneself as white is often used to claim membership to the middle class and to distance oneself from the lower class which is associated with racial status as "indian". For this reason status as "blanco" can be claimed by people who are not primarily of European heritage.[226]
White Ecuadorians, mostly criollos, descendants of Spanish colonists and also Spanish refugees fleeing the 1936—1939 Spanish Civil War. Most still hold large amounts of lands, mainly in the northern Sierra, and live in Quito or Guayaquil. There is also a large number of white people in Cuenca, a city in the southern Andes of Ecuador, due to the arrival of Frenchmen in the area, in order to measure the arc of the Earth. Cuenca, Loja, and the Galápagos attracted German immigration during the early 20th century, and the Galápagos also had a small Norwegian fishing community until they were asked to leave. Also there is a large sizable population with people of Italian, French, German, Basque, Portuguese, and Greek descent, as well as a small Ecuadorian Jewish population.
According to a genetic research by the University of Brasilia, Ecuadorian genetic admixture consists in a 64.6% Amerindian, 31.0% European, and 4.4% African ancestry.[58]
French Guiana
Note: Many definitions of Latin America do not include French Guiana
12% of the population, mostly French.[227]
Paraguay
Ethnically, culturally, and socially, Paraguay has one of the most homogeneous populations in South America. Because of José Gaspar Rodríguez de Francia's policy that no white Spaniards and Europeans may intermarry (they could only marry blacks, mulattoes, mestizos or the native Guaraní) established in 1814, a measure taken to avoid white supremacy being established in Paraguay (De Francia believed that all men were equal as well), it was within little more than one generation that most of the population were of mixed racial origin.
The exact percentage of the white Paraguayan population is not known because the Paraguayan census does not include racial or ethnic identification, save for the indigenous population,[228] which reached 1.7% of the country's total in the last census in 2002.[229] Other sources estimate the other groups. The mestizo population is estimated at 95% by the CIA World Factbook, and all other groups at 5%.[230] Thus, Whites and the remaining groups (Asians, Afro-Paraguayans, others, if any) combine for approximately 3.3% of the total population. Such reading is complicated, because as elsewhere in Latin America, white and mestizo are not categories that make the other necessarily excluded (people may identify as both), and there was considerable European immigration to Paraguay and surrounding regions, that later immigrated to it.
Due to the European migration in the 19th and 20th centuries, the majority of whites are of German descent (including Mennonites), with others being of French, Italian, Spanish, and Portuguese descent.[231] Many are southern and southeastern Brazilians (brasiguayos) as well Argentines and Uruguayans, and their descendants.[231] People from such regions are generally descendants of colonial settlers and/or more recent immigrants.[231]
In 2005, 600 families of Volga Germans who migrated to Germany after the fall of the Soviet Union, re-migrated and established a new colony near Yuty (Caazapá Department), in Southeastern Paraguay, named Neufeld.[232]
Peru

White Peruvians represent (4.9%) according to a 2006 survey from the Instituto Nacional de Estadística e Informática (INEI).[233] and 15.5% or 4.6 million people according to the CIA World Factbook.[10] They are descendants primarily of Spanish colonists, and also of Spanish refugees fleeing the Spanish Civil War; after World War II many German refugees fled to Peru and settled in large cities, while many others descend from Italian, French (mainly Basques), Austrian or German, Portuguese, British, Russians, Croats, Lebanese, Jordanian, and Syrian immigrant families. The majority of the whites live in the largest cities, concentrated usually in the northern coastal cities of Trujillo, Chiclayo, Piura, and of course the capital Lima. The only southern city with a significant white population is Arequipa. To the north Cajamarca and San Martín Region, and the highlands of Northwestern Peru are also places with a very strong Spanish (and other European) influence and ethnic presence.
According to a genetic research by the University of Brasilia, Peruvian genetic admixture consists in a 73.0% Amerindian, 15.1% European, and 11.9% African ancestry.[58]
Uruguay
A 2009 DNA study in the American Journal of Human Biology showed the genetic composition of Uruguay as primarily European, with Native American ancestry ranging from one to 20 percent and sub-Saharan African from seven to 15 percent (depending on region).[234]
Uruguay received between the mid-19th century and the early 20th century part of the same migratory influx received by Argentina, though the process started a little earlier. During the period 1850-1900, this country welcomed four waves of European immigrants, mainly Spaniards, Italians and Frenchmen. In smaller numbers also arrived British, Germans, Swiss, Russians, Portuguese, Poles, Bulgarians, Hungarians, Ukrainians, Lithuanians, Estonians, Dutch, Belgians, Croatians, Lebanese, Armenians, Greeks, Scandinavians and Irish. The demographic impact of these immigratory waves was even greater than in Argentina: Uruguay evolved from having 70,000 inhabitants in 1830 to have 450,000 in 1875, and a million inhabitants in 1900; i.e., its population increased fourteen-fold in only 70 years. Between 1840 and 1890, 50%-60% of Montevideo's population was born abroad, almost all in Europe. The Census conducted in 1860 showed that 35% of the country's population was made up by foreigners, although by the time of the 1908 Census this figure had decreased to 17%.[235]
The National Institute of Statistics (INE) of Uruguay conducted during 1996-1997 a Continuous Household Survey in 40,000 homes, that included the topic of races in the country. Its results were based on "the explicit statements of the interviewee about the race they consider they belong themselves". These results were extrapolated, and the INE estimated that out of the 2,790,600 inhabitants that Uruguay had at that moment, some 2,602,200 were White (93.2%), some 164,200 (5.9%) were totally or partially Black, some 12,100 were totally or partially Amerindian (0.4%), and the remaining 12,000 considered themselves Yellow.[236]
A new Enhanced National Household Survey conducted in 2006 touched on the topic again, but this time enfazising on "ancestry" and not on "race"; the results revealed a 5.8% more Uruguayans that stated having total or partial Black and/or Amerindian ancestry. This reduction in the percentage of self-declared "pure Whites" in between surveys could be caused by a phenomenon of the interviewee giving new value to their African heritage, similar to what has happened in Brazil in the three last censuses. Anyway, it is worth noting that 2,897,525 interviewées declared having only White ancestry (87.4%), 302,460 declared having total or partial Black ancestry (9.1%), 106,368 total or partial Amerindian ancestry (2.9%) and 6,549 total or partial Yellow ancestry (0.2%).[237] This figure matches external estimates for White population in Uruguay of 87,4%[238] 88%,[2][239] or 90%.[240]
During the last decade many European and American immigrants have entered this country seeking peace and security, and also escaping from pollution and the voracious tax systems in their countries of origin. In 1997, the Uruguayan government granted residence rights to only 200 European/American citizens; in 2008 the number of residence rights granted had increased up to 927.[241]
Venezuela


White Venezuelan is an unofficial term to describe the Venezuelan citizen of European origin. According to the 2011 National Population and Housing Census, 43.6% of the population self recognized as white.[7][8] At least 60,6% of Venezuelans are from European ancestry.[242]
According to a genetic research by the University of Brasilia, Venezuelan genetic admixture consists in a 60.6% European, 23.0% Amerindian, and 16.3% African ancestry.[58] Equally, According to figures in the report "Migration and Remittances Factbook 2011" World Bank, more than one million people emigrated. Although Venezuela is among the 10 migration corridors in the region in 2010 was the second regional immigration Square after Argentina, and the second received more refugees in the world marketplace.[243]
Spaniards were introduced into Venezuela during the colonial period. Most of them were from Andalusia, Galicia, Basque Country and from the Canary Islands. Until the last years of World War II, a large part of the European immigrants to Venezuela came from the Canary Islands, and its cultural impact was significant, influencing the development of Castilian in the country, its gastronomy and customs. With the beginning of oil operations during the first decades of the 20th century, citizens and companies from the United States, United Kingdom and Netherlands established themselves in Venezuela. Later, in the middle of the century, there was a new wave of originating immigrants from Spain (mainly from Galicia, Andalucia and the Basque Country), Italy (mainly from southern Italy and Venice) and Portugal (from Madeira) and new immigrants from Germany, France, England, Croatia, Netherlands, the Middle East and other European countries, among others, animated simultaneously by the program of immigration and colonization implanted by the government.
The majority of white Venezuelans are of Spanish, Lebanese, Italian, Portuguese, and German descent. Nearly half a million European immigrants, mostly from Spain (as a sequel of the Spanish Civil War), and from Italy and Portugal, entered the country during and after World War II, attracted by a prosperous, rapidly developing country where educated and skilled immigrants were welcomed.
Representation in the media
Some American media outlets have criticised Latin American media for allegedly featuring a disproportionate number of blond and blue-eyed/green-eyed white Latin American actors and actresses in telenovelas relative to non-white Latin Americans and non-white Hispanic and Latino Americans.[244][245][246][247][248][249][250][251]
See also
Notes and references
- ↑ 1.0 1.1 CIA data from The World Factbook's Field Listing :: Ethnic groups and Field Listing :: Population, retrieved on May 09 2011. They show 191,543,213 whites from a total population of 579,092,570. For a few countries the percentage of white population is not provided as a standalone figure, and thus that datum is considered to be not available; for example, in Chile's case the CIA states "white and white-Amerindian 95.4%". Unequivocal data are given for the following: Argentina 41,769,726 * 97% white = 40,516,634; Bolivia 10,118,683 * 15% white = 1,517,802; Brazil 203,429,773 * 53.7% white = 109,241,788; Colombia 44,725,543 * 20% white = 8,945,109; Cuba 11,087,330 * 65.1% white = 7,217,852; Dominican Republic 9,956,648 * 16% white = 1,593,064; El Salvador 6,071,774 * 9% white = 546,460; Honduras 8,143,564 * 1% white = 81,436; Mexico 113,724,226 * 9% white = 10,235,180; Nicaragua 5,666,301 * 17% white = 963,272; Panama 3,460,462 * 10% white = 346,046; Peru 29,248,943 * 15% white = 4,387,342; Puerto Rico 3,989,133 * 76.2% white = 3,039,719; Uruguay 3,308,535 * 88% white = 2,911,511. Total white population in these countries: 191,543,213, i.e 33.07% of the region's population.
- ↑ 2.0 2.1 2.2 2.3 2.4 2.5 2.6 2.7 2.8 2.9 2.10 2.11 2.12 2.13 Lizcano Fernández, Francisco (May–August 2005). "Composición Étnica de las Tres Áreas Culturales del Continente Americano al Comienzo del Siglo XXI" (PDF). Convergencia (in Spanish) (Mexico: Universidad Autónoma del Estado de México, Centro de Investigación en Ciencias Sociales y Humanidades) 38: 185–232; table on p. 218. ISSN 1405-1435.
- ↑ 3.0 3.1 3.2 "Cor ou Raça" (PDF). Censo Demográfico 2010: Características gerais da população, religião e pessoas com deficiência. Instituto Brasileiro de Geografia e Estatística. 2010. Retrieved 5 October 2013.
- ↑ http://www.census.gov/prod/cen2010/briefs/c2010br-02.pdf
- ↑ 5.0 5.1 http://www.britannica.com/EBchecked/topic/379167/Mexico/27384/Ethnic-groups
- ↑ 6.0 6.1 6.2 "Colombia: A Country Study" (PDF). Federal Research Division of the Library of Congress. The Library of Congress of the United States of America. 2010. pp. 86–87.
- ↑ 7.0 7.1 7.2 "Resultado Básico del XIV Censo Nacional de Población y Vivienda 2011 (Mayo 2014)" (PDF). Ine.gov.ve. p. 29. Retrieved 8 September 2014.
- ↑ 8.0 8.1 8.2 http://www.ine.gob.ve/index.php?option=com_content&view=category&id=95&Itemid=26 Venezuelan population by 30/Jun/2014 is 30,206,2307 according National Institute of Stadistics
- ↑ 9.0 9.1 "TABLA II.3 POBLACION POR COLOR DE LA PIEL Y GRUPOS DE EDADES, SEGUN ZONA DE RESIDENCIA Y SEXO" (in Spanish). CubaGob.cu. Retrieved 2007-11-26.
- ↑ 10.0 10.1 10.2 "Peru: People; Ethnic groups". CIA World Factbook. Retrieved 2007-11-26.
- ↑ 11.0 11.1 "Uruguay: People and Society". CIA World Factbook. Retrieved 5 February 2014.
- ↑ "American Fact Finder". United States Census Bureau. 2010. Retrieved 25 Sep 2013.
- ↑ 13.0 13.1 13.2 "Caracterización estadística República de Guatemala 2012" (PDF). INE. Archived from the original on November 2012. Retrieved 2014-11-02.
- ↑ 14.0 14.1 14.2 "Bolivia: People; Ethnic groups". CIA World Factbook. Retrieved 2007-11-26.
- ↑ 15.0 15.1 15.2 "D.R.: People; Ethnic groups". CIA World Factbook. Retrieved 2007-11-26.
- ↑ 16.0 16.1 16.2 "Nicaragua: People; Ethnic groups". CIA World Factbook. Retrieved 2007-11-26.
- ↑ 17.0 17.1 "Resultados del Censo 2010". Instituto Nacional de Estadística y Censos. 2010. Retrieved 1 November 2013.
- ↑ 18.0 18.1 18.2 CIA World Factbook : Haiti.
- ↑ More precisely, these are the chief languages of Latin America, as per CIA – The World Factbook – Field Listing :: Languages, accessed 2010-02-24.
- ↑ The religious profile of the Latin American countries can be seen in CIA – The World Factbook – Field Listing :: Religions (accessed 2010-02-24). As such, it is not the religious profile of White Latin Americans in particular, but is a good indication of White religious affiliation in the region's White-majority countries, especially.
- ↑ Schaefer, Richard T. (ed.) (2008). Encyclopedia of Race, Ethnicity and Society. Sage. p. 900. ISBN 978-1-4129-2694-2.
In New Spain, there was no strict idea of race (something that continued in Mexico). The Indians that had lost their connections with their communities and had adopted different cultural elements could "pass" and be considered mestizos. The same applied to Blacks and castas. Rather, the factor that distinguished the various social groups was their calidad ("quality"); this concept was related to an idea of blood as conferring status, but there were also other elements, such as occupation and marriage, that could have the effect of blanqueamiento (whitening) on people and influence their upward social mobility.
- ↑ Chambers, Sarah C. (2003). "Little Middle Ground The Instability of a Mestizo Identity in the Andes, 18th and 19th centuries". In Nancy P. Appelbaum. Race and Nation in Modern Latin American. University of North Carolina Press.
This blending of culture and genealogy is also reflected in the use of the terms 'Spanish' and 'white'. For most of the colonial period, Americans of European descent were simply referred to as ‘‘Spaniards’’; beginning in the late 18th century, the term 'blanco' (white) came into increasing but not exclusive use. Even those of presumably mixed ancestry may have felt justified in claiming to be Spanish (and later white) if they participated in the dominant culture by, for example, speaking Spanish and wearing European clothing.(p. 33)
- ↑ Schaefer, Richard T. (ed.) (2008). Encyclopedia of Race, Ethnicity and Society. Sage. p. 1096. ISBN 978-1-4129-2694-2.
The variation of racial groupings between nations is at least partially explained by an unstable coupling between historical patterns of colonization and miscegenation. First, divergent patterns of colonization may account for differences in the construction of racial groupings, as evidenced in Latin America, which was colonized primarily by the Spanish. The Spanish colonials had a longer history of tolerance of non-White racial groupings through their interactions with the Moors and North African social groups, as well as a different understanding of the rights of colonized subjects and a different pattern of economic development.
- ↑ 24.0 24.1 South America: Postindependence overseas immigrants. Encyclopædia Britannica Retrieved 26-11-2007
- ↑ Schrover, Marlou. "Migration to Latin America". Retrieved 2010-02-24.
- ↑ CELADE (Organization). International migration and development in the Americas.
- ↑ http://redalyc.uaemex.mx/pdf/128/12891701.pdf
- ↑ Simon Schwartzman (2007), Etnia, condiciones de vida y discriminacion (PDF)
- ↑ Chambers, Sarah C. (2003). "Little Middle Ground The Instability of a Mestizo Identity in the Andes, 18th and 19th centuries". In Nancy P. Appelbaum. Race and Nation in Modern Latin American. University of North Carolina Press.
This blending of culture and genealogy is also reflected in the use of the terms ‘‘Spanish’’ and ‘‘white.’’ For most of the colonial period, Americans of European descent were simply referred to as ‘‘Spaniards’’; beginning in the late 18th century, the term ‘‘blanco’’ (white) came into increasing but not exclusive use. Even those of presumably mixed ancestry may have felt justified in claiming to be Spanish (and later white) if they participated in the dominant culture by, for example, speaking Spanish and wearing European clothing.(p. 33)
- ↑ Wade, Peter. 1997. Race and Ethnicity in Latin America. Critical Studies On Latin America. Pluto Press p. 15
- ↑ Levine-Rasky, Cynthia. 2002. "Working through whiteness: international perspectives. SUNY Press (p. 73) ""Money whitens" If any phrase encapsulates the association of whiteness and the modern in Latin America, this is it. It is a cliché formulated and reformulated throughout the region, a truism dependant upon the social experience that wealth is associated with whiteness, and that in obtaining the former one may become aligned with the latter (and vice versa)"."
- ↑ Instituto Brasileiro de Geografia e Estatística
- ↑ Do pensamento racial ao pensamento racional, laboratoriogene.com.br.
- ↑ Wade, Peter (2008). "Race in Latin America". In Poole, Deborah (ed.). Companion to Latin American Anthropology. Blackwell publishing. p. 182.
The nature of Latin American societies as mestizo – with the variations that run from Argentina, where the image of mixture is downplayed in favor of whiteness, to Brazil or Mexico, where mixture is foregrounded in discourse on the nation – has powerfully shaped ideas about race in the region.
- ↑ http://press.princeton.edu/chapters/s7846.html
- ↑ http://escholarship.org/uc/item/4222t703
- ↑ Wade, Peter (2008). "Race in Latin America". In Poole, Deborah (ed.). Companion to Latin American Anthropology. Blackwell publishing. p. 184.
However, "black" and "indigenous" are often vaguely defined and there is an indecisive, subjective distinction between them and "mixed" and between the latter and "white" (hence the problems of enumerating these populations).
- ↑ L’emigració dels europeus cap a Amèrica Consultado 26-11-2007.
- ↑ 39.0 39.1 Ideologia do Branqueamento - Racismo á Brasileira? por Andreas Haufbauer
- ↑ "Whiteness in Latin America: Measurement and Meaning in National Censuses (1850-1950)" by Mara Loveman. Journal de la Société des Américanistes. Vol. 95-2, 2009.
- ↑ 41.0 41.1 Argentina. by Arthur P. Whitaker. New Jersey: Prentice Hall Inc, 1984. Cited in Yale immigration study
- ↑ The Cry of My People. Out of Captivity in Latin America, escrita por Esther and Mortimer Arias. Editorial New York Friendship Press. 1980. Páginas 17 y 18.
- ↑ Landers, Jane (1999). Black society in Spanish Florida. University of Illinois Press. p. 29. ISBN 0-252-06753-3.
- ↑ "PNAD" (PDF) (in Portuguese). 2006. Retrieved 2007-09-14.
- ↑ "CIA – The World Factbook – Field Listing :: Ethnic groups". Retrieved 2010-02-24.
- ↑ "Argentina: People and Society". CIA World Factbook. Retrieved 5 February 2014.
- ↑ "Puerto Rico: People; Ethnic groups". 2010.census.gov. Retrieved 2011-04-14.
- ↑ http://www.schwartzman.org.br/simon/coesion_etnia.pdf
- ↑ "Encyclopedia Britannica: Mexico Ethnic groups".
- ↑ "CIA The World Factbook: People and Society - El Salavador".
- ↑ 51.0 51.1 Paraguay entry at The World Factbook
- ↑ "Informe Latinobarómetro 2011" (in Spanish). Latinobarómetro. 15 December 2011. p. 58. Retrieved 1 November 2013.
- ↑ Worldstatesmen.org: Costa Rica
- ↑ CIA The World Factbook: Costa Rica
- ↑ http://jcpa.org/dje/articles2/costarica.htm
- ↑ http://www.everyculture.com/Bo-Co/Costa-Rica.html
- ↑ www.digestyc.gob.sv Ethnic Groups -2007 official Census. Page 13.
- ↑ 58.0 58.1 58.2 58.3 58.4 58.5 58.6 Godinho, Neide Maria de Oliveira (2008). "O impacto das migrações na constituição genética de populações latino-americanas". Universidade de Brasília. Retrieved 29 October 2012.
- ↑ "Honduras; People; Ethnic groups". CIA World Factbook. Retrieved 2007-11-21.
- ↑ "Panama; People; Ethnic groups". CIA World Factbook. Retrieved 2007-11-21.
- ↑ "2012 Cuban Census". One.cu. 2006-04-28. Retrieved 2014-04-23.
- ↑ http://www.latercera.com/noticia/mundo/2013/11/678-550807-9-censo-en-cuba-concluye-que-la-poblacion-decrece-envejece-y-se-vuelve-cada-vez.shtml
- ↑ "Etat des propriétés rurales appartenant à des Français dans l'île de Cuba". (from Cuban Genealogy Center)
- ↑ "In Cuba, Finding a Tiny Corner of Jewish Life". The New York Times. 2007-02-04. Retrieved 2008-11-19.
- ↑ http://www.plosgenetics.org/article/info%3Adoi%2F10.1371%2Fjournal.pgen.1004488#pgen-1004488-g001
- ↑ "Origen de la población dominicana".
- ↑ "Revista Electrónica de Geografía y Ciencias Sociales". Universidad de Barcelona.
- ↑ "Sitios patrimonio de la humanidad: San Pedro de Macorís, República Dominicana".
- ↑ Sagás, Ernesto. "A Case of Mistaken Identity: Antihaitianismo in Dominican Culture". Retrieved 2007-12-08.
- ↑ Levy, Lauren. "The Dominican Republic's Haven for Jewish Refugees". Jerusalem Post. Retrieved 2007-12-08.
- ↑ "...no hicieron Las Américas". El País. Retrieved 2007-12-08.
- ↑ http://www.auswaertiges-amt.de/diplo/en/Laender/DominikanischeRepublik.html
- ↑ 73.0 73.1 "The Polish Influence in Casale, Haiti and Contribution to the Haitian Revolution". Retrieved 7 February 2014.
- ↑ "Polish Haitians: How They Came to Be". Retrieved 6 February 2014.
- ↑ "Haiti". Jewish Virtual Library. Retrieved 2014-02-07.
- ↑ "Haiti And The German Connection". Retrieved 30 January 2014.
- ↑ "Haiti Net Foreign Relations". Retrieved 30 January 2014.
- ↑ Martinique: People: Ethnic Groups. World Factbook of CIA
- ↑ 79.0 79.1 How Puerto Rico Became White—University of Wisconsin-Madison. (PDF).
- ↑ Representation of racial identity among puerto ricans and in the u.s. mainland. Mona.uwi.edu.
- ↑ CIA World Factbook Puerto Rico 2007. Retrieved 8 June 2009.
- ↑ 2010.census.gov
- ↑ Representation of racial identity among Puerto Ricans and in the u.s. mainland
- ↑ Fact Sheet on St. Barthélemy
- ↑ The World Factbook, CIA
- ↑ "Asociaciones de Inmigrantes Extranjeros en la Ciudad de México. Una Mirada a Fines del Siglo XX" (PDF).
- ↑ 87.0 87.1 "Los Extranjeros en México, La inmigración y el gobierno ¿Tolerancia o intolerancia religiosa?" (PDF).
- ↑ "Refugiados españoles en México".
- ↑ 89.0 89.1 Genetic structure of the populations migrating from San Luis Potosi and Zacatecas to Nuevo León in Mexico.
- ↑ "Composición Étnica de las Tres Áreas Culturales del Continente Americano al Comienzo del Siglo XXI" (PDF). Academic investigation (in Spanish). university of the State of Mexico. 2005. p. 196. Retrieved 2014-06-10.
- ↑ 92.0 92.1 http://www.ncbi.nlm.nih.gov/pubmed/25052264
- ↑ "Gene admixture in the Costa Rican population.". Ann. Hum. Genet. 67 (Pt 1): 71–80. 2013-03-25. doi:10.1046/j.1469-1809.2003.00010.x. PMID 12556237.
- ↑ 94.0 94.1 94.2 "Geographic Patterns of Genome Admixture in Latin American Mestizos". Plos genetics. 2008-03-21. Retrieved 2013-09-09.
- ↑ http://www.ncbi.nlm.nih.gov/pubmed/11891937
- ↑ 96.0 96.1 In the total population sample, paternal ancestry was predominately European (64.9%), followed by Native American (30.8%) and African (4.2%). However, the European ancestry was prevalent in the north and west (66.7–95%) and, conversely, Native American ancestry increased in the center and southeast (37–50%), whereas the African ancestry was low and relatively homogeneous (0–8.8%), Journal of Human Genetics.
- ↑ "Results of the study per state". nature.com.
- ↑ J.K. Estrada, A. Hidalgo-Miranda, I. Silva-Zolezzi and G. Jimenez-Sanchez. "Evaluation of Ancestry and Linkage Disequilibrium Sharing in Admixed Population in Mexico". ASHG. Retrieved July 18, 2012.
- ↑ "Genoma destapa diferencias de mexicanos". CNN Expansión. 2009-06-06. Retrieved 2013-09-09.
- ↑ "Racial admixture in a Mestizo population from Mexico City". Onlinelibrary.willey.com. 2005-05-27. Retrieved 2013-09-09.
- ↑ "Admixture in Mexico City: implications for admixture mapping of Type 2 diabetes genetic risk factors" (PDF). Utm.utoronto.ca. 2006-10-02. Retrieved 2013-09-09.
- ↑ Mexico, whose economic woes have pushed millions of people north, is increasingly becoming an immigrant destination.
- ↑ U.S. Census Bureau, Population Division, Social & Demographic Statistics. "U.S. Census Bureau Guidance on the Presentation and Comparison of Race and Hispanic Origin Data". U.S. Census Bureau. Retrieved 2008-03-29.
- ↑ "2000 Census of Population, Public Law 94-171 Redistricting Data File: Race". U.S. Census Bureau.
- ↑ "American FactFinder Help". Factfinder.census.gov. Retrieved 2010-07-29.
- ↑ "American FactFinder Help". Factfinder.census.gov. Retrieved 2010-07-29.
- ↑ "American Indian and Alaska Native persons, percent, 2000". Quickfacts.census.gov. Retrieved 2010-07-29.
- ↑ "Select Population Groups". 2009 American Community Survey 1-Year Estimates, Selected Population Profile. U.S. Census Bureau. Retrieved 2010-12-07.
- ↑ "American FactFinder Help; Spanish/Hispanic/Latino". U.S. Census Bureau. Retrieved 2008-12-29.
- ↑ "B03001. Hispanic or Latino Origin by Specific Origin". 2009 American Community Survey 1-Year Estimates. United States Census Bureau. Retrieved 2010-12-07.
- ↑ Overview of Race and Hispanic Origin: 2010. (PDF).
- ↑ "Inferring Continental Ancestry of Argentineans from Autosomal, Y-Chromosomal and Mitochondrial DNA - Corach - 2009 - Annals of Human Genetics - Wiley Online Library". Onlinelibrary.wiley.com. 2009-12-15. Retrieved 2013-09-06.
- ↑ http://www.plosone.org/article/info%3Adoi%2F10.1371%2Fjournal.pone.0034695
- ↑ Ethnic Groups Worldwide: A Ready Reference Handbook by David Levinson. Page 313. Greenwood Publishing Group, 1998. ISBN 1-57356-019-7
- ↑ World Fact File. Dorling Kindersley Books Limited, London. This source gives the following percentages: Indo-European 83%, Mestizos 14%, Jewish 2%, Amerindians 1%.
- ↑ World Statesmen.org: Argentina.
- ↑ "Indigenous or Criollo: The Myth of White Argentina in Tucumán's Calchaquí Valley", escrito por Oscar Chamosa. Paginas 77-79. Hispanic American Historical Review. Duke University Press. 2008
- ↑ Los hombres barbados en la América precolombina: razas indígenas americanas. Dick Edgar Ibarra Grasso. p. 10. Editorial Kier. Buenos Aires, 1997.
- ↑ Bolivians in Argentina (Spanish)
- ↑ Luis Vita: Introducción a una teoría de la historia para América Latina. Chapter IV. Editorial Planeta. Buenos Aires, 1992.
- ↑ Fuente: Argentina: de la Conquista a la Independencia. por C. S. Assadourian – C. Beato – J. C. Chiaramonte. Ed. Hyspamérica. Buenos Aires, 1986. Citado en Revisionistas. La Otra Historia de los Argentinos.
- ↑ Yale immigration study
- ↑ Federaciones Regionales.
- ↑ Construyendo Puentes
- ↑ Municipalidad de Crespo. Consultado 13-01-2010
- ↑ History of Argentina, de Ricardo.Levene. University of North Carolina Press, 1937.
- ↑ Argentina: 1516-1982 From Spanish Colonisation to the Falklands War escrito por David Rock. University of California Press, 1987. ISBN 0-520-05189-0
- ↑ Migration and Nationality Patterns in Argentina. Fuente: Dirección Nacional de Migraciones, 1976.
- ↑ Inmigración, Cambio Demográfico y Desarrollo Industrial en la Argentina. Alfredo Lattes y Ruth Sautu. Cuaderno Nº 5 del CENEP (1978). Citado en Argentina: 1516-1982 From Spanish Colonisation to the Falklands War by David Rock. University of California Press, 1987. ISBN 0-520-05189-0
- ↑ World Statesmen.org: Bolivia
- ↑ World Statesmen.org: Perú
- ↑ World Statesmen.org: Paraguay
- ↑ Recent Migration from Central and Eastern Europe to Argentina, a Special Treatment? (Spanish) by María José Marcogliese. Revista Argentina de Sociología, 2003
- ↑ "Ukrainians, Russians and Armenians, from professionals to security guardians" (Spanish) by Florencia Tateossian. Le Monde Diplomatique, June 2001.
- ↑ Girl from Ipanema fights for title
- ↑ Bellos, Alex (2006-06-17). "World Cup 2006: Privileged Kaka could be Brazil's best". The Guardian (London). Retrieved 2008-11-29.
- ↑ Solomon, Brian (14 June 2012). "The World's Highest Paid Models". Forbes.com (Forbes.com LLC). Retrieved 6 December 2014.
- ↑ "The World's Highest-Paid Models Of 2014: Gisele, Doutzen And Adriana Steal The Show". Forbes. 18 August 2014. Retrieved 28 August 2014.
- ↑ Brazil: People: Ethnic Groups.
- ↑ World Statesmen.org: Brazil
- ↑ 141.0 141.1 PNAD 2006
- ↑ IGBE: Pesquisa Nacional por Amostra de Domicilio. Tabela 262 - População residente, por cor ou raça.
- ↑ Duarte, Alessandra (29 April 2011). "Censo 2010: população do Brasil deixa de ser predominantemente branca". O Globo (in Portuguese) (Rio de Janeiro). Infoglobo Comunicação e Participações S.A. Archived from the original on 24 January 2014. Retrieved 24 January 2014.
(...) A população branca foi, assim, a única que diminuiu. Paula Miranda-Ribeiro, professora de demografia do Centro de Desenvolvimento e Planejamento Regional da UFMG, sublinha essa mudança cultural.
— «O Brasil está mais preto, algo mais próximo da realidade» — diz Paula, para quem a principal razão é a maior identificação de pretos e pardos com sua cor. — «É a chamada desejabilidade social. Historicamente, pretos e pardos eram desvalorizados socialmente, o que fazia com que pretos desejassem ser pardos, e pardos, brancos. Agora, pretos e pardos quiseram se identificar assim. Isso pode ter a ver, ainda, com a afirmação dessa população como forte consumidor atualmente, que se refletiu em afirmação de identidade.» (...) - ↑ Blacks in Brazil: the myth and the reality. by Charles Whitaker. Ebony Magazine, 1991.
- ↑ IBGE. PNAD 2009. População residente, por cor ou raça, situação e sexo
- ↑ Brasil 500 anos colonial
- ↑ The Phylogeography of Brazilian Y-Chromosome Lineages
- ↑ Século XVIII
- ↑ 149.0 149.1 Entrada de estrangeiros no Brasil
- ↑ Fim da escravidão gera medidas de apoio a imigração no Brasil – 16/02/2005 – Resumos | História do Brasil.
- ↑ Café atrai imigrante europeu para o Brasil – 22/02/2005 – Resumos | História do Brasil.
- ↑ 152.0 152.1 O papel da migração internacional na evolução da população brasileira (1872 a 1972)
- ↑ "Brazil - the Country and its People" (PDF). www.brazil.org.uk. Retrieved December 3, 2014.
- ↑ IBGE espanhóis
- ↑ A assimilação dos imigrantes como questão nacional
- ↑ Portuguese Immigration (History)
- ↑ Flight from Angola, The Economist, August 16, 1975
- ↑ Antônio Eugênio Taulois (February 2007). "History of Petrópolis" (in Portuguese). Retrieved 6 December 2014.
- ↑ http://www.plosone.org/article/fetchObject.action?uri=info%3Adoi%2F10.1371%2Fjournal.pone.0075145&representation=PDF
- ↑ 160.0 160.1 "The Genomic Ancestry of Individuals from Different Geographical Regions of Brazil Is More Uniform Than Expected". Plos One. Retrieved 2012-05-23.
- ↑ "Nossa herança europeia —" (in Portuguese). Cienciahoje.uol.com.br. Retrieved 2012-05-23.
- ↑ "Profile of the Brazilian blood donor". Amigodoador.com.br. Retrieved 2012-05-23.
- ↑ DNA de brasileiro é 80% europeu, indica estudo
- ↑ http://www.ncbi.nlm.nih.gov/pubmed/19639555 Genetic composition of Brazilian population samples based on a set of twenty-eight ancestry informative SNPs
- ↑ 165.0 165.1 http://onlinelibrary.wiley.com/doi/10.1002/ajhb.20976/pdf
- ↑ http://www.alvaro.com.br/pdf/trabalhoCientifico/ARTIGO_BRASIL_LILIAN.pdf
- ↑ Forensic Science International: Genetics. Allele frequencies of 15 STRs in a representative sample of the Brazilian population (inglés) basandos en estudios del IBGE de 2008. Se presentaron muestras de 12.886 individuos de distintas etnias, por regiones, provenían en un 8,26% del Norte, 23,86% del Nordeste, 4,79% del Centro-Oeste, 10,32% del Sudeste y 52,77% del Sur.
- ↑ http://bdtd.bce.unb.br/tedesimplificado/tde_busca/arquivo.php?codArquivo=3873
- ↑ http://onlinelibrary.wiley.com/doi/10.1002/ajhb.20474/abstract
- ↑ http://www.plosone.org/article/info:doi/10.1371/journal.pone.0075145#pone-0075145-g004
- ↑ http://www.scielo.br/scielo.php?pid=S0100-879X2009005000026&script=sci_arttext#Abstract
- ↑ 172.0 172.1 172.2 "Genetic epidemiology of single gene defects in Chile" (PDF). Ricardo Cruz-Coke and Rodrigo Moreno (in Spanish). Retrieved 12 Apr 2013.
- ↑ http://www.scielo.cl/pdf/rmc/v142n3/art01.pdf
- ↑ http://www.nature.com/ncomms/2015/150317/ncomms7472/abs/ncomms7472.html
- ↑ "5.2.6. Estructura racial". University of Chile (in Spanish). Retrieved 10 Feb 2013.
- ↑ "Chile". Encyclopædia Britannica. Retrieved 2012-09-15.
"Chile's ethnic makeup is largely a product of Spanish colonization. About three fourths of Chileans are mestizo, a mixture of European and Amerindian ancestries. One fifth of Chileans are of white European (mainly Spanish) descent".
- ↑ El Gradiente Sociogenético Chileno y sus Implicaciones Etico-Sociales (2014)
- ↑ http://www.lun.com/LunMobileIphone//Pages/NewsDetailMobile.aspx?dt=2013-11-23&BodyId=0&PaginaID=18&NewsID=246141&Name=I2&PagNum=0&Return=R&SupplementId=0&Anchor=20131123_18_0_I246141
- ↑ 179.0 179.1 179.2 179.3 "Sexual dimorphism in skin, eye and hair color and the presence of freckles in Chilean teenagers from two socioeconomic strata". Viviana Zemelman, Petra von Beck, Orlando Alvarado and Carlos y Valenzuela (in Spanish). Retrieved 12 Apr 2013.
- ↑ "Chile". Encyclopædia Britannica. Retrieved 2012-09-15.
"...Basque families who migrated to Chile in the 18th century vitalized the economy and joined the old Castilian aristocracy to become the political elite that still dominates the country".
- ↑ 181.0 181.1 De los Vascos, Oñati y los Elorza DE LOS VASCOS, OÑATI Y LOS ELORZA Waldo Ayarza Elorza. Page 68
- ↑ Diariovasco.
- ↑ entrevista al Presidente de la Cámara vasca.
- ↑ vascos Ainara Madariaga: Autora del estudio "Imaginarios vascos desde Chile La construcción de imaginarios vascos en Chile durante el siglo XX".
- ↑ Basques au Chili.
- ↑ Contacto Interlingüístico e intercultural en el mundo hispano.instituto valenciano de lenguas y culturas. Universitat de València Cita: " Un 20% de la población chilena tiene su origen en el País Vasco".
- ↑ (Spanish) La población chilena con ascendencia vasca bordea entre el 15% y el 20% del total, por lo que es uno de los países con mayor presencia de emigrantes venidos de Euskadi.
- ↑ De los Vascos, Oñati y los Elorza DE LOS VASCOS, OÑATI Y LOS ELORZA Waldo Ayarza Elorza.
- ↑ (Spanish) Presencia vasca en Chile.
- ↑ 190.0 190.1 190.2 190.3 De los Vascos, Oñati y los Elorza DE LOS VASCOS, OÑATI Y LOS ELORZA Waldo Ayarza Elorza. Page 59, 65, 66
- ↑ 191.0 191.1 191.2 191.3 191.4 Salazar Vergara, Gabriel; Pinto, Julio (1999). "La Presencia Inmigrante". Historia Contemporánea de Chile. Santiago de Chile: LOM Ediciones. pp. 76–81. ISBN 956-282-174-9. Retrieved September 16, 2012.
- ↑ Censo de Población 1907
- ↑ Censo de Población 1920
- ↑ Censo de Población 1930
- ↑ Durán, Hipólito (1997). "El crecimiento de la población latinoamericana y en especial de Chile • Academia Chilena de Medicina". Superpoblación. Madrid: Real Academia Nacional de Medicina. p. 217. ISBN 84-923901-0-7. Retrieved September 16, 2012.
- ↑ Pérez Rosales, Vicente (1860/1975). Recuerdos del Pasado. Santiago de Chile: Editorial Andrés Bello. Retrieved September 16, 2012. Check date values in:
|date=(help) - ↑ German Embassy in Chile.
- ↑
- ↑ (Spanish) Arabes de Chile.
- ↑ (Spanish) En Chile viven unas 700.000 personas de origen árabe y de ellas 500.000 son descendientes de emigrantes palestinos que llegaron a comienzos del siglo pasado y que constituyen la comunidad de ese origen más grande fuera del mundo árabe.
- ↑ Arab.
- ↑ Chile: Palestinian refugees arrive to warm welcome.
- ↑ (Spanish) 500,000 descendientes de primera y segunda generación de palestinos en Chile.
- ↑ (Spanish) Santiago de Chile es un modelo de convivencia palestino-judía.
- ↑ Exiling Palestinians to Chile.
- ↑ (Spanish) Chile tiene la comunidad palestina más grande fuera del mundo árabe, unos 500.000 descendientes.
- ↑ (Spanish) Diaspora Croata..
- ↑ Splitski osnovnoškolci rođeni u Čileu.
- ↑ hrvatski.
- ↑ "Historia de Chile, Británicos y Anglosajones en Chile durante el siglo XIX". Retrieved 2009-04-26.
- ↑ (Spanish) Embajada de Grecia en Chile.
- ↑ (Spanish) Griegos de Chile
- ↑ 90,000 descendants Swiss in Chile.
- ↑ (Spanish) 5% de los chilenos tiene origen frances
- ↑ "Italiani nel Mondo: diaspora italiana in cifre" (PDF) (in Italian). Migranti Torino. 30 April 2004. Retrieved 24 September 2012.
- ↑ "Juanes is a Colombian musician who has Basque descent" (in Spanish). centroestudiovascoantioquia. Retrieved 28 May 2013.
- ↑ http://education.stateuniversity.com/pages/281/Colombia-HISTORY-BACKGROUND.html
- ↑ Amerikanuak: Basques in the New World by William A. Douglass, Jon Bilbao, P.167
- ↑ Possible paradises: Basque emigration to Latin America by José Manuel Azcona Pastor, P.203
- ↑ Latin America during World War II by Thomas M. Leonard, John F. Bratzel, P.117
- ↑ http://www.stampnotes.com/Notes_from_the_Past/pastnote248.htm
- ↑ http://www.auswaertiges-amt.de/EN/Aussenpolitik/Laender/Laenderinfos/01-Nodes/Kolumbien_node.html
- ↑ 223.0 223.1 (Spanish) webislam.com: La comunidad musulmana de Maicao (Colombia) webislam.com
- ↑ (Spanish) Luis Angel Arango Library: Los sirio-libaneses en Colombia lablaa.org
- ↑ 2010 Ecuador Census
- ↑ Levinson, David. 1998. Ethnic groups worldwide: a ready reference handbook. Greenwood Publishing Group. p. 346. "Blanco or White is more a social-class designation than an ethnic one, as identification as a Blanco is based on a combination of white skin color, European features, speaking Spanish, residence in the western part of the nation (especially in a city), and enough wealth or education to be classified as middle or upper class. However, in some rural regions, Mestizos refer to themselves as Blancos, to distinguish themselves from Native Americans and Quechua speakers. Blancos form the ruling elite in Ecuador, and categorization as a Blanco is considered desirable by people of full or partial European descent.
- ↑ French Guiana: People: Ethnic Groups. World Factbook of CIA
- ↑ Paraguayan Census form
- ↑ II CENSO NACIONAL INDÍGENA DE POBLACIÓN Y VIVIENDAS 2002. Pueblos Indígenas del Paraguay. Resultados Finales
- ↑ "Paraguay: People; Ethnic groups". CIA World Factbook. Retrieved 2007-11-26.
- ↑ 231.0 231.1 231.2 Benítez Martínez, María Victoria. "Inmigrantes Europeos en Paraguay 1818 1930" (PDF). XIV Encuentro de Latinoamericanistas Españoles (in Spanish). Paris, France: Université de Paris. Retrieved 24 January 2014.
- ↑ "Establecerán nueva colonia de alemanes en Paraguay". ABC (in Spanish). 26 August 2005. Retrieved 24 January 2014.
- ↑ The Socioeconomic Advantages of Mestizos in Urban Peru. princeton.edu. pp. 4-5.
- ↑ http://www3.interscience.wiley.com/journal/108068634/abstract/
- ↑ "El Nacimiento del Uruguay Moderno en la segunda mitad del siglo XIX" (Spanish)
- ↑ "Encuesta Contínua de Hogares 1996-1997". Instituto Nacional de Estadística de Uruguay (Spanish)
- ↑ "Perfil Demográfico y Socioeconómico de la Población Uruguaya según su Ascendencia Racial" por Marisa Bucheli y Wanda Cabela. Fuente: Encuesta Nacional de Hogares Ampliada 2006. INE (Spanish)
- ↑ World Statesmen.org: Uruguay.
- ↑ Uruguay: People: Ethnic Groups
- ↑ World Reference Desk: Uruguay
- ↑ Inmigración norteamericana y europea en Uruguay. (Spanish)
- ↑ Godinho, Neide Maria de Oliveira (2008). "O impacto das migrações na constituição genética de populações latino-americanas". Universidade de Brasília. Retrieved 1 August 2012.
- ↑
- ↑ Quinonez, Ernesto (2003-06-19). "Y Tu Black Mama Tambien". Retrieved 2008-05-02.
- ↑ The Blond, Blue-Eyed Face of Spanish TV
- ↑ Blonde, Blue-Eyed Euro-Cute Latinos on Spanish TV
- ↑ What are Telenovelas? – Hispanic Culture
- ↑ Racial Bias Charged On Spanish-Language TV
- ↑ Black Electorate
- ↑ Differences Between American and Castilian Spanish
- ↑ POV - Corpus Film Description
| ||||||||||||||||||||||||||||||