Welch's t-test
In statistics, Welch's t-test (or unequal variances t-test) is a two-sample location test, and is used to test the hypothesis that two populations have equal means. Welch's t-test is an adaptation of Student's t-test,[1] and is more reliable when the two samples have unequal variances and unequal sample sizes.[2] These tests are often referred to as "unpaired" or "independent samples" t-tests, as they are typically applied when the statistical units underlying the two samples being compared are non-overlapping. Given that Welch's t-test has been less popular than Student's t-test[2] and may be less familiar to readers, a more informative name is "Welch's unequal variances t-test" or "unequal variances t-test" for brevity.
Assumptions
Student's t-test assumes that the two populations have normal distributions and with equal variances. Welch's t-test is designed for unequal variances, but the assumption of normality is maintained.[1] Welch's t-test is an approximate solution to the Behrens-Fisher problem.
Calculations
Welch's t-test defines the statistic t by the following formula:
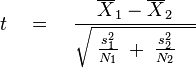
where  ,
,  and
and  are the
  st sample mean, sample variance and sample size, respectively. Unlike in Student's t-test, the denominator is not based on a pooled variance estimate.
The degrees of freedom  associated with this variance estimate is approximated using the Welch–Satterthwaite equation:
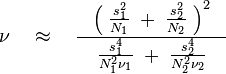
Here  =
=  , the degrees of freedom associated with the st variance estimate.
Welch's t-test can also be calculated for ranked data and might then be named Welch's U-test.[3]
Statistical test
Once t and have been computed, these statistics can be used with the t-distribution to test the null hypothesis that the two population means are equal (using a two-tailed test), or the alternative hypothesis that one of the population means is greater than or equal to the other (using a one-tailed test). The approximate degrees of freedom is rounded down to the nearest integer.
Advantages and limitations
Welch's t-test is more robust than Student's t-test and maintains type I error rates close to nominal for unequal variances and for unequal sample sizes. Furthermore, the power of Welch's t-test comes close to that of Student’s t-test, even when the population variances are equal and sample sizes are balanced.[2]
It is not recommended to pre-test for equal variances and then choose between Student's t-test or Welch's t-test.[4] Rather, Welch's t-test can be applied directly and without any substantial disadvantages to Student's t-test as noted above. Welch's t-test remains robust for skewed distributions and large sample sizes.[5] Reliability decreases for skewed distributions and smaller samples, where one could possibly perform Welch’s t-test on ranked data.[3]
Examples
The following three examples compare Welch's t-test and Student's t-test. Samples are from random normal distributions using the R programming language.
For all three examples, the population means were  = 20 and
  = 22.
= 22.
The first example is for equal variances ( =
=  = 4) and equal sample sizes ( =
  = 15). Let A1 and A2 denote two random samples:


The second example is for unequal variances ( = 16, = 1) and unequal sample sizes ( = 10, = 20). The smaller sample has the larger variance:


The third example is for unequal variances ( = 1, = 16) and unequal sample sizes ( = 10, = 20). The larger sample has the larger variance:


Reference P-values were obtained by simulating the distributions of the t statistics for the null hypothesis of equal population means ( = 0). Results are summarised in the table below, with two-tailed P-values:
| Sample A1 | Sample A2 | Student's t-test | Welch's t-test | |||||||||||
| Example | | | | |  |  |  | |  |  | | | | |
| 1 | 15 | 20.8 | 7.9 | 15 | 23.0 | 3.8 | -2.46 | 28 | 0.021 | 0.021 | -2.46 | 25.0 | 0.021 | 0.017 |
| 2 | 10 | 20.6 | 9.0 | 20 | 22.1 | 0.9 | -2.10 | 28 | 0.045 | 0.150 | -1.57 | 9.9 | 0.149 | 0.144 |
| 3 | 10 | 19.4 | 1.4 | 20 | 21.6 | 17.1 | -1.64 | 28 | 0.110 | 0.036 | -2.22 | 24.5 | 0.036 | 0.042 |
Welch's t-test and Student's t-test gave practically identical results for the two samples with equal variances and equal sample sizes (Example 1). For unequal variances, Student's t-test gave a low P-value when the smaller sample had a larger variance (Example 2) and a high P-value when the larger sample had a larger variance (Example 3). For unequal variances, Welch's t-test gave P-values close to simulated P-values.
Software implementations
| Language/Program | Function | Notes |
|---|---|---|
| LibreOffice | TTEST(Data1; Data2; Mode; Type) | See |
| MATLAB | ttest2(data1, data2) | See |
| Microsoft Excel pre 2010 | TTEST(array1, array2, tails, type) | See |
| Microsoft Excel 2010 and later | T.TEST(array1, array2, tails, type) | See |
| Python | scipy.stats.ttest_ind(a, b, axis=0, equal_var=False) | See |
| R | t.test(data1, data2, alternative="two.sided", var.equal=FALSE) | See |
See also
References
- ↑ 1.0 1.1 Welch, B. L. (1947). "The generalization of "Student's" problem when several different population variances are involved". Biometrika 34 (1–2): 28–35. doi:10.1093/biomet/34.1-2.28. MR 19277.
- ↑ 2.0 2.1 2.2 Ruxton, G. D. (2006). "The unequal variance t-test is an underused alternative to Student's t-test and the Mann–Whitney U test". Behavioral Ecology 17: 688–690. doi:10.1093/beheco/ark016.
- ↑ 3.0 3.1 Fagerland, M. W.; Sandvik, L. (2009). "Performance of five two-sample location tests for skewed distributions with unequal variances". Contemporary Clinical Trials 30: 490–496. doi:10.1016/j.cct.2009.06.007.
- ↑ Zimmerman, D. W. (2004). "A note on preliminary tests of equality of variances". British Journal of Mathematical and Statistical Psychology 57: 173–181. doi:10.1348/000711004849222.
- ↑ Fagerland, M. W. (2012). "t-tests, non-parametric tests, and large studies—a paradox of statistical practice?". BioMed Central Medical Research Methodology 12: 78. doi:10.1186/1471-2288-12-78.