Warley (UK Parliament constituency)
| Warley | |
|---|---|
|
Borough constituency for the House of Commons | |
|
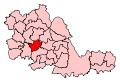
Boundary of Warley in West Midlands. | |
|
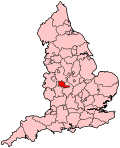
Location of West Midlands within England. | |
| County | West Midlands |
| Electorate | 63,024 (December 2010)[1] |
| Major settlements | Smethwick, Brandhall, Langley Green |
| Current constituency | |
| Created | 1997 |
| Member of parliament | John Spellar (Labour) |
| Number of members | One |
| Created from | Warley East, Warley West |
| Overlaps | |
| European Parliament constituency | West Midlands |
Warley is a constituency[n 1] in the House of Commons of the UK Parliament. The constituency was established in 1997, and has been represented since that date by John Spellar, a member of the Labour Party.[n 2]
Boundaries
Warley is one of four constituencies covering the Metropolitan Borough of Sandwell, covering the south and south-east of the borough. It covers much of the former County Borough of Warley, namely the towns of Oldbury and Smethwick as well as Brandhall and Langley Green.
There are seven wards in the seat: Abbey, Bristnall, Langley, Old Warley, St Paul's, Smethwick, and Soho & Victoria.[2]
History
The constituency was formed in 1997, and is for the most part the former Warley East constituency. John Spellar of the Labour Party has represented Warley since 1997, having previously represented Warley West. Both Warley East and Warley West had been held by Labour since their creation in 1974. All four elections have so far seen the Labour share of the vote exceed 50%, presenting a safe seat.
Constituency profile
The constituency has a wide range of housing on the gently hilly West Midlands terrain, with fast transport links to Birmingham, Dudley and Wolverhampton. Workless claimants, registered jobseekers, were in November 2012 significantly higher than the national average of 3.8%, at 7.7% of the population based on a statistical compilation by The Guardian however female unemployment, reflecting a central West Midlands pattern, perhaps with more women homemakers, unusually exceeded male unemployment at 10.1%.[3]
Members of Parliament
| Election | Member[4] | Party | |
|---|---|---|---|
| 1997 | John Spellar | Labour | |
Elections
Elections in the 2010s
| General Election 2015: Warley [5] | |||||
|---|---|---|---|---|---|
| Party | Candidate | Votes | % | ±% | |
| Conservative | Tom Williams | ||||
| Green | Robert Buckman | ||||
| Labour | John Spellar | ||||
| UKIP | Pete Durnell | ||||
| Liberal Democrat | Catherine Smith | ||||
| General Election 2010: Warley[6] | |||||
|---|---|---|---|---|---|
| Party | Candidate | Votes | % | ±% | |
| Labour | John Spellar | 20,240 | 52.9 | -2.0 | |
| Conservative | Jas Parmer | 9,484 | 24.8 | +1.9 | |
| Liberal Democrat | Edward Keating[7] | 5,929 | 15.5 | +2.3 | |
| UKIP | Nigel Harvey | 2,617 | 6.8 | +4.7 | |
| Majority | 10,756 | 28.1 | |||
| Turnout | 38,270 | 60.6 | +3.4 | ||
| Labour hold | Swing | -1.9 | |||
Elections in the 2000s
| General Election 2005: Warley | |||||
|---|---|---|---|---|---|
| Party | Candidate | Votes | % | ±% | |
| Labour | John Spellar | 17,462 | 54.4 | −6.1 | |
| Conservative | Karen Bissell | 7,315 | 22.8 | 0.0 | |
| Liberal Democrat | Tony Ferguson | 4,277 | 13.3 | +2.7 | |
| BNP | Simon Smith | 1,761 | 5.5 | N/A | |
| Socialist Labour | Malcolm Connigale | 637 | 2.0 | −4.2 | |
| UKIP | David Matthews | 635 | 2.0 | N/A | |
| Majority | 10,147 | 31.6 | |||
| Turnout | 32,087 | 57.1 | +3.0 | ||
| Labour hold | Swing | −3.0 | |||
| General Election 2001: Warley | |||||
|---|---|---|---|---|---|
| Party | Candidate | Votes | % | ±% | |
| Labour | John Spellar | 19,007 | 60.5 | -3.3 | |
| Conservative | Mark Pritchard | 7,157 | 22.8 | -1.3 | |
| Liberal Democrat | Ron Cockings | 3,315 | 10.6 | +0.8 | |
| Socialist Labour | Harbhajan Dardi | 1,936 | 6.2 | N/A | |
| Majority | 11,850 | 37.7 | |||
| Turnout | 31,415 | 54.1 | -10.9 | ||
| Labour hold | Swing | ||||
Elections in the 1990s
| General Election 1997: Warley | |||||
|---|---|---|---|---|---|
| Party | Candidate | Votes | % | ±% | |
| Labour | John Spellar | 24,813 | 63.8 | N/A | |
| Conservative | Christopher Pincher | 9,362 | 24.1 | N/A | |
| Liberal Democrat | Jeremy Pursehouse | 3,777 | 9.7 | N/A | |
| Referendum Party | K. Gamre | 941 | 2.4 | N/A | |
| Majority | 15,451 | N/A | |||
| Turnout | 65.1 | N/A | |||
| Labour hold | Swing | N/A | |||
See also
Notes and references
- Notes
- References
- ↑ "Electorate Figures - Boundary Commission for England". 2011 Electorate Figures. Boundary Commission for England. 4 March 2011. Retrieved 13 March 2011.
- ↑ 2010 post-revision map Greater London and metropolitan areas of England
- ↑ Unemployment claimants by constituency The Guardian
- ↑ Leigh Rayment's Historical List of MPs – Constituencies beginning with "W" (part 1)
- ↑ http://ukpollingreport.co.uk/2015guide/warley/
- ↑ Warley, UKPollingReport
- ↑ http://www.libdems.org.uk/people_detail.aspx?name=Edward_Keating&pPK=ccb5560a-22a3-4102-82ad-f4938901de91