Walsall Metropolitan Borough Council election, 2011
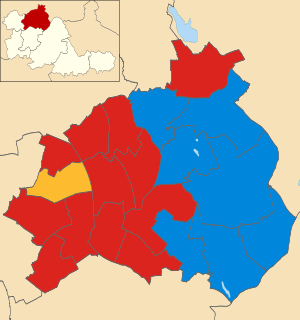
Map of the results of the 2011 Walsall council election.
Labour in red,
Conservatives in blue and Liberal Democrats in yellow.
The 2011 Walsall Metropolitan Borough Council election took place on 5 May 2011 to elect members of Walsall Metropolitan Borough Council in the West Midlands, England. One third of the council was up for election and the Conservative party lost overall control of the council to no overall control.[1]
After the election, the composition of the council was
Background
The council leader Mike Bird was one of the Conservatives who were defending seats at the election, along with a member of his cabinet Barbara McCracken.[3]
Election result
The results saw the Conservatives lose their majority on the council after Labour gained 8 seats, including 5 from the Conservatives.[4] This meant the Conservatives had 28 councillors compared to 26 for Labour, leaving the Liberal Democrats, down one on five seats, holding the balance.[4]
Following the election the Conservatives continued to run the council as a minority administration.[5]
| Walsall Local Election Result 2011[1][6] |
| Party |
Seats |
Gains |
Losses |
Net gain/loss |
Seats % |
Votes % |
Votes |
+/− |
| |
Labour |
12 |
8 |
0 |
+8 |
57.1 |
40.6 |
31,104 |
+9.3% |
| |
Conservative |
8 |
0 |
5 |
-5 |
38.1 |
40.0 |
30,592 |
+0.5% |
| |
Liberal Democrat |
1 |
0 |
1 |
-1 |
4.8 |
7.1 |
5,430 |
-9.0% |
| |
UKIP |
0 |
0 |
0 |
0 |
0 |
5.8 |
4,467 |
+0.3% |
| |
Independent |
0 |
0 |
1 |
-1 |
0 |
3.1 |
2,372 |
-0.3% |
| |
Democratic Labour |
0 |
0 |
1 |
-1 |
0 |
2.3 |
1,785 |
+0.9% |
| |
BNP |
0 |
0 |
0 |
0 |
0 |
0.4 |
307 |
-0.7% |
| |
Green |
0 |
0 |
0 |
0 |
0 |
0.3 |
255 |
-1.1% |
| |
English Democrats |
0 |
0 |
0 |
0 |
0 |
0.3 |
210 |
+0.3% |
Ward results
| Aldridge North and Walsall Wood[6][7] |
| Party |
Candidate |
Votes |
% |
±% |
|
Conservative |
Mike Flower |
2,167 |
56.5 |
+2.8 |
|
Labour |
Bob Grainger |
1,094 |
28.5 |
+6.5 |
|
BNP |
Terence Majorwicz |
307 |
8.0 |
+8.0 |
|
Liberal Democrat |
Mark Greveson |
267 |
7.0 |
-13.4 |
| Majority |
1,073 |
28.0 |
-3.7 |
| Turnout |
3,835 |
38.3 |
-26.3 |
|
Conservative hold |
Swing |
|
|
| Darlaston South[6][7] |
| Party |
Candidate |
Votes |
% |
±% |
|
Labour |
Douglas James |
1,205 |
41.5 |
+7.1 |
|
Independent |
Chris Bott |
1,112 |
38.3 |
+2.3 |
|
Conservative |
Michelle Martin |
334 |
11.5 |
-8.3 |
|
Independent |
Ashley Lovell |
138 |
4.8 |
+4.8 |
|
Green |
Tim Martin |
114 |
3.9 |
+3.9 |
| Majority |
93 |
3.2 |
|
| Turnout |
2,903 |
31.2 |
-22.3 |
|
Labour gain from Independent |
Swing |
|
|
| Paddock[6][7] |
| Party |
Candidate |
Votes |
% |
±% |
|
Conservative |
Barbara McCracken |
2,124 |
41.8 |
-1.1 |
|
Labour |
Nasar Ali |
1,795 |
35.3 |
+7.5 |
|
Independent |
Barry Sanders |
570 |
11.2 |
+2.0 |
|
UKIP |
Derek Bennett |
471 |
9.3 |
-0.1 |
|
Liberal Democrat |
Abdul Malik |
119 |
2.3 |
-8.4 |
| Majority |
329 |
6.5 |
-8.5 |
| Turnout |
5,079 |
52.8 |
-18.6 |
|
Conservative hold |
Swing |
|
|
| Pheasey Park Farm[6][7] |
| Party |
Candidate |
Votes |
% |
±% |
|
Conservative |
Mike Bird |
1,782 |
48.3 |
-1.8 |
|
Labour |
Jack Kelly |
1,161 |
31.5 |
+6.2 |
|
UKIP |
Steven Grey |
429 |
11.6 |
-1.6 |
|
English Democrats |
Christopher Newey |
210 |
5.7 |
+5.7 |
|
Liberal Democrat |
Anne Willoughby |
104 |
2.8 |
-8.6 |
| Majority |
621 |
16.8 |
-7.9 |
| Turnout |
3,686 |
42.4 |
-26.2 |
|
Conservative hold |
Swing |
|
|
| Rushall-Shelfield[6][7] |
| Party |
Candidate |
Votes |
% |
±% |
|
Conservative |
Lorna Rattigan |
1,337 |
42.2 |
-1.6 |
|
Labour |
Richard Worrall |
1,309 |
41.3 |
+14.3 |
|
UKIP |
Timothy Melville |
273 |
8.6 |
+0.4 |
|
Liberal Democrat |
Roy Smitb |
159 |
5.0 |
-12.8 |
|
Green |
Mike Walters |
92 |
2.9 |
-0.3 |
| Majority |
28 |
0.9 |
-15.9 |
| Turnout |
3,170 |
35.5 |
-24.8 |
|
Conservative hold |
Swing |
|
|
| Short Heath[6][7] |
| Party |
Candidate |
Votes |
% |
±% |
|
Liberal Democrat |
Daniel Barker |
924 |
31.3 |
-6.9 |
|
Labour |
Doug Cleaver |
813 |
27.5 |
+5.2 |
|
Conservative |
Theresa Smith |
805 |
27.2 |
-1.5 |
|
UKIP |
Darren Hazell |
287 |
9.7 |
-1.0 |
|
Independent |
Malcolm Moore |
77 |
2.6 |
+2.6 |
|
Green |
Leandra Gebrakedan |
49 |
1.7 |
+1.7 |
| Majority |
111 |
3.8 |
-5.7 |
| Turnout |
2,955 |
32.9 |
-26.4 |
|
Liberal Democrat hold |
Swing |
|
|
| Streetly[6][7] |
| Party |
Candidate |
Votes |
% |
±% |
|
Conservative |
Gary Clarke |
2,897 |
60.6 |
+0.4 |
|
Labour |
Steven King |
1,200 |
25.1 |
+7.3 |
|
UKIP |
Paul Valdmanis |
391 |
8.2 |
+1.3 |
|
Liberal Democrat |
John Garfitt |
294 |
6.1 |
-7.7 |
| Majority |
1,697 |
35.5 |
-6.9 |
| Turnout |
4,782 |
44.3 |
-26.9 |
|
Conservative hold |
Swing |
|
|
| Willenhall North[6][7] |
| Party |
Candidate |
Votes |
% |
±% |
|
Labour |
Gareth Illmann-Walker |
1,012 |
30.9 |
+8.9 |
|
Liberal Democrat |
Peter Hughes |
943 |
28.8 |
-4.1 |
|
Conservative |
Abi Pitt |
875 |
26.8 |
-2.0 |
|
UKIP |
Liz Hazell |
440 |
13.5 |
+7.1 |
| Majority |
69 |
2.1 |
|
| Turnout |
3,270 |
34.6 |
-27.1 |
|
Labour gain from Liberal Democrat |
Swing |
|
|
| Willenhall South[6][7] |
| Party |
Candidate |
Votes |
% |
±% |
|
Labour |
Carl Creaney |
1,999 |
63.1 |
+18.0 |
|
Conservative |
Clive Rudd |
926 |
29.2 |
-0.1 |
|
Liberal Democrat |
Uppal Singh |
242 |
7.6 |
-15.3 |
| Majority |
1,073 |
33.9 |
+18.1 |
| Turnout |
3,167 |
29.7 |
-24.6 |
|
Labour hold |
Swing |
|
|
References
|
|---|
| | Metropolitan boroughs |
- Barnsley
- Birmingham
- Bolton
- Bradford
- Bury
- Calderdale
- Coventry
- Doncaster
- Dudley
- Gateshead
- Kirklees
- Knowsley
- Leeds
- Liverpool
- Manchester
- Newcastle upon Tyne
- North Tyneside
- Oldham
- Rochdale
- Rotherham
- Salford
- Sandwell
- Sefton
- Sheffield
- Solihull
- South Tyneside
- St Helens
- Stockport
- Sunderland
- Tameside
- Trafford
- Wakefield
- Walsall
- Wigan
- Wirral
- Wolverhampton
|
|---|
| | Unitary authorities | |
|---|
| | District councils (England) | |
|---|
| | District councils (Northern Ireland) |
- Antrim
- Ards
- Armagh
- Ballymena
- Ballymoney
- Banbridge
- Belfast
- Carrickfergus
- Castlereagh
- Coleraine
- Cookstown
- Craigavon
- Derry
- Down
- Dungannon and South Tyrone
- Fermanagh
- Larne
- Limavady
- Lisburn
- Magherafelt
- Moyle
- Newry and Mourne
- Newtownabbey
- North Down
- Omagh
- Strabane
|
|---|
| | Mayoral elections | |
|---|
| | National Assembly elections | |
|---|
| | Referendums | |
|---|
|