Walsall Metropolitan Borough Council election, 2010
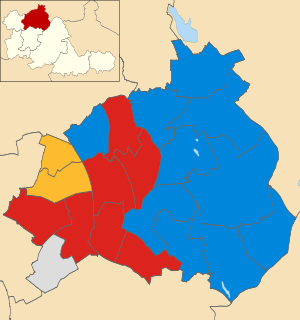
Map of the results of the 2010 Walsall council election.
Conservatives in blue,
Labour in red, Liberal Democrats in yellow and independent in grey.
The 2010 Walsall Metropolitan Borough Council election took place on 6 May 2010 to elect members of Walsall Metropolitan Borough Council in the West Midlands, England. One third of the council was up for election and the Conservative party stayed in overall control of the council.[1]
After the election, the composition of the council was
Election result
The results saw the Conservative remain in control of the council, with no change in their majority.[3] Labour gained Birchills-Leamore from the Conservatives, but also lost St Matthews back to the Conservatives.[3]
One seat was vacant in Bloxwich West after the election, as the former Conservative mayor of Walsall Melvin Pitt, whose seat had not been up for election, died on election night.[4]
| Walsall Local Election Result 2010[2][5] |
| Party |
Seats |
Gains |
Losses |
Net gain/loss |
Seats % |
Votes % |
Votes |
+/− |
| |
Conservative |
10 |
1 |
1 |
0 |
50.0 |
39.5 |
45,500 |
-12.0% |
| |
Labour |
7 |
1 |
1 |
0 |
35.0 |
31.3 |
35,996 |
+6.5% |
| |
Liberal Democrat |
2 |
0 |
0 |
0 |
10.0 |
16.1 |
18,576 |
+3.9% |
| |
Independent |
1 |
0 |
0 |
0 |
5.0 |
3.4 |
3,910 |
+3.0% |
| |
UKIP |
0 |
0 |
0 |
0 |
0 |
5.5 |
6,293 |
+0.8% |
| |
Green |
0 |
0 |
0 |
0 |
0 |
1.4 |
1,560 |
-0.3% |
| |
Democratic Labour |
0 |
0 |
0 |
0 |
0 |
1.4 |
1,557 |
-2.1% |
| |
BNP |
0 |
0 |
0 |
0 |
0 |
1.1 |
1,289 |
+0.3% |
| |
Pelsall Independent Alliance |
0 |
0 |
0 |
0 |
0 |
0.4 |
413 |
+0.4% |
Ward results
| Aldridge Central and South[5] |
| Party |
Candidate |
Votes |
% |
±% |
|
Conservative |
John O'Hare |
3,827 |
51.8 |
-11.6 |
|
Liberal Democrat |
Roy Sheward |
1,446 |
19.6 |
+9.1 |
|
Labour |
Sandy Bradie |
1,324 |
17.9 |
+4.0 |
|
UKIP |
Malcolm Ford |
629 |
8.5 |
-3.7 |
|
Green |
Mike Walters |
155 |
2.1 |
+2.1 |
| Majority |
2,381 |
32.3 |
-17.2 |
| Turnout |
7,381 |
68.5 |
+34.9 |
|
Conservative hold |
Swing |
|
|
| Aldridge North and Walsall Wood[5] |
| Party |
Candidate |
Votes |
% |
±% |
|
Conservative |
Anthony Harris |
3,474 |
53.7 |
-17.1 |
|
Labour |
Harry Bradie |
1,423 |
22.0 |
+8.9 |
|
Liberal Democrat |
Mark Greveson |
1,318 |
20.4 |
+4.3 |
|
Green |
Helen Rust |
250 |
3.9 |
+3.9 |
| Majority |
2,051 |
31.7 |
-23.1 |
| Turnout |
6,465 |
64.6 |
+36.6 |
|
Conservative hold |
Swing |
|
|
| Bentley and Darlaston North[5] |
| Party |
Candidate |
Votes |
% |
±% |
|
Labour |
Rose Burley |
2,120 |
42.8 |
-1.1 |
|
Conservative |
Gurmeet Sohal |
1,487 |
30.0 |
-9.3 |
|
Liberal Democrat |
Trudy Pearce |
713 |
14.4 |
+9.6 |
|
UKIP |
Anne Ford |
590 |
11.9 |
+3.9 |
|
Democratic Labour |
Alan Paddock |
44 |
0.9 |
+0.1 |
| Majority |
633 |
12.8 |
+8.2 |
| Turnout |
4,954 |
55.6 |
+27.8 |
|
Labour hold |
Swing |
|
|
| Bloxwich East[5] |
| Party |
Candidate |
Votes |
% |
±% |
|
Labour |
Kath Phillips |
1,886 |
41.2 |
+15.8 |
|
Conservative |
Clive Ault |
1,638 |
35.8 |
-23.1 |
|
UKIP |
Alan Sheath |
467 |
10.2 |
+10.2 |
|
Liberal Democrat |
Christopher Pearce |
417 |
9.1 |
+0.2 |
|
Democratic Labour |
Stephen Baggott |
173 |
3.8 |
-3.0 |
| Majority |
248 |
5.4 |
|
| Turnout |
4,581 |
54.2 |
+28.2 |
|
Labour hold |
Swing |
|
|
| Bloxwich West[5] |
| Party |
Candidate |
Votes |
% |
±% |
|
Conservative |
Louise Harrison |
2,329 |
40.7 |
-13.4 |
|
Labour |
Fred Westley |
2,008 |
35.1 |
+17.6 |
|
BNP |
Chris Woodall |
722 |
12.6 |
+12.6 |
|
Liberal Democrat |
Roy Robinson |
563 |
9.8 |
+6.0 |
|
Green |
Zoe Henderson |
97 |
1.7 |
+1.7 |
| Majority |
321 |
5.6 |
-31.0 |
| Turnout |
5,719 |
59.4 |
+31.9 |
|
Conservative hold |
Swing |
|
|
| Darlaston South[5] |
| Party |
Candidate |
Votes |
% |
±% |
|
Independent |
Paul Bott |
1,761 |
36.0 |
+36.0 |
|
Labour |
Ann Wilson |
1,684 |
34.4 |
-2.4 |
|
Conservative |
Jaqueline Perrins |
968 |
19.8 |
-13.9 |
|
Liberal Democrat |
Ramtirth Singh |
477 |
9.8 |
+4.8 |
| Majority |
77 |
1.6 |
|
| Turnout |
4,890 |
53.5 |
+30.4 |
|
Independent hold |
Swing |
|
|
| Paddock[5] |
| Party |
Candidate |
Votes |
% |
±% |
|
Conservative |
Zahid Ali |
2,933 |
42.9 |
-12.8 |
|
Labour |
Walter Burley |
1,905 |
27.8 |
+10.1 |
|
Liberal Democrat |
Abdul Malik |
733 |
10.7 |
+6.8 |
|
UKIP |
Derek Bennett |
643 |
9.4 |
+0.3 |
|
Independent |
John Wood |
630 |
9.2 |
+9.2 |
| Majority |
1,028 |
15.0 |
-33.1 |
| Turnout |
6,844 |
71.4 |
+35.8 |
|
Conservative hold |
Swing |
|
|
| Palfrey[5] |
| Party |
Candidate |
Votes |
% |
±% |
|
Labour |
Mohammad Nazir |
3,278 |
50.2 |
+10.4 |
|
Conservative |
Mohammed Khan |
2,017 |
30.9 |
-12.3 |
|
Liberal Democrat |
Richard Cullum |
1,235 |
18.9 |
+9.5 |
| Majority |
1,261 |
19.3 |
|
| Turnout |
6,530 |
64.1 |
+25.0 |
|
Labour hold |
Swing |
|
|
| Pelsall[5] |
| Party |
Candidate |
Votes |
% |
±% |
|
Conservative |
Oliver Bennett |
2,750 |
45.9 |
-33.1 |
|
Independent |
Sim Mayou |
1,171 |
19.5 |
+19.5 |
|
Labour |
Paul Forrest |
1,107 |
18.5 |
+9.9 |
|
Pelsall Independent Alliance |
Philip Evans |
413 |
6.9 |
+6.9 |
|
UKIP |
Dorothy Sheath |
363 |
6.1 |
+6.1 |
|
Green |
Alison Walters |
123 |
2.1 |
+2.1 |
|
Democratic Labour |
Derek Roddy |
69 |
1.2 |
-0.9 |
| Majority |
1,579 |
26.3 |
-42.4 |
| Turnout |
5,996 |
66.9 |
+31.4 |
|
Conservative hold |
Swing |
|
|
| Pheasey Park Farm[5] |
| Party |
Candidate |
Votes |
% |
±% |
|
Conservative |
Christopher Towe |
2,960 |
50.1 |
-14.0 |
|
Labour |
Jack Kelly |
1,499 |
25.3 |
+10.4 |
|
UKIP |
Steve Grey |
780 |
13.2 |
-2.3 |
|
Liberal Democrat |
Martin Barker |
675 |
11.4 |
+5.8 |
| Majority |
1,461 |
24.7 |
-23.9 |
| Turnout |
5,914 |
68.6 |
+34.5 |
|
Conservative hold |
Swing |
|
|
| Pleck[5] |
| Party |
Candidate |
Votes |
% |
±% |
|
Labour |
Harbans Sarohi |
2,340 |
41.3 |
+5.6 |
|
Conservative |
Gulfam Wali |
1,790 |
31.6 |
-1.4 |
|
Liberal Democrat |
Mohammed Yaqub |
810 |
14.3 |
-6.1 |
|
UKIP |
Rita Oakley |
383 |
6.8 |
+1.7 |
|
Independent |
Mark Dabbs |
348 |
6.1 |
+0.3 |
| Majority |
550 |
9.7 |
+7.1 |
| Turnout |
5,671 |
60.1 |
+24.1 |
|
Labour hold |
Swing |
|
|
| Short Heath[5] |
| Party |
Candidate |
Votes |
% |
±% |
|
Liberal Democrat |
John Cook |
2,053 |
38.2 |
-5.6 |
|
Conservative |
Theresa Smith |
1,544 |
28.7 |
-0.9 |
|
Labour |
Doug Cleaver |
1,200 |
22.3 |
+13.2 |
|
UKIP |
Darren Hazell |
574 |
10.7 |
+10.7 |
| Majority |
509 |
9.5 |
-4.7 |
| Turnout |
5,371 |
59.3 |
+31.3 |
|
Liberal Democrat hold |
Swing |
|
|
| Streetly[5] |
| Party |
Candidate |
Votes |
% |
±% |
|
Conservative |
Eddie Hughes |
4,622 |
60.2 |
-12.3 |
|
Labour |
Steven King |
1,366 |
17.8 |
+5.3 |
|
Liberal Democrat |
Shirley Balgobin |
1,056 |
13.8 |
+7.7 |
|
UKIP |
Paul Valdmanis |
531 |
6.9 |
-2.0 |
|
Green |
Leandra Gebrakedan |
97 |
1.3 |
+1.3 |
| Majority |
3,256 |
42.4 |
-17.7 |
| Turnout |
7,672 |
71.2 |
+38.2 |
|
Conservative hold |
Swing |
|
|
| Willenhall North[5] |
| Party |
Candidate |
Votes |
% |
±% |
|
Liberal Democrat |
Valerie Woodruff |
1,903 |
32.9 |
-24.7 |
|
Conservative |
Abi Pitt |
1,667 |
28.8 |
+9.1 |
|
Labour |
Gareth Walker |
1,273 |
22.0 |
+9.9 |
|
BNP |
Graham Hadlington |
567 |
9.8 |
+9.8 |
|
UKIP |
Liz Hazell |
370 |
6.4 |
-4.2 |
| Majority |
236 |
4.1 |
-33.8 |
| Turnout |
5,780 |
61.7 |
+37.4 |
|
Liberal Democrat hold |
Swing |
|
|
| Willenhall South[5] |
| Party |
Candidate |
Votes |
% |
±% |
|
Labour |
Diane Coughlan |
2,583 |
45.1 |
+1.9 |
|
Conservative |
Suky Samra |
1,678 |
29.3 |
-2.0 |
|
Liberal Democrat |
Daniel Barker |
1,310 |
22.9 |
+3.2 |
|
Democratic Labour |
Stephanie Peart |
157 |
2.7 |
-3.1 |
| Majority |
905 |
15.8 |
+3.9 |
| Turnout |
5,728 |
54.3 |
+33.6 |
|
Labour hold |
Swing |
|
|
References