Walsall Metropolitan Borough Council election, 2007
The 2007 Walsall Metropolitan Borough Council election took place on 3 May 2007 to elect members of Walsall Metropolitan Borough Council in the West Midlands, England. One third of the council was up for election and the Conservative party stayed in overall control of the council.[1]
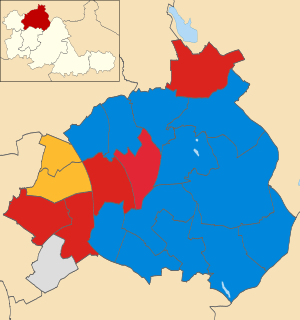
After the election, the composition of the council was
Background
After the last election in 2006 the Conservatives controlled the council with 34 seats, compared to 19 for Labour, 6 Liberal Democrats and 1 independent.[3] However in July 2006 2 Conservative councillors, Aqeel Aslam and Haqnawaz Khan of Pleck and St Matthews wards respectively, defected to Labour, leaving the Conservatives on 32 seats compared to 21 for Labour.[4]
Election result
The results saw the Conservatives gain 1 seat from Labour in Pleck, to move to 33 seats, and stay in control of the council.[5][6] As well as the loss to the Conservatives, Labour lost a further 2 seats and so fell to 18 councillors.[5] The other Labour losses came in Darlaston South, where independent Chris Bott gained the seat, and in Blakenall, where Peter Smith of the Democratic Labour Party, took the seat by 15 votes.[6] Meanwhile the Liberal Democrats won 2 seats and stayed on 6 councillors.[5]
| Walsall Local Election Result 2007[2][7] |
| Party |
Seats |
Gains |
Losses |
Net gain/loss |
Seats % |
Votes % |
Votes |
+/− |
| |
Conservative |
12 |
1 |
0 |
+1 |
60.0 |
41.1 |
26,455 |
+1.8% |
| |
Labour |
4 |
0 |
3 |
-3 |
20.0 |
29.3 |
18,845 |
+2.1% |
| |
Liberal Democrat |
2 |
0 |
0 |
0 |
10.0 |
11.9 |
7,689 |
-2.2% |
| |
Independent |
1 |
1 |
0 |
+1 |
5.0 |
3.9 |
2,483 |
+0.6% |
| |
Democratic Labour |
1 |
1 |
0 |
+1 |
5.0 |
2.8 |
1,818 |
-0.1% |
| |
UKIP |
0 |
0 |
0 |
0 |
0 |
5.5 |
3,567 |
+1.0% |
| |
BNP |
0 |
0 |
0 |
0 |
0 |
3.3 |
2,123 |
-4.2% |
| |
Respect |
0 |
0 |
0 |
0 |
0 |
1.3 |
825 |
+0.3% |
| |
Green |
0 |
0 |
0 |
0 |
0 |
0.9 |
566 |
+0.7% |
Ward results
| Aldridge Central and South[7][8] |
| Party |
Candidate |
Votes |
% |
±% |
|
Conservative |
John Rochelle |
2,310 |
55.7 |
+1.1 |
|
UKIP |
Tony Lenton |
775 |
18.7 |
+18.7 |
|
Labour |
Walter Burley |
625 |
15.1 |
+2.3 |
|
Liberal Democrat |
Linda Dickins |
436 |
10.5 |
+0.4 |
| Majority |
1,535 |
37.0 |
-0.3 |
| Turnout |
4,146 |
38.9 |
-2.0 |
|
Conservative hold |
Swing |
|
|
| Aldridge North and Walsall Wood[7][8] |
| Party |
Candidate |
Votes |
% |
±% |
|
Conservative |
Mike Flower |
2,175 |
66.9 |
+20.9 |
|
Liberal Democrat |
Mark Greveson |
548 |
16.9 |
+7.2 |
|
Labour |
Ian Pearson |
527 |
16.2 |
+1.1 |
| Majority |
1,627 |
50.1 |
+22.9 |
| Turnout |
3,250 |
31.6 |
-3.2 |
|
Conservative hold |
Swing |
|
|
| Bentley and Darlaston North[7][8] |
| Party |
Candidate |
Votes |
% |
±% |
|
Labour |
Keith Chambers |
1,216 |
46.4 |
+0.4 |
|
Conservative |
Gurmeet Sohal |
876 |
33.4 |
+4.1 |
|
Liberal Democrat |
Christopher Pearce |
429 |
16.4 |
-1.8 |
|
Democratic Labour |
Alan Paddock |
100 |
3.8 |
-2.7 |
| Majority |
340 |
13.0 |
-3.8 |
| Turnout |
2,621 |
29.0 |
+1.7 |
|
Labour hold |
Swing |
|
|
| Bloxwich East[7][8] |
| Party |
Candidate |
Votes |
% |
±% |
|
Conservative |
Lesley Beeley |
1,063 |
41.8 |
+1.7 |
|
Labour |
Robert Thomas |
767 |
30.2 |
-10.4 |
|
Independent |
Bill Smith |
365 |
14.4 |
+14.4 |
|
UKIP |
Alan Sheath |
191 |
7.5 |
-3.6 |
|
Liberal Democrat |
Jo Cameron |
105 |
4.1 |
+0.1 |
|
Democratic Labour |
Louise Bradburn |
52 |
2.0 |
-2.2 |
| Majority |
296 |
11.6 |
|
| Turnout |
2,543 |
29.7 |
-1.1 |
|
Conservative hold |
Swing |
|
|
| Darlaston South[7][8] |
| Party |
Candidate |
Votes |
% |
±% |
|
Independent |
Chris Bott |
1,127 |
40.1 |
-13.5 |
|
Labour |
Rose Burley |
1,116 |
39.8 |
+7.6 |
|
Conservative |
Cerwyn Edwards |
365 |
13.0 |
-1.2 |
|
Green |
Tim Martin |
199 |
7.1 |
+7.1 |
| Majority |
11 |
0.4 |
-21.0 |
| Turnout |
2,807 |
30.7 |
+0.7 |
|
Independent gain from Labour |
Swing |
|
|
| Paddock[7][8] |
| Party |
Candidate |
Votes |
% |
±% |
|
Conservative |
Barry Sanders |
2,049 |
48.4 |
+3.7 |
|
Labour |
Baldev Mavi |
1,340 |
31.6 |
+7.0 |
|
UKIP |
Derek Bennett |
589 |
13.9 |
-1.6 |
|
Liberal Democrat |
Muhammed Miah |
259 |
6.1 |
-9.0 |
| Majority |
709 |
16.7 |
-3.4 |
| Turnout |
4,237 |
44.3 |
-2.9 |
|
Conservative hold |
Swing |
|
|
| Pelsall[7][8] |
| Party |
Candidate |
Votes |
% |
±% |
|
Conservative |
Marco Longhi |
1,649 |
43.8 |
-0.8 |
|
Independent |
Sim Mayou |
641 |
17.0 |
+17.0 |
|
Liberal Democrat |
Grant Williams |
391 |
10.4 |
+10.4 |
|
BNP |
Dominic Buglar |
358 |
9.5 |
-9.2 |
|
Independent |
Amanda Ryder |
350 |
9.3 |
+9.3 |
|
Labour |
Jack Kelly |
341 |
9.1 |
+1.6 |
|
Democratic Labour |
Derek Roddy |
32 |
0.9 |
-1.4 |
| Majority |
1,008 |
26.8 |
+9.2 |
| Turnout |
3,762 |
41.8 |
-0.4 |
|
Conservative hold |
Swing |
|
|
| Pheasey Park Farm[7][8] |
| Party |
Candidate |
Votes |
% |
±% |
|
Conservative |
Michael Bird |
1,780 |
54.8 |
+1.7 |
|
Labour |
Douglas James |
679 |
20.9 |
-0.2 |
|
UKIP |
Steve Grey |
504 |
15.5 |
-3.1 |
|
Green |
Darren Smith |
144 |
4.4 |
+4.4 |
|
Liberal Democrat |
Trudy Pearce |
141 |
4.3 |
-3.0 |
| Majority |
1,101 |
33.9 |
+1.9 |
| Turnout |
3,248 |
39.0 |
-2.1 |
|
Conservative hold |
Swing |
|
|
| Short Heath[7][8] |
| Party |
Candidate |
Votes |
% |
±% |
|
Liberal Democrat |
Eileen Pitt |
1,220 |
43.9 |
+2.0 |
|
Conservative |
Chad Pitt |
741 |
26.6 |
+5.0 |
|
BNP |
Malcolm Moore |
486 |
17.5 |
-4.6 |
|
Labour |
Aftab Nawaz |
335 |
12.0 |
-2.4 |
| Majority |
479 |
17.2 |
-2.5 |
| Turnout |
2,782 |
30.9 |
-0.8 |
|
Liberal Democrat hold |
Swing |
|
|
| Willnenhall North[7][8] |
| Party |
Candidate |
Votes |
% |
±% |
|
Liberal Democrat |
Peter Hughes |
1,125 |
42.8 |
-5.3 |
|
Conservative |
Ann Ault |
583 |
22.2 |
+5.2 |
|
Labour |
Diane Coughlan |
519 |
19.8 |
+3.9 |
|
UKIP |
Elizabeth Hazell |
399 |
15.2 |
-3.8 |
| Majority |
542 |
20.6 |
-8.5 |
| Turnout |
2,626 |
27.5 |
-1.2 |
|
Liberal Democrat hold |
Swing |
|
|
References