Volcanic explosivity index
- VEI redirects here. For the company, see Visual Entertainment Inc.

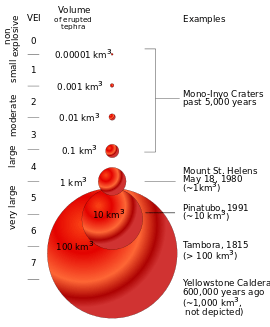
The volcanic explosivity index (VEI) was devised by Chris Newhall of the US Geological Survey and Stephen Self at the University of Hawaii in 1982 to provide a relative measure of the explosiveness of volcanic eruptions.
Volume of products, eruption cloud height, and qualitative observations (using terms ranging from "gentle" to "mega-colossal") are used to determine the explosivity value. The scale is open-ended with the largest volcanoes in history given magnitude 8. A value of 0 is given for non-explosive eruptions, defined as less than 10,000 m3 (350,000 cu ft) of tephra ejected; and 8 representing a mega-colossal explosive eruption that can eject 1.0×10¹² m3 (240 cubic miles) of tephra and have a cloud column height of over 50 km (31 mi). The scale is logarithmic, with each interval on the scale representing a tenfold increase in observed ejecta criteria, with the exception of between VEI 0, VEI 1 and VEI 2.[1]
Classification
With indices running from 0 to 8, the VEI associated with an eruption is dependent on how much volcanic material is thrown out, to what height, and how long the eruption lasts. The scale is logarithmic from VEI 2 and up; an increase of 1 index indicates an eruption that is 10 times as powerful. As such there is a discontinuity in the definition of the VEI between indices 1 and 2. The lower border of the volume of ejecta jumps by a factor of 100 from 10,000 to 1,000,000 m3 (350,000 to 35,310,000 cu ft) while the factor is 10 between all higher indices.
| VEI | Ejecta volume | Classification | Description | Plume | Frequency | Tropospheric injection |
Stratospheric injection[2] |
Examples |
|---|---|---|---|---|---|---|---|---|
| 0 | < 10,000 m³ | Hawaiian | Effusive | < 100 m | constant | negligible | none | Kīlauea, Piton de la Fournaise, Erebus |
| 1 | > 10,000 m³ | Hawaiian / Strombolian | Gentle | 100–1000 m | daily | minor | none | Nyiragongo (2002), Raoul Island (2006) |
| 2 | > 1,000,000 m³ | Strombolian / Vulcanian | Explosive | 1–5 km | weekly | moderate | none | Unzen (1792), Cumbre Vieja (1949), Galeras (1993), Sinabung (2010) |
| 3 | > 10,000,000 m³ | Vulcanian / Peléan | Catastrophic | 3–15 km | few months | substantial | possible | Nevado del Ruiz (1985), Soufrière Hills (1995), Nabro (2011) |
| 4 | > 0.1 km³ | Peléan / Plinian | Cataclysmic | 10–25 km | ≥ 1 yr | substantial | definite | Mayon (1814), Pelée (1902), Eyjafjallajökull (2010) |
| 5 | > 1 km³ | Plinian | Paroxysmic | 20–35 km | ≥ 10 yrs | substantial | significant | Vesuvius (79), Fuji (1707), Mount Tarawera (1886), St. Helens (1980), Puyehue (2011) |
| 6 | > 10 km³ | Plinian / Ultra-Plinian | Colossal | > 30 km | ≥ 100 yrs | substantial | substantial | Veniaminof (c. 1750 BC), Huaynaputina (1600), Krakatoa (1883), Novarupta (1912), Pinatubo (1991), Laki (1783) |
| 7 | > 100 km³ | Ultra-Plinian | Mega-colossal | > 40 km | ≥ 1,000 yrs | substantial | substantial | Mazama (c. 5600 BC), Thera (c. 1620 BC), Samalas (Mount Rinjani) (1257), Tambora (1815), Taupo (180) |
| 8 | > 1,000 km³ | Supervolcanic | Apocalyptic | > 50 km | ≥ 10,000 yrs | substantial | substantial | Yellowstone (640,000 BC), Toba (74,000 BP), Taupo (24,500 BC) La Garita Caldera (26.3 Ma) |
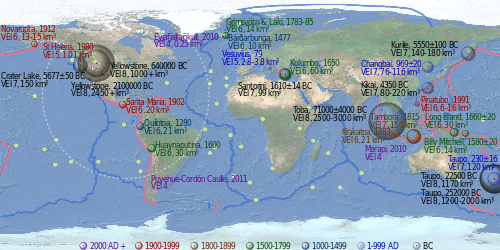
A total of 47 eruptions of VEI 8 magnitude or above, ranging in age from Ordovician to Pleistocene, have been identified, of which 42 occurred in the past 36 million years. The most recent is Lake Taupo's Oruanui eruption, 26,500 years ago, which means that there have not been any Holocene (within the last 10,000 years) eruptions with a VEI of 8.[3] There have been at least five identified Holocene eruptions with a VEI of 7. There are also 58 plinian eruptions, and 13 caldera-forming eruptions, of large, but unknown magnitudes. There are likely many other eruptions that are not identified.
Limitations of VEI
Under the VEI, ash, lava, lava bombs and ignimbrite are all treated alike. Density and vesicularity (gas bubbling) of the volcanic products in question is not taken into account. In contrast, the DRE (dense-rock equivalent) is sometimes calculated to give the actual amount of magma erupted. Another weakness of the VEI is that it does not take into account the power output of an eruption, which makes it extremely difficult to determine with prehistoric or unobserved eruptions.
Although VEI is quite suitable for classifying the explosive magnitude of eruptions, the index is not as significant as sulphur dioxide emissions in quantifying their atmospheric and climatic impact, as a 2004 paper by Georgina Miles, Roy Grainger and Eleanor Highwood points out.
“Tephra, or fallout sediment analysis, can provide an estimate of the explosiveness of a known eruption event. It is, however, not obviously related to the amount of SO2 emitted by the eruption. The volcanic explosivity index (VEI) was derived to catalogue the explosive magnitude of historical eruptions, based on the order of magnitude of erupted mass, and gives a general indication as to the height the eruptive column reached. The VEI itself is inadequate for describing the atmospheric effects of volcanic eruptions. This is clearly demonstrated by two eruptions, Agung (1963) and El Chichón (1982). Their VEI classification separates them by an order of magnitude in explosivity, although the volume of SO2 released into the stratosphere by each was measured to be broadly similar, as shown by the optical depth data for the two eruptions.”[4]
Lists of large eruptions

- List of large volcanic eruptions of the 19th century (≥ VEI 4)
- List of large volcanic eruptions of the 20th century (≥ VEI 4)
- List of large volcanic eruptions in the 21st century (≥ VEI 4)
- Timetable of major worldwide volcanic eruptions (mostly VEI 6, within 2 kya)
- List of large volcanic eruptions (mostly VEI 6-8, within 50 Mya)
- List of largest volcanic eruptions (VEI 7-8, within 1600 Mya)
See also
References
- ↑ Newhall, Christopher G.; Self, Stephen (1982). "The Volcanic Explosivity Index (VEI): An Estimate of Explosive Magnitude for Historical Volcanism" (PDF). Journal of Geophysical Research 87 (C2): 1231–1238. Bibcode:1982JGR....87.1231N. doi:10.1029/JC087iC02p01231.
- ↑ VEI (Volcanic Explosivity Index),Global Volcanism Program, Smithsonian National Museum of Natural History Archive.org link accessed 21 August 2014
- ↑ Mason, Ben G.; Pyle, David M.; Oppenheimer, Clive (2004). "The size and frequency of the largest explosive eruptions on Earth". Bulletin of Volcanology 66 (8): 735–748. Bibcode:2004BVol...66..735M. doi:10.1007/s00445-004-0355-9.
- ↑ Miles, M. G.; Grainger, R. G.; Highwood, E. J. (2004). "Volcanic Aerosols: The significance of volcanic eruption strength and frequency for climate" (PDF). Quarterly Journal of the Royal Meteorological Society 130 (602): 2361–2376. doi:10.1256/qj.30.60.
External links
- VEI glossary entry from a USGS website
- How to measure the size of a volcanic eruption, from The Guardian
- The size and frequency of the largest explosive eruptions on Earth, a 2004 article from the Bulletin of Volcanology
- List of Large Holocene Eruptions (VEI > 4) from the Smithsonian Global Volcanism Program