Urban sprawl


Urban sprawl or suburban sprawl describes the expansion of human populations away from central urban areas into low-density, monofunctional and usually car-dependent communities. In addition to describing a particular form of urbanization, the term also relates to the social and environmental consequences associated with this development. In Continental Europe the term "peri-urbanisation" is often used to denote similar dynamics and phenomena, although the term urban sprawl is currently being used by the European Environment Agency. There is widespread disagreement about what constitutes sprawl and how to quantify it. For example, some commentators measure sprawl only with the average number of residential units per acre in a given area. But others associate it with decentralization (spread of population without a well-defined centre), discontinuity (leapfrog development, as defined below), segregation of uses, and so forth.
The term urban sprawl is highly politicized, and almost always has negative connotations. It is criticized for causing environmental degradation, and intensifying segregation and undermining the vitality of existing urban areas and attacked on aesthetic grounds. Due to the pejorative meaning of the term, few openly support urban sprawl as such. The term has become a rallying cry for managing urban growth.[2]
Definition & Characteristics


Definitions of sprawl vary. Reid Ewing has shown that sprawl has typically been characterized as urban developments exhibiting at least one of the following characteristics: low-density or single-use development, strip development, scattered development, and/or leapfrog development (areas of development interspersed with vacant land).[4] He argued that a better way to identify sprawl was to use indicators rather than characteristics because this was a more flexible and less arbitrary method.[5] He proposed using "accessibility" and "functional open space" as indicators. Accessibility can be measured in a variety of quantifiable ways such as average trip length, travel time or more complicated accessibility indices to determine the efficiency of household travel patterns. Functional open space refers to space that performs a useful public function.[5] Ewing's approach has been criticized for assuming that sprawl is defined by negative characteristics.[4] What constitutes sprawl may be considered a matter of degree and will always be somewhat subjective under many definitions of the term.[5] Ewing has also argued that suburban development does not, per se constitute sprawl depending on the form it takes,[5] although Gordon & Richardson have argued that the term is sometimes used synonymously with suburbanization in a pejorative way.[6] The following characteristics are often associated with sprawl:
Single-use zoning
This refers to a situation where commercial, residential, institutional and industrial areas are separated from one another. Consequently, large tracts of land are devoted to a single use and are segregated from one another by open space, infrastructure, or other barriers. As a result, the places where people live, work, shop, and recreate are far from one another, usually to the extent that walking, transit use and bicycling are impractical, so all these activities generally require an automobile.[7]
Low-density
Sprawl is often characterized as consisting of low-density development.[4] The exact definition of "low density" is arguable, but a common example is that of single family homes on large lots. Buildings usually have fewer stories and are spaced farther apart, separated by lawns, landscaping, roads or parking lots. Specific measurements of what constitutes low-density is culturally relative; for example, in the United States 2-4 houses per acre might be considered low-density while in the UK 8-12 would still be considered low-density.[4] Because more automobiles are used much more land is designated for parking. The impact of low density development in many communities is that developed or "urbanized" land is increasing at a faster rate than the population is growing.
Overall density is often lowered by "leapfrog development". This term refers to the relationship, or lack thereof, between subdivisions. Such developments are typically separated by large green belts, i.e. tracts of undeveloped land, resulting in an average density far lower even than the low density described in the previous paragraph. This is a 20th and 21st century phenomenon generated by the current custom of requiring a developer to provide subdivision infrastructure as a condition of development.[8] Usually, the developer is required to set aside a certain percentage of the developed land for public use, including roads, parks and schools. In the past, when a local government built all the streets in a given location, the town could expand without interruption and with a coherent circulation system, because it had condemnation power. Private developers generally do not have such power (although they can sometimes find local governments willing to help), and often choose to develop on the tracts that happen to be for sale at the time they want to build, rather than pay extra or wait for a more appropriate location.
Job sprawl and spatial mismatch
Job Sprawl is another land use symptom of urban sprawl and car-dependent communities. It is defined as low-density, geographically spread-out patterns of employment, where the majority of jobs in a given metropolitan area are located outside of the main city's Central Business District (CBD), and increasingly in the suburban periphery. It is often the result of urban disinvestment, the geographic freedom of employment location allowed by predominantly car-dependent commuting patterns of many American suburbs, and many companies' desire to locate in low-density areas that are often more affordable and offer potential for expansion. Spatial mismatch is related to job sprawl and economic Environmental Justice. Spatial Mismatch is defined as the situation where poor urban, predominantly minority citizens are left without easy access to entry-level jobs, as a result of increasing job sprawl and limited transportation options to facilitate a reverse commute to the suburbs.
Job sprawl has been documented and measured in various ways. It has been shown to be a growing trend in America's metropolitan areas. The Brookings Institution has published multiple articles on the topic. In 2005, author Michael Stoll defined job sprawl simply as jobs located more than 5-mile (8.0 km) radius from the CBD, and measured the concept based on year 2000 U.S. Census data.[9] Other ways of measuring the concept with more detailed rings around the CBD include a 2001 article by Edward Glaeser[10] and Elizabeth Kneebone's 2009 article, which show that sprawling urban peripheries are gaining employment while areas closer to the CBD are losing jobs.[11] These two authors used three geographic rings limited to a 35-mile (56 km) radius around the CBD: 3 miles (4.8 km) or less, 3 to 10 miles (16 km), and 10 to 35 miles (56 km). Kneebone's study showed the following nationwide breakdown for the largest metropolitan areas in 2006: 21.3% of jobs located in the inner ring, 33.6% of jobs in the 3-10 mile ring, and 45.1% in the 10-35 mile ring. This compares to the year 1998 - 23.3%, 34.2%, and 42.5% in those respective rings. The study shows CBD employment share shrinking, and job growth focused in the suburban and exurban outer metropolitan rings.
Conversion of agricultural land to urban use
Land for expansion of suburban housing or commercial development is usually purchased from farmers and/or ranchers. In the United States the seller may avoid tax on profit by using a tax break exempting like-kind exchanges from capital gains tax; proceeds from the sale are used to purchase agricultural land elsewhere and the transaction is treated as a "swap" or trade of like assets and no tax is due. Thus urban sprawl is subsidized by the tax code.[12]
Housing subdivisions

Housing subdivisions are large tracts of land consisting entirely of newly built residences. New Urbanist architectural firm Duany Plater-Zyberk & Company claim that housing subdivisions "are sometimes called villages, towns, and neighbourhoods by their developers, which is misleading since those terms denote places that are not exclusively residential."[13] They are also referred to as developments.
Subdivisions often incorporate curved roads and cul-de-sacs. These subdivisions may offer only a few places to enter and exit the development, causing traffic to use high volume collector streets. All trips, no matter how short, must enter the collector road in a suburban system. (Duany Plater-Zyberk 5, 34)
Commercial characteristics
In areas of sprawl commercial use is generally segregated from other uses. In the U.S. and Canada, these vary from strip malls, which refer to collections of buildings sharing a common parking lot, usually built on a high-capacity roadway with commercial functions (i.e., a "strip"). Similar developments in the UK are called Retail Parks. Strip malls/retail parks contain a wide variety of retail and non-retail functions that also cater to daily use (e.g. video rental, takeout food, laundry services, hairdresser). Strip malls consisting mostly of big box stores or category killers are sometimes called "power centers" (U.S.). These developments tend to be low-density; the buildings are single-story and there is ample space for parking and access for delivery vehicles. This character is reflected in the spacious landscaping of the parking lots and walkways and clear signage of the retail establishments. Some strip malls are undergoing a transformation into Lifestyle centers; entailing investments in common areas and facilities (plazas, cafes) and shifting tenancy from daily goods to recreational shopping. European countries such as France, Belgium and Germany have implemented size restrictions for superstores found in strip malls in an effort to limit sprawl (Davies 1995).

Another prominent form of retail development in areas characterized by sprawl is the shopping mall. Unlike the strip mall, this is usually composed of a single building surrounded by a parking lot that contains multiple shops, usually "anchored" by one or more department stores (Gruen and Smith 1960). The function and size is also distinct from the strip mall. The focus is almost exclusively on recreational shopping rather than daily goods. Shopping malls also tend to serve a wider (regional) public and require higher-order infrastructure such as highway access and can have floorspaces in excess of a million square feet (ca. 100,000 m²). Shopping malls are often detrimental to downtown shopping centres of nearby cities since the shopping malls act as a surrogate for the city centre (Crawford 1992). Some downtowns have responded to this challenge by building shopping centres of their own (Frieden and Sagelyn 1989).
Fast food chains are often built early in areas with low property values where the population is expected to boom and where large traffic is predicted, and set a precedent for future development. Eric Schlosser, in his book Fast Food Nation, argues that fast food chains accelerate suburban sprawl and help set its tone with their expansive parking lots, flashy signs, and plastic architecture (65). Duany Plater Zyberk & Company believe that this reinforces a destructive pattern of growth in an endless quest to move away from the sprawl that only results in creating more of it (Duany Plater-Zyberk 26).
Lawn
Urban sprawl had an effect on the use of private property space usage. Until the development of mechanical lawnmowers, the private lawn were only possible for the extremely wealthy, due to the cost of land and cost of upkeep. Because the advent of sprawl meant more land for lower costs, home owners had more land at their disposal, and the development of the urban lawn after the Second World War became commonplace.[14] The creation in the early 20th century of country clubs and golf courses completed the rise of lawn culture.[15] As a simple test, urban economists have been known to use what they call the "sit on top lawnmower assessment" as a rudimentary method to determine if the area in question is an example of urban sprawl. If a large number of homeowners in the area are owners of a mechanical lawnmower, or if lawnmower sales in the area are common and the population density is still somewhat high, urban sprawl may be present.[16]
History
Urbanization
The density gradient of industrialising cities has tended to follow a specific pattern: the density of the centre of the city would rise during urbanization and the population would remain heavily concentrated in the city centre with a rapid decline in settlement towards the periphery. Then, with continued economic growth and the expanding networks of public transport, people (particularly the middle class) would then slowly migrate towards the suburbs, gradually softening the population density gradient. This point was generally reached when the city reached a certain stage of economic development. In London, this point was reached in the first half of the 19th century, in Paris toward the end of the century and in New York at the turn of the 20th.[17]
The term "urban sprawl" was first used in an article in The Times in 1955 as a negative comment on the state of London's outskirts. However, London had been sprawling out of its medieval confines within the City since the 18th century, when the city experienced its' first great urban surge. Areas to the west of Westminster were increasingly built up for the wealthy, to live in the suburbs of the city.
.png)
A dramatic increase in the city's urban sprawl began in the 19th century, when labourers flocked from the countryside to work in the new factories that were then springing up. Large developments of small terraced houses began to appear and the new public transportation systems - (the metro, buses and trams) - allowed workers to commute into the city daily.[18] Suburban districts also sprung up around the city centre to accommodate those who wanted to escape the squalid conditions of the industrial town.
By the mid-19th century, the first major suburban areas were springing up around London as the city (then the largest in the world) became more overcrowded and unsanitary. A major catalyst in the growth in urban sprawl came from the opening of the Metropolitan Railway in the 1860s. The line joined the capital's financial heart in the City to what were to become the suburbs of Middlesex.[19] Harrow was reached in 1880, and the line eventually extended as far as Verney Junction in Buckinghamshire, more than 50 miles (80 kilometres) from Baker Street and the centre of London.
Unlike other railway companies, which were required to dispose of surplus land, the Met was allowed to retain such land that it believed was necessary for future railway use.[lower-alpha 1] Initially, the surplus land was managed by the Land Committee,[21] and, from the 1880s, the land was developed and sold to domestic buyers in places like Willesden Park Estate, Cecil Park, near Pinner and at Wembley Park. In 1919, with the expectation of a postwar housing boom,[22] the Metropolitan Railway Country Estates Limited (MRCE) was formed and went on to develop estates at Kingsbury Garden Village near Neasden, Wembley Park, Cecil Park and Grange Estate at Pinner and the Cedars Estate at Rickmansworth and create places such as Harrow Garden Village.[22][23]
By the early twentieth century then, amid increasing middle-class affluence, large low-density suburbs of semi-detached houses had sprung up all around the city, doubling the area of built-up London in the interwar period alone, despite the population increase being just 10 percent. H.G Wells even predicted in 1902 that within a hundred years most of southern England would have been subsumed into one gigantic conurbation centred in London.
Early attempts at combating urban sprawl

Starting in the early 20th century, environmentalist opposition to urban sprawl began to coalesce, with roots in the garden city movement, as well as pressure from campaign groups such as the Campaign to Protect Rural England (CPRE).
Under Herbert Morrison's 1934 leadership of the London County Council, the first formal proposal was made by the Greater London Regional Planning Committee "to provide a reserve supply of public open spaces and of recreational areas and to establish a green belt or girdle of open space". It was again included in an advisory Greater London Plan prepared by Patrick Abercrombie in 1944.[24] The Town and Country Planning Act of 1947 expressly incorporated green belts into all further national urban developments.
New provisions for compensation in the 1947 Town and Country Planning Act allowed local authorities around the country to incorporate green belt proposals in their first development plans. The codification of Green Belt policy and its extension to areas other than London came with the historic Circular 42/55 inviting local planning authorities to consider the establishment of Green Belts. The first urban growth boundary in the U.S. was in Fayette County, Kentucky in 1958.[25]
Examples
According to the National Resources Inventory (NRI), about 8,900 square kilometres (2.2 million acres) of land in the United States was developed between 1992 and 2002. Presently, the NRI classifies approximately 100,000 more square kilometres (40,000 square miles) (an area approximately the size of Kentucky) as developed than the Census Bureau classifies as urban. The difference in the NRI classification is that it includes rural development, which by definition cannot be considered to be "urban" sprawl. Currently, according to the 2000 Census, approximately 2.6 percent of the U.S. land area is urban.[26] Approximately 0.8 percent of the nation's land is in the 37 urbanized areas with more than 1,000,000 population. In 2002, these 37 urbanized areas supported around 40% of the total American population.[27]

Nonetheless, some urban areas have expanded geographically even while losing population. But it was not just urbanized areas in the U.S. that lost population and sprawled substantially. According to data in "Cities and Automobile Dependence" by Kenworthy and Laube (1999), urbanized area population losses occurred while there was an expansion of sprawl between 1970 and 1990 in Amsterdam, the Netherlands; Brussels, Belgium; Copenhagen, Denmark; Frankfurt, Hamburg, and Munich, Germany; and Zurich, Switzerland, albeit without the wholesale dismantling of public transit systems that occurred in the United States.

At the same time, the urban cores of these and nearly all other major cities in the United States, Western Europe, and Japan that did not annex new territory experienced the related phenomena of falling household size and, particularly in the U.S., "white flight", sustaining population losses.[28] This trend has slowed somewhat in recent years, as more people have regained an interest in urban living.
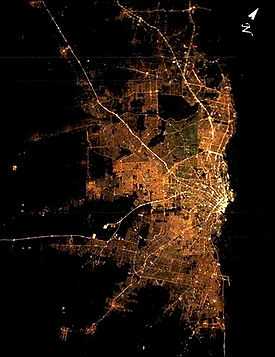
Los Angeles was one of the world's first low density urbanized areas, resulting from its large geographic metropolitan area. Today, the area's near universal car ownership makes it a prominent example of sprawl. However, Los Angeles has become more dense over the past half-century, principally due to small lot zoning and a high demand for housing due to population growth. Today, the greater Los Angeles metropolitan area is denser than any other in the country.[29]
Urban sprawl is not limited to developed countries, and may be more prevalent in developing countries. For example, there is considerable land consumed by urban sprawl in Mexico City,in the National Capital Region that surrounds Delhi, in Beijing, the new desert developments of 6 October City and New Cairo to the west and east of Cairo (respectively), in Antananarivo (the capital of Madagascar), in Johannesburg and in eastern parts of South Africa. The international cases of sprawl often draw into question the definition of the term and what conditions are necessary for urban growth to be considered sprawl. In Mexico, for example, new housing development at the urban periphery is single-use but not low-density.[30]
Debate
_2006.jpg)
_2006.jpg)
Criticisms
Arguments opposing urban sprawl include concrete effects such as health and environmental issues as well as abstract consequences including neighborhood vitality.
Health and environmental impact
Urban sprawl is associated with a number of negative environmental and public health outcomes, with the primary result being increased dependence on automobiles. A research done in Canada regarding urban sprawl shows that the environmental problems that result from uncontrolled urban growth are numerous, and have a significant impact on health. These problems include flooding, which results from increased impervious surfaces for roads and parking; increased temperatures from heat islands, which leads to a significant increased risk of mortality in elderly populations; decreases in natural areas and forests, and increased incidences of water pollution and water-borne disease. The impact of the built environment on health is an emerging field of study and more rigorous research is needed, especially in Canada. Despite this, the existing research clearly indicates that serious public health problems will continue to escalate unless decisive and immediate action is taken to control urban sprawl and preserve sufficient greenspace, improve air quality, and protect water sources.[31]
Physical health impacts of sprawl
Air pollution sprawl leads to increased driving, and increased driving leads to vehicle emissions that contribute to air pollution and its attendant negative impacts on human health. Results of numerous studies in the US show that sprawling patterns of development lead to increased use of the private automobile as the primary mode of transportation. Low density levels, single purpose land usage, and poorly connected street networks are associated with more vehicle miles traveled (VMT), increased vehicle hours of travel (VHT), fewer transit trips, and greater vehicle. [32]
Air pollution affects health directly, while increased greenhouse gases emissions contribute to climate change, with numerous resulting negative effects on public health. In reference to the Urban Sprawl and it impact on the public health. An example that was discussed is all about Canada and problems they face as it relates to Air pollution. How do Vehicular Emissions Lead to Air Pollution? Automobiles are a major source of air pollution in Ontario. With the projected increased number of vehicles, vehicle kilometers driven and the introduction of larger, less fuel efficient vehicles, such as sports utility vehicles (SUVs) and minivans, they will continue to be a direct source of emissions contributing to poor air quality. Reductions in emissions per vehicle kilometer traveled, which are related to both improved emission control technology and cleaner fuel, as well as inspection and maintenance programs such as “Drive Clean” in Ontario, will not offset this increase in emissions (Bates, 2000). In 2001, the percentage of pollutants in Ontario derived from transportation was as follows: Oxides of Nitrogen: 33% of Oxides of Nitrogen (NOx) from road vehicles, and another 30% from other transportation, Particulates: 20% of Particulate matter less than 2.5 microns (PM 2.5 ), Carbon Monoxide: 58% of Carbon Monoxide (CO) derived from vehicular travel and another 27% from other transportation sources VOC's: 18% of Volatile Organic Compounds. (Data: Ontario Ministry of the Environment, Air Quality in Ontario, 2002) [33]
Increased pollution and reliance on fossil fuel
In the years following World War II, when vehicle ownership was becoming widespread, public health officials recommended the health benefits of suburbs due to soot and industrial fumes in the city center. However, air in modern suburbs is not necessarily cleaner than air in urban neighborhoods.[34] In fact, the most polluted air is on crowded highways, where people in suburbs tend to spend more time. On average, suburban residents generate more per capita pollution and carbon emissions than their urban counterparts because of their increased driving.[7][35]

Increase in traffic and traffic-related fatalities
A heavy reliance on automobiles increases traffic throughout the city as well as automobile crashes, pedestrian injuries, and air pollution.[37] Motor vehicle crashes are the leading cause of death for Americans between the ages of five and twenty-four and is the leading accident-related cause for all age groups.[38] Residents of more sprawling areas are at greater risk of dying in a car crash.[39]
Delays in emergency medical services response and fire department response times
Research covered in the Journal of Economic Issues and State and Local Government Review shows a link between sprawl and emergency medical services response and fire department response delays.[40][41][42]
Increased obesity
The American Journal of Public Health and the American Journal of Health Promotion, have both stated that there is a significant connection between sprawl, obesity, and hypertension.[43] Many urbanists argue that this is due to less walking in sprawl-type developments. Living in a car centered culture forces inhabitants to drive everywhere, thus walking far less than their urban (and generally healthier) counterparts.[44]
Decrease in social capital
Urban sprawl may be partly responsible for the decline in social capital in the United States. Compact neighborhoods can foster casual social interactions among neighbors, while sprawl creates barriers. Sprawl tends to replace public spaces with private spaces such as fenced-in backyards.[45]
Decrease in land and water quantity and quality
Due to the larger area consumed by sprawling suburbs compared to urban neighborhoods, more farmland and wildlife habitats are displaced per resident. As forest cover is cleared and covered with impervious surfaces (concrete and asphalt) in the suburbs, rainfall is less effectively absorbed into the groundwater aquifers.[7] This threatens both the quality and quantity of water supplies. Sprawl increases water pollution as rain water picks up gasoline, motor oil, heavy metals, and other pollutants in runoff from parking lots and roads. Sprawl fragments the land, which increases the risk of invasive species spreading into the remaining forest.
Increased infrastructure costs
Living in larger, more spread out spaces generally makes public services more expensive. Since car usage becomes endemic and public transport often becomes significantly more expensive, city planners are forced to build highway and parking infrastructure, which in turn decreases taxable land and revenue, and decreases the desirability of the area adjacent to such structures. Providing services such as water, sewers, and electricity is also more expensive per household in less dense areas.[46]
Increased personal transportation costs
Residents of low-density areas spend a higher proportion of their income on transportation than residents of high density areas.[47] The RAC estimates that the average cost of operating a car in the UK is £5,000 a year, most of which stems from financing costs and depreciation.[48] In comparison, a yearly underground ticket for a suburban commuter in London (where the average wage is higher than the national average[49]) costs £1,000-1,500, which, because of subsidies, do not cover financing for the rail or depreciation of the infrastructure. In the Euro-15, rail transit requires $69 billion euro in subsidies while road transportation nets $107 billion euro in additional taxes.[50]

Neighborhood quality
Critics of sprawl maintain that sprawl erodes quality of life. Duany and Plater-Zyberk believe that in traditional neighborhoods the nearness of the workplace to retail and restaurant space that provides cafes and convenience stores with daytime customers is an essential component to the successful balance of urban life. Furthermore, they state that the closeness of the workplace to homes also gives people the option of walking or riding a bicycle to work or school and that without this kind of interaction between the different components of life the urban pattern quickly falls apart. (Duany Plater-Zyberk 6, 28). James Howard Kunstler has argued that poor aesthetics in suburban environments make them "places not worth caring about", and that they lack a sense of history and identity.
White flight
Some blame suburbs for what they see as a homogeneity of society and culture, leading to sprawling suburban developments of people with similar race, background and socioeconomic status.[52] They claim that segregated and stratified development was institutionalized in the early 1950s and 1960s with the financial industries' then-legal process of redlining neighborhoods to prevent certain people from entering and residing in affluent districts. Sprawl may have a negative impact on public schools as finances have been pulled out of city cores and diverted to wealthier suburbs.[53] They argue that the residential and social segregation of whites from blacks in the United States creates a socialization process that limits whites' chances for developing meaningful relationships with blacks and other minorities, and that the segregation experienced by whites from blacks fosters segregated lifestyles and can lead to positive views about themselves and negative views about blacks.[54]
Groups that oppose sprawl
The American Institute of Architects and the American Planning Association recommend against sprawl and instead endorses smart, mixed-use development, including buildings in close proximity to one another that cut down on automobile use, save energy, and promote walkable, healthy, well-designed neighborhoods.[55] The Sierra Club, the San Francisco Bay Area's Greenbelt Alliance, 1000 Friends of Oregon and counterpart organizations nationwide, and other environmental organizations oppose sprawl and support investment in existing communities.[56][57] NumbersUSA, a national organization advocating immigration reduction, also opposes urban sprawl,[58] and its executive director, Roy Beck, specializes in the study of this issue.[59]
Social Dynamics
It is impossible to discuss Urban Sprawl without including a presentation of concepts as it relates to social separation by race and class. A rural or urban area is often made up of groups and with regards to urban sprawl, sub-urban development has often been about the flight of white populations from central cities and the economic separation of the affluent from the isolated concentrations of the poor in cities. These separation takes several forms:[60]
Discrimination
This is described as an overt policy that benefits or exclude participation in an activity. There are activities that operate in the social and governmental structures with apparent similar effect. Most importantly, current census data show continuing economic and racial concentrations in metropolitan regions.
Economic Segregation
Economic segregation is intuitive. People with money have more choices than people without. In a metropolis, family wealth is made up of several factors-wages, assets, business ownership. As the family income increases and diversifies, wealth accumulations are invested in land, transportation and additional business activity. In the nineteenth and early twentieth centuries, wealthier families moved their residence away from the denser urban areas. Facilitated by expending transportation improvements, social stratification began to manifest itself in geographic separation.
Social Class
Economic segregation only partially explains the dispersal of people in the region. Social Class is particularly helpful in explaining why people who gain greater choice limit those choices to certain locations.
Praise & support
American public policy analyst Randal O'Toole of the Cato Institute, a libertarian think tank, has argued that sprawl, thanks to the automobile, gave rise to affordable suburban neighborhoods for middle class and lower class individuals, including non-whites. He notes that efforts to combat sprawl often result in subsidizing development in wealthier and whiter neighborhoods while condemning and demolishing poorer minority neighborhoods.[61]
Consumer preference for sprawl
Peter Gordon, a professor of planning and economics at the University of Southern California's School of Urban Planning and Development, argues that many households in the United States, Canada, and Australia, especially middle and upper class families, have shown a preference for the suburban lifestyle.[62] Reasons cited include a preference towards lower-density development (for lower ambient noise and increased privacy), better schools, less crime, and a generally slower lifestyle than the urban one.[62] Those in favor of the current pro low-density land use policies also argue that this sort of living situation is an issue of personal choice and economic means.[62] One suburban Detroit politician defends low-density development as the preferred lifestyle choice of his constituents, calling it "...the American Dream unfolding before your eyes."
Proper Link: http://www.oakgov.com/exec/Pages/brooks/sprawl.aspx Someone please format this correctly with a citation, I don't know how.
Urban sprawl and automobile dependency

Whether urban sprawl does increase problems of automobile dependency and whether conversely, policies of smart growth can reduce them have been fiercely contested issues over several decades. An influential study in 1989 by Peter Newman and Jeff Kenworthy compared 32 cities across North America, Australia, Europe and Asia.[63] The study has been criticised for its methodology[64] but the main finding that denser cities, particularly in Asia, have lower car use than sprawling cities, particularly in North America, has been largely accepted although the relationship is clearer at the extremes across continents than it is within countries where conditions are more similar.
Within cities, studies from across many countries (mainly in the developed world) have shown that denser urban areas with greater mixture of land use and better public transport tend to have lower car use than less dense suburban and ex-urban residential areas. This usually holds true even after controlling for socio-economic factors such as differences in household composition and income.[65] This does not necessarily imply that suburban sprawl causes high car use, however. One confounding factor, which has been the subject of many studies, is residential self-selection:[66] people who prefer to drive tend to move towards low density suburbs, whereas people who prefer to walk, cycle or use transit tend to move towards higher density urban areas, better served by public transport. Some studies have found that, when self-selection is controlled for, the built environment has no significant effect on travel behaviour.[67] More recent studies using more sophisticated methodologies have generally refuted these findings: density, land use and public transport accessibility can influence travel behaviour, although social and economic factors, particularly household income, usually exert a stronger influence.[68]
Paradox of intensification
Reviewing the evidence on urban intensification, smart growth and their effects on travel behaviour Melia et al. (2011)[69] found support for the arguments of both supporters and opponents of smart growth measures to counteract urban sprawl. Planning policies that increase population densities in urban areas do tend to reduce car use, but the effect is a weak one, so doubling the population density of a particular area will not halve the frequency or distance of car use.
These findings led them to propose the paradox of intensification, which states:
Debate over traffic and commute times
Those not opposed to low density development argue that traffic intensities tend to be less, traffic speeds faster and, as a result, ambient air pollution is lower. (See demographia's report.) Kansas City, Missouri is often cited as an example of ideal low-density development, with congestion below the mean and home prices below comparable Midwestern cities. Wendell Cox and Randal O'Toole are the leading figures supporting lower density development.
Longitudinal (time-lapse) studies of commute times in major metropolitan areas in the United States have shown that commute times decreased for the period 1969 to 1995 even though the geographic size of the city increased.[70]
Risk of increased housing prices
There is also some concern that Portland-style anti-sprawl policies will increase housing prices. Some research suggests Oregon has had the largest housing affordability loss in the nation,[71] but other research shows that Portland's price increases are comparable to other Western cities.[72]
In Australia, it is claimed by some that housing affordability has hit "crisis levels" due to "urban consolidation" policies implemented by state governments.[73] In Sydney, the ratio of the price of a house relative to income is 9:1.[74] The issue has at times been debated between the major political parties.[75]
Freedom
There are some sociologists such as Durkheim who suggest there is a link between population density and the number of rules that must be imposed. The theory goes that as people are moved closer together geographically their actions are more likely to noticeably impact others around them. This potential impact requires the creation of additional social or legal rules to prevent conflict. A simple example would be as houses become closer together the acceptable maximum volume of music decreases, as it becomes intrusive to other residents.[76]
Crowding and increased aggression
Numerous studies link increased population density with increased aggression.[77] Some people believe that increased population density encourages crime and anti-social behavior. It is argued that human beings, while social animals, need significant amounts of social space or they become agitated and aggressive.[78] However, the relationship between higher densities and increased social pathology has been largely discredited.[79]
Alternative development styles
The term 'smart growth' has been particularly used in North America. The terms 'compact city' or 'urban intensification' are often used to describe similar concepts, in Europe and particularly the UK where it has influenced Government policy and planning practice in recent years.
The state of Oregon enacted a law in 1973 limiting the area urban areas could occupy, through urban growth boundaries. As a result, Portland, the state's largest urban area, has become a leader in smart growth policies that seek to make urban areas more compact (they are called urban consolidation policies). After the creation of this boundary, the population density of the urbanized area increased somewhat (from 1,135 in 1970[80] to 1,290 per km² in 2000[81]). While the growth boundary has not been tight enough to vastly increase density, the consensus is that the growth boundaries have protected great amounts of wild areas and farmland around the metro area.
Many parts of the San Francisco Bay Area have also adopted urban growth boundaries; 25 of its cities and 5 of its counties have urban growth boundaries. Many of these were adopted with the support and advocacy of Greenbelt Alliance, a non-profit land conservation and urban planning organization.
In other areas, the design principles of District Regionalism and New Urbanism have been employed to combat urban sprawl. The concept of Circular flow land use management has been developed in Europe to reduce land take by urban sprawl through promoting inner-city and brownfield development.
While cities such as Los Angeles are well known for sprawling suburbs, policies and public opinion are changing. Transit-oriented development, in which higher-density mixed-use areas are permitted or encouraged near transit stops is encouraging more compact development in certain areas-particularly those with light and heavy rail transit systems.
Bicycles are the preferred means of travel in many countries.[82] Also, bicycles are permitted in public transit. Businesses in areas of some towns where bicycle use is high are thriving. Bicycles and transit are contributing in two important ways toward the success of businesses:[83]
- First, is that on average the people living the closest to these business districts have more money to spend locally because they don't spend as much on their cars.
- Second, because these people rely more on bicycling, walking and transit than on driving, they tend to focus more of their commerce on locally owned neighborhood businesses that are convenient for them to reach.
Walkability is a measure of how friendly an area is to walking. Walkability has many health, environmental, and economic benefits. However, evaluating walkability is challenging because it requires the consideration of many subjective factors.[84] Factors influencing walkability include the presence or absence and quality of footpaths, sidewalks or other pedestrian right-of-ways, traffic and road conditions, land use patterns, building accessibility, and safety, among others.[85] Walkability is an important concept in sustainable urban design.[86]
See also
Related topics
- Compact City
- Effects of the automobile on societies
- Gentrification
- Great American Streetcar Scandal
- List of urban studies topics
- New Pedestrianism
- Principles of Intelligent Urbanism
- Rural-urban fringe
- Smart Growth
- Town centre
- Urban planning
Related terminology
- Affluenza
- Boomburb
- Commuter town
- Concentric zone model
- Conspicuous consumption
- Consumerism
- Deforestation
- Demographics
- Edge city
- Garden real estate
- Gentrification
- Global population
- Habitat fragmentation
- Induced demand
- Landscape ecology
- Location Efficient Mortgage
- Megacity
- McMansion
- Microdistrict
- Middle class
- New town
- NIMBY
- Over-consumption
- Peak oil
- Prime farmland
- Regional planning
- Rural exodus
- Simple living
- Spatial planning
- Streetcar suburb
- Suburbanisation
- Urban decay
Notes and references
- ↑ Andrew Downie (April 21, 2008). "The World's Worst Traffic Jams". Time. Retrieved September 4, 2014.
- ↑ James, Paul; Holden, Meg; Lewin, Mary; Neilson, Lyndsay; Oakley, Christine; Truter, Art; Wilmoth, David (2013). "Managing Metropolises by Negotiating Mega-Urban Growth". In Harald Mieg and Klaus Töpfer. Institutional and Social Innovation for Sustainable Urban Development. Routledge.
- ↑ Fattah, Geoffrey. "Jordan Landing's popularity ties up traffic", Deseret Morning News, Deseret News Publishing Company, October 18, 2003. Retrieved on 2008-02-08.
- ↑ 4.0 4.1 4.2 4.3 Chin, Nancy (March 2002). "Unearthing the Roots of Urban Sprawl: A Critical Analysis of Form, Function and Methodology" (PDF). University College London Centre for Advanced Spatial Analysis Working Papers Series 47. ISSN 1467-1298. Retrieved 19 April 2015.
- ↑ 5.0 5.1 5.2 5.3 Ewing, Reid (1997). "Is Los Angeles-Style Sprawl Desirable?". Journal of the American Planning Association 63 (1): 107–126. doi:10.1080/01944369708975728. Retrieved 17 April 2015.
- ↑ Gordon, Peter; Richardson, Harry (1997). "Are Compact Cities a Desirable Planning Goal?". Journal of the American Planning Association 63 (1): 95–106. doi:10.1080/01944369708975727. Retrieved 26 April 2015.
- ↑ 7.0 7.1 7.2 Frumkin, Howard (May–June 2002). Urban Sprawl and Public Health. Centers for Disease Control and Prevention. Retrieved on February 7, 2008.
- ↑ DeGrove, John and Robyne Turner (1991), "Local Government in Florida: Coping with Massive and Sustained Growth" in Huckshorn, R. (ed.) Government and Politics in Florida. University of Florida Press, Gainesville.
- ↑ Stoll, Michael A. "Job Sprawl and the Spatial Mismatch between Blacks and Jobs." Washington D.C.: Brookings Institution, Metropolitan Policy Program. 2005. http://www.brookings.edu/reports/2005/02metropolitanpolicy_stoll.aspx Retrieved January 22, 2010.
- ↑ Glaeser, Edward (2001), "Job Sprawl: Employment Location in U.S. Metropolitan Areas." Washington D.C.: Brookings Institution, Metropolitan Policy Program. 2001. http://www.brookings.edu/reports/2001/07_employment_glaeser.aspx Retrieved January 22, 2010
- ↑ Kneebone, Elizabeth. "Job Sprawl Revisited: The Changing Geography of Metropolitan Employment." Washington D.C.: Brookings Institution. 2009. http://www.brookings.edu/reports/2009/0406_job_sprawl_kneebone.aspx Accessed January 22, 2010
- ↑ David Kocieniewski (January 6, 2013). "Major Companies Push the Limits of a Tax Break". The New York Times. Retrieved January 7, 2013.
With hundreds of thousands of transactions a year, it is hard to gauge the true cost of the tax break for so-called like-kind exchanges, like those used by Cendant, General Electric and Wells Fargo.
- ↑ Duany, Andres, Elizabeth Plater-Zyberk and Jeff Speck. Suburban Nation. New York: Farrar Straus & Giroux, 2001
- ↑ Steinberg, T. (2006). American Green, The Obsessive Quest for the Perfect Lawn. W.W. Norton & Co. ISBN 0-393-06084-5.
- ↑
- ↑
- ↑ Bruegmann, Robert (2006). Sprawl: A Compact History. University of Chicago Press. p. 24. Retrieved November 9, 2013.
- ↑ "Suburban Despair".
- ↑ Edwards, Dennis; Pigram, Ron (1988). The Golden Years of the Metropolitan Railway and the Metro-land Dream. Bloomsbury. p. 32. ISBN 1-870630-11-4.
- ↑ Jackson 1986, p. 134.
- ↑ Jackson 1986, pp. 134, 137.
- ↑ 22.0 22.1 Green 1987, p. 43.
- ↑ Jackson 1986, pp. 241–242.
- ↑ "Planning Policy Guidance 2: Green belts" (PDF).
- ↑ Kolakowski, K., P. L. Machemer, J. Thomas, and R. Hamlin. 2000. Urban growth boundaries: a policy brief for the Michigan Legislature. Urban and Regional Planning Program, Department of Geography, Michigan State University, Lansing, Michigan, USA. Available online at: http://www.ippsr.msu.edu/Publications/ARUrbanGrowthBound.pdf
- ↑ Lubowski, Ruben N.; Marlow Vesterby, Shawn Bucholtz, Alba Baez, and Michael J. Roberts (May 31, 2006). Major Uses of Land in the United States, 2002. Economic Research Service, . Retrieved on 2008-02-07.
- ↑ USA Urbanized Areas: 2000 Ranked by Population. Demographia, August 25, 2002. Retrieved on 2008-02-08.
- ↑ High-Income World Central City Population Losses. Demographia. Retrieved on February 8, 2008.
- ↑ "Growth in Urban Population Outpaces Rest of Nation, Census Bureau Reports". US Census. Retrieved October 20, 2013.
- ↑ Monkkonen, Paavo (2011). "Do Mexican Cities Sprawl? Housing Finance Reform and Changing Patterns of Urban Growth". Urban Geography 32 (3): 406–423. doi:10.2747/0272-3638.32.3.406.
- ↑ "Environmental Health Committee. Report on Public Health and Urban Sprawl in Ontario: A Review of the Pertinent Literature"> Ontario College of Family Physicians, (2005). [ProQuest ebrary. Web.] 26 October 2014.
- ↑ "Environmental Health Committee. Report on Public Health and Urban Sprawl in Ontario: A Review of the Pertinent Literature"> Ontario College of Family Physicians, (2005). [ProQuest ebrary. Web.] 26 October 2014.
- ↑ Environmental Health Committee. Report on Public Health and Urban Sprawl in Ontario: A Review of the Pertinent Literature. Toronto, ON, CAN: Ontario College of Family Physicians, 2005. ProQuest ebrary. Web. 15 October 2014.
- ↑ Koen De Ridder, Filip Lefebre, Stefan Adriaensen, Ute Arnold, Wolfgang Beckroege, Christine Bronner, Ole Damsgaard, Ivo Dostal, Jiri Dufek, Jacky Hirsch, Luc Int Panis, Zdenek Kotek, Thierry Ramadier, Annette Thierry, Stijn Vermoote, Annett Wania, Christiane Weber (2008). "Simulating the impact of urban sprawl on air quality and population exposure in the German Ruhr area. Part II: Development and evaluation of an urban growth scenario". Atmospheric Environment 42 (30): 7070–7077. doi:10.1016/j.atmosenv.2008.06.044.
- ↑ Fuller, R.; Crawford (2011). Impact of past and future residential housing development patterns on energy demand and related emissions, Journal of Housing and the Built Environment 26 (2): 165–83. Missing or empty
|title=(help) - ↑ Trewe, Marti. (October 1, 2012) America's top 50 most population dense cities. AGBeat. Retrieved on 2013-12-06.
- ↑ De Ridder, K (2008). "Simulating the impact of urban sprawl on air quality and population exposure in the German Ruhr area. Part_II_Development_and_evaluation_of_an_urban_growth_scenario". Atmospheric Environment 42 (30): 7070–7077. doi:10.1016/j.atmosenv.2008.06.044.
- ↑ U.S. Death Statistics. The Disaster Center. Retrieved on February 8, 2008.
- ↑ Elements of Smart Growth: Health. Smart Growth America. Retrieved on August 8, 2008.
- ↑ "Ex-Urban Sprawl as a Factor in Traffic Fatalities and EMS Response Times in the Southeastern United States,” Thomas E. Lambert and Peter B. Meyer. Journal of Economic Issues, Vol. 40, No. 4, December 2006, pages 941-953
- ↑ Lambert, T. E.; Meyer, P. B. (2008). "Practitioner's Corner: New and Fringe Residential Development and Emergency Medical Services Response Times in the United States". State 40 (2): 115–124. doi:10.2307/25469783. JSTOR 25469783.
- ↑ "Ex-urban Sprawl and Fire Response in the United States," Thomas E. Lambert, Arun K. Srinivasan, and Matin Katirai. "Journal of Economic Issues", Vol 46, No. 4, December 2012.
- ↑ McKee, Bradford. "As Suburbs Grow, So Do Waistlines", The New York Times, September 4, 2003. Retrieved on February 7, 2008.
- ↑ Measuring the Health Effects of Sprawl, A National Analysis of Physical Activity, Obesity and Chronic Disease 2003
- ↑ Van Pelt, Julie (ed.) (2006). Cascadia Scorecard 2006 (PDF). Cascadia Scorecard. Seattle, Washington: Sightline Institute. ISBN 1-886093-16-4. Retrieved February 7, 2008.
- ↑ http://www.smartcommunities.ncat.org/articles/sprawl.pdf
- ↑ McCann, Barbara. Driven to Spend. Surface Transportation Policy Project (2000). Retrieved on February 8, 2008.
- ↑ "Is your car worth it?", The Guardian, Guardian Media Group, February 15, 2003. Retrieved on February 8, 2008.
- ↑ "Average earnings rise by 1.4% to £26,500, says ONS". November 22, 2013. Retrieved January 14, 2013.
- ↑ http://www.rprudhomme.com/resources/2005.+EU+Pol+in+Perspective+$28Bxl$29.pdf
- ↑ Newman & Kenworth 1989, Andrew White Associates, DETR
- ↑ Ray, Brian. "The Role of Cities in Immigrant Integration", Migration Information Source, October 2003. Retrieved on February 8, 2008.
- ↑ Cincinnati Challenge to Sprawl Campaign. Sierra Club. Retrieved on February 8, 2008.
- ↑ "Every Place Has a Ghetto...": The Significance of Whites' Social and Residential Segregation Eduardo Bonilla-Silva and David G. Embrick Symbolic Interaction Summer 2007, Vol. 30, No. 3, Pages 323-345
- ↑ Issue Brief: Smart-Growth: Building Livable Communities. American Institute of Architects. Retrieved on February 8, 2008.
- ↑ Building Better. Sierra Club. Retrieved on February 8, 2008.
- ↑ Smart Growth. National Resources Defense Council. Retrieved on February 8, 2008.
- ↑ Urban Sprawl - NumbersUSA. Retrieved on February 26, 2009.
- ↑ Web smarts. Christian Science Monitor. October 7, 2003. Retrieved on February 26, 2009.
- ↑ " Urban Sprawl A comprehensive Reference Guide "> Seoule David (2006). .
- ↑ Randal O'Toole "Gridlock"
- ↑ 62.0 62.1 62.2 Moore, Adrian; Rick Henderson (June 1998). "Plan Obsolescence", Reason Magazine. Retrieved on February 7, 2008.
- ↑ Cities and Automobile Dependence: An International Sourcebook, Newman P and Kenworthy J, Gower, Aldershot, 1989.
- ↑ MINDALI, O., RAVEH, A. and SALOMON, I., 2004. Urban density and energy consumption: a new look at old statistics. Transportation Research Part A: Policy and Practice, 38(2), pp. 143-162.
- ↑ e.g. FRANK, L. and PIVOT, G., 1994. Impact of Mixed Use and Density on Three Modes of Travel. Transportation Research Record, 1446, pp. 44-52.
- ↑ Transport Reviews Volume 29 Issue 3 (2009) was entirely devoted to this issue
- ↑ e.g. Bagley, M.N. and Mokhtarian, P.L. (2002) The impact of residential neighborhood type on travel behavior: A structural equations modeling approach. Annals of Regional Science36 (2), 279.
- ↑ e.g.Handy, S., Cao, X. and Mokhtarian, P.L. (2005) Correlation or causality between the built environment and travel behavior? Evidence from Northern California. Transportation Research Part D: Transport and Environment10 (6), 427-444.
- ↑ Melia, S., Barton, H. and Parkhurst, G. (In Press) The Paradox of Intensification. Transport Policy 18 (1)
- ↑ US Commuting Travel Times Down Over Quarter Century. PublicPurpose.com. Retrieved on February 8, 2008.
- ↑ Housing Affordability Trends: USA States. Demographia. Retrieved on February 8, 2008.
- ↑ Lewyn, Michael (October 4, 2005). Sprawl, Growth Boundaries and the Rehnquist Court. Social Science Research Network. Retrieved on 2008-02-08.
- ↑ "Seeking solutions to the housing affordability crisis", University of South Australia, October 24, 2005. Retrieved on 2008-02-08.
- ↑ Saunders, Peter (2005). "After the House Price Boom: Is this the end of the Australian dream?", Policy. Retrieved on February 8, 2008.
- ↑ Archer, Lincoln. "Kevin Rudd says John Howard is ignoring housing", News Limited, November 5, 2007. Retrieved on 2008-02-08.
- ↑ Unnever, James D. On Durkheim. Retrieved on February 8, 2008.
- ↑ Conklin, George H. "Article Review: The Impact of Density: The Importance of Nonlinearlity and Selection on Flight and Fight Responses.".
- ↑ Sennett, Richard (ed.) (June 1969). Classic Essays on the Culture of Cities. New York: Appleton-Century-Crofts. pp. 67–83.
- ↑ Fischer, Claude S., Mark Baldasarre, and R. J. Ofshe. 1975. "Crowding Studies and Urban Life - A Critical Review." Journal of the American Institute of Planners 41(6): 406-418.
- ↑ USA Urbanized Areas 1950-1990
- ↑ USA Urbanized Areas 2000
- ↑ "Bicycles produced this year". Retrieved January 14, 2013.
- ↑ columbus-ite Resources and Information. This website is for sale!. columbus-ite.com. Retrieved on December 6, 2013.
- ↑ S. Reid, "Fit for purpose: evaluating walkability", Engineering Sustainability, Vol. 161, No. 2, June 2008, pp.105-112.
- ↑ Online TDM Encyclopedia chapter on pedestrian improvements
- ↑ S. Grignaffini, S. Cappellanti, A. Cefalo, "Visualizing sustainability in urban conditions", WIT Transactions on Ecology and the Environment, Vol. 1, pp. 253-262, 10 Jun 2008.
Bibliography
- Baudrillard, Jean (1983). Simulacra and Simulation.
- Crawford, Margaret (1992) "The World in a Shopping Mall" in Sorkin, Michael (ed.), Variations on a Theme Park, The new American city and the end of public space, Hill and Wang, New York, pp. 3–30.
- Davies, Ross (1960). Retail Planning Policies in Western Europe. Routledge.
- DeGrove, John and Robyne Turner (1991) "Local Government in Florida: Coping with Massive and Sustained Growth" in Huckshorn, R. (ed.) Government and Politics in Florida, University of Florida Press, Gainesville.
- Duany, Andrés; Plater-Zyberk, Elizabeth (2000). Suburban Nation: The rise of sprawl and the decline of the American Dream. New York: North Point Press.
- Frieden, Bernard J. and Sagalyn, Lynne B. (1989) Downtown Inc.: How America Rebuilds Cities, MIT Press, Cambridge, MA.
- Gruen, Victor and Larry Smith (1960) Shopping towns USA: the planning of shopping centers, Van Nostrand Reinhold Company, New York.
- Hirschhorn, Joel S. (2005), Sprawl Kills - How Blandburbs Steal Your Time, Health, and Money. New York: Sterling & Ross. ISBN 0-9766372-0-0
- Jameson, Fredric (1990). Postmodernism or the cultural logic of late capitalism.
- James, Paul; Holden, Meg; Lewin, Mary; Neilson, Lyndsay; Oakley, Christine; Truter, Art; Wilmoth, David (2013). "Managing Metropolises by Negotiating Mega-Urban Growth". In Harald Mieg and Klaus Töpfer. Institutional and Social Innovation for Sustainable Urban Development. Routledge.
- Koolhaas, Rem (2003). Junkspace, Harvard Design School Guide to Shopping. Harvard Press.
- Schlosser, Eric (2002). Fast Food Nation: The Dark Side of the All-American Meal. Houghton Mifflin Company.
- Stein, Jay (1993). Growth Management: The planning challenge of the 1990s. Sage Publications.
- Ingersoll, Richard, "Sprawltown: Looking for the City on Its Edges". Princeton Architectural Press, 2006. ISBN 9781568985664
- Jackson, Kenneth T. (1985). Crabgrass Frontier: The Suburbanization of the United States. New York: Oxford University Press. ISBN 0-19-504983-7.
- Bruegmann, Robert. Sprawl: A Compact History. Chicago: University of Chicago Press, 2005. ISBN 0-226-07691-1
- Garreau, Joel, "Edge City: life on the new frontier". New York, Anchor Books, 1991.
- Gielen, Tristan. Coping with compaction; the demon of sprawl. Auckland, Random House New Zealand, 2006.
- Hayden, Dolores. "A Field Guide to Sprawl". New York, W. W. Norton & Co., 2004.
- Lewinnek, Elaine. The Working Man's Reward: Chicago's Early Suburbs and the Roots of American Sprawl. Oxford, England: Oxford University Press, 2014.
- Rybczynski, Witold (November 7, 2005). "Suburban Despair". Slate.
- Vicino, Thomas, J. Transforming Race and Class in Suburbia: Decline in Metropolitan Baltimore. New York: Palgrave Macmillan, 2008.
- Winkler, Robert. Going Wild: Adventures with Birds in the Suburban Wilderness. Washington, D.C.: National Geographic, 2003.
- Jackson, Kenneth T. (1985). Crabgrass Frontier: The Suburbanization of the United States. New York: Oxford University Press. ISBN 0-19-504983-7.
- Jacobs, Jane. The Death and Life of Great American Cities
- Edge City: Life on the New Frontier by Garreau, Joel, Anchor Books/Doubleday New York.
- Fast Food Nation by Eric Schlosser
- The Future of Success: Working and Living in the New Economy by Robert Reich
- The Geography of Nowhere: The rise and decline of America's man-made landscape (ISBN 0-671-70774-4) by James Howard Kunstler
- The Old Neighborhood: What we lost in the great suburban migration: 1966-1999 by Ray Suarez
- A Field Guide to Sprawl by Dolores Hayden and Jim Wark, ISBN 0-393-73125-1, W. W. Norton & Company.
- Radiant City, is a 2006 National Film Board of Canada documentary on suburban sprawl
- Sprawl: A Compact History by Robert Bruegmann, University of Chicago Press, hardcover, 301 pages, ISBN 0-226-07690-3
- "Sprawl Kills - How Blandburbs Steal Your Time, Health and Money," by Joel S. Hirschhorn
- Suburban Nation: The rise of sprawl and the decline of the American Dream (ISBN 0-86547-606-3) by A. Duany, E. Plater-Zyberk, and Jeff Speck
- Seoule D,C.(2006) Urban Sprawl A comprehensive Reference Guide. Retrieved from https://encrypted.google.com/books?id=XJfql9Xjq-wC&printsec=frontcover&source=gbs_ViewAPI#v=onepage&q&f=false
- Baumeister, M (2012)Managing Urban Sprawl:Reconsidering Development Cost Charges in Canada Retrieved from http://celarc.ca.ezproxy.library.yorku.ca/cppc/231/231288.pdf
- Squires G, D. (2002) Urban Sprawl: Causes Consequences & Policy response. Retrieved from https://encrypted.google.com/books?id=1s0URQ6sYyIC&printsec=frontcover&source=gbs_ViewAPI#v=onepage&q&f=false
- Onatrio College of Family Physicians. (2005) Report on Public Health and Urban Sprawl in Ontario: A Review of Pertinent Literature. Retrieved From http://site.ebrary.com.ezproxy.library.yorku.ca/lib/oculyork/reader.action?docID=10434269&ppg=5
- Freilich R,H et al (2010) From Sprawl to Sustainability, Smart Growth, New Urbanism, Green Development and Renewable Energy. Retrieved from https://encrypted.google.com/books?id=2hET5BF4jDYC&printsec=frontcover&source=gbs_ViewAPI#v=onepage&q&f=false
- Reid Ewing (1997) Is Los Angeles-Style Sprawl Desirable?, Journal of the American Planning Association, 63:1, 107-126, DOI: 10.1080/01944369708975728