United States presidential election in Wyoming, 2012
| | |||||||||||||||||||||||||||||||||||||||
| |||||||||||||||||||||||||||||||||||||||
| |||||||||||||||||||||||||||||||||||||||
|
| |||||||||||||||||||||||||||||||||||||||
| County Results
Obama—50-60%
Romney—<50%
Romney—60-70%
Romney—70-80%
Romney—80-90% | |||||||||||||||||||||||||||||||||||||||
| |||||||||||||||||||||||||||||||||||||||


| Democratic Party |
|---|
| Republican Party |
| Minor parties |
|
| Elections in Wyoming | |||||||||
|---|---|---|---|---|---|---|---|---|---|
 | |||||||||
|
The 2012 United States presidential election in Wyoming took place on November 6, 2012 as part of the 2012 General Election in which all 50 states plus The District of Columbia participated. Wyoming voters chose three electors to represent them in the Electoral College via a popular vote pitting incumbent Democratic President Barack Obama and his running mate, Vice President Joe Biden, against Republican challenger and former Massachusetts Governor Mitt Romney and his running mate, Congressman Paul Ryan.
Romney carried the state with 68.64% to Obama's 27.82%, with Libertarian Gary Johnson taking 2.14%.
General Election
Results
| United States presidential election in Wyoming, 2012[1] | ||||||
|---|---|---|---|---|---|---|
| Party | Candidate | Running mate | Votes | Percentage | Electoral votes | |
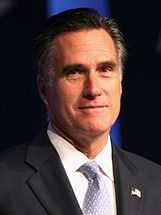
| Republican | Mitt Romney | Paul Ryan | 170,962 | 68.64% | 3 | |
| Democratic | Barack Obama | Joe Biden | 69,286 | 27.82% | 0 | |
| Libertarian | Gary Johnson | Jim Gray | 5,326 | 2.14% | 0 | |
| Write-Ins | Write-Ins | 2,035 | 0.82% | 0 | ||
| Constitution | Virgil Goode | Jim Clymer | 1,452 | 0.58% | 0 | |
| Totals | 249,061 | 100.00% | 3 | |||
Democratic caucuses
[Data unknown/missing. You can help!]
Republican caucuses
| | |||||||||||||||||||||||||||||||||||||||||||||||||||||||||||||||||||
| |||||||||||||||||||||||||||||||||||||||||||||||||||||||||||||||||||
| |||||||||||||||||||||||||||||||||||||||||||||||||||||||||||||||||||
|
| |||||||||||||||||||||||||||||||||||||||||||||||||||||||||||||||||||
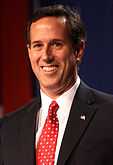
| Rick Santorum (10)
Mitt Romney (8)
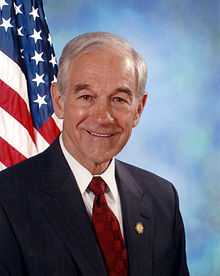
Ron Paul (5) | |||||||||||||||||||||||||||||||||||||||||||||||||||||||||||||||||||


The Republican caucuses took place between Saturday, February 11 and Wednesday, February 29, 2012. The county conventions were held March 6-10, 2012.[2] The results of the conventions were reported on Saturday, March 10, 2012, the same day on which the Guam, Kansas, and Virgin Islands caucuses were held. After narrowly beating Santorum during the precinct caucuses in February, Romney went on to win the county conventions decisively.[3]
The caucuses took place over a number of days to accommodate the state's geographic size and sparse population, particularly ranchers in the midst of calving season. The entire process of nominating Wyoming's delegates lasts from February until April.[4]
Results
The precinct caucuses that took place from February 11 to February 29 are the only stage of the delegate selection process in which every registered Wyoming Republican is eligible to participate.[5] The result of the straw polls taken at these caucuses are:
| Wyoming Republican caucuses (straw poll), 2012[6] | ||||
|---|---|---|---|---|
| Candidate | Votes | Percentage | Delegates (non-binding) [2] |
Delegates (bound) [2] |
| 822 | 38.99% | 11 | 8 | |
| Rick Santorum | 673 | 31.93% | 8 | 2 |
| Ron Paul | 439 | 20.83% | 6 | 1 |
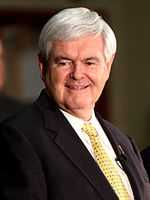
| Newt Gingrich | 165 | 7.83% | 2 | 0 |
| Others | 9 | 0.43% | 0 | |
| Uncommitted | 1 | |||
| Unpledged | 2 | 17 | ||
| Total: | 2,108 | 100.00% | 29 | 29 |
Convention
Delegates were chosen at county conventions on March 6-10 and the state convention on April 12-14.
| Convention Results[7][8] | |||||
|---|---|---|---|---|---|
| Candidate | County Conventions |
State | Party leaders |
Total | |
| 8 | 14 | 0 | 22 | ||
| Rick Santorum | 2 | 0 | 0 | 2 | |
| Ron Paul | 1 | 0 | 0 | 1 | |
| Unknown | 1 | 0 | 3 | 4 | |
| Total | 12 | 14 | 3 | 29 | |
See also
- Republican Party presidential debates, 2012
- Republican Party presidential primaries, 2012
- Results of the 2012 Republican Party presidential primaries
References
- ↑ "Wyoming Secretary of State" (PDF). Retrieved 2012-12-08.
- ↑ 2.0 2.1 2.2 The Green Papers "Wyoming Republican". greenpapers.com. Retrieved 29 February 2012.
- ↑ Romney wins Wyoming, AP reports. CBS News. 2012-03-10. Accessed 2012-03-11.
- ↑ Beck, Bob. "Wyoming's GOP Caucuses: The Process Is Drawn Out And Confusing". It's All Politics. NPR. Retrieved 1 March 2012.
- ↑ "Romney Wins Wyoming". Retrieved 1 March 2012.
- ↑ http://wygop.org/2012-straw-poll-results/
- ↑ http://www.thegreenpapers.com/P12/WY-R
- ↑ https://twitter.com/#!/meadgruver/status/191310824550305792
External links
- The Green Papers: for Wyoming
- The Green Papers: Major state elections in chronological order
| ||||||||||||||
| ||||||||||||||||||||||||||||||||||||||||||||||||||||||||||||||||||||||||||||||||||||||||||||||||||||||||||||||
| ||||||||||||||||||||||||||||||||||||||||||||||