United States presidential election, 1880
| | |||||||||||||||||||||||||||||||||||||||||||
| |||||||||||||||||||||||||||||||||||||||||||
| |||||||||||||||||||||||||||||||||||||||||||
|
| |||||||||||||||||||||||||||||||||||||||||||
| Presidential election results map. Blue denotes states won by Hancock/English, Red denotes those won by Garfield/Arthur. Numbers indicate the number of electoral votes allotted to each state. | |||||||||||||||||||||||||||||||||||||||||||
| |||||||||||||||||||||||||||||||||||||||||||


The United States presidential election of 1880 was the 24th quadrennial presidential election, held on Tuesday, November 2, 1880. It was largely seen as a referendum on the end of Reconstruction in Southern states carried out by the Republicans. There were no other pressing issues of the day except for tariff policy, with the Republicans supporting higher tariffs and the Democrats supporting lower ones.
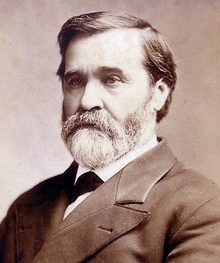
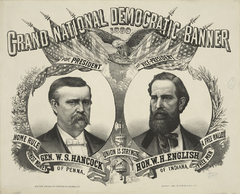
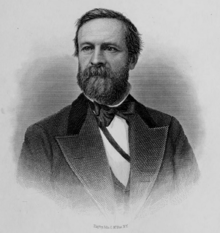
Incumbent President Rutherford B. Hayes did not seek re-election, keeping a promise made during the 1876 campaign. The Republican Party eventually chose another Ohioan, James A. Garfield, as their standard-bearer. The Democratic Party meanwhile chose Civil War General Winfield Scott Hancock as their nominee.
With the Republicans' sixth consecutive victory in a presidential election, the 1880 election marked the longest winning streak in the history of the Republican Party, and the second-longest winning streak overall (behind the Democratic-Republicans' seven consecutive victories from 1800 to 1824). Despite capturing fewer than 10,000 more popular votes than Hancock, Garfield was easily elected with 214 of the 369 electoral votes available. It is to date the smallest popular vote victory in American history. This election is also notable as marking the only occasion thus far in which a sitting Representative, Garfield, was elected as President of the United States.
Nominations
Republican Party nomination
Republican candidates:
-
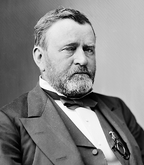
Former President
Ulysses S. Grant
of Illinois -

Secretary of the Treasury
John Sherman
of Ohio


While President Hayes did not seek re-nomination, former President Ulysses S. Grant, who served between 1869 and 1877, openly sought nomination to a third term. He was indeed the front-runner going into the Republican Party convention in Chicago held on June 2–8. However given the number of delegates the opposition had managed to amass, his nomination depended on the adoption of the unit-rule, which forced the delegates of a state to cast their vote for the candidate who was supported by the majority of the state's delegates. If this had been adopted, Grant would have likely won at least 362 votes on the first ballot, 17 short of winning the nomination, and would have almost certainly carried it either through switches on the first ballot, or as the result of the second. However, the defeat of the unit-rule crippled Grant's candidacy as now, in order to attain the necessary majority, they would have had to attain support from delegates hostile to him.
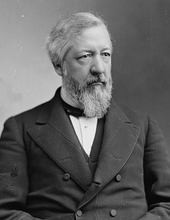
Grant's opponents were divided among a number of other candidates, including James G. Blaine of Maine and Ohio's John Sherman. James A. Garfield, who was representing the Ohio delegation, gave a major speech in support of Sherman, but soon found himself among those receiving delegate votes. On the 36th ballot, Garfield garnered 399 delegate votes, surpassing Grant (who had 306), Blaine (42), and Sherman to win the nomination. After Levi P. Morton backed out of the nomination to avoid a dispute, Chester A. Arthur (a close friend to powerful New York Senator Roscoe Conkling) was subsequently chosen as Garfield's running mate by a large margin over Elihu B. Washburne. The convention is noteworthy as it was the first at which delegates cast votes for an African-American, Blanche Bruce. This convention took more ballots to choose its party's nominee for president than any other Republican convention.
Democratic Party nomination
-
Major General
Winfield Scott Hancock
of Pennsylvania -

Representative
Henry B. Payne
of Ohio
(Not Formally Nominated) -

Former Governor
Samuel J. Tilden
of New York
(Withdrew Before 2nd Ballot) -

Associate Justice
Stephen J. Field
of California


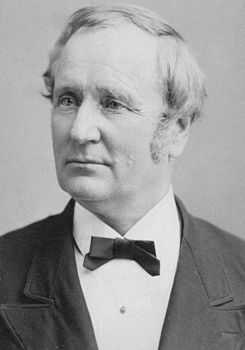
At the Democratic national convention in Cincinnati on June 22–24, 1880, Winfield Scott Hancock emerged as the leading candidate after Samuel J. Tilden of New York withdrew his name from consideration.
The Pennsylvanian who nominated Hancock said, "I present to the Convention one who on the battlefield was styled 'the superb,' yet whose first act when in command of Louisiana and Texas was to salute the Constitution by proclaiming that, 'the military rule shall ever be subservient to the civil power.' I nominated one whose name will suppress all faction and thrill the republic."[2]
On the first ballot, Hancock led with 171 votes to 153.5 for Thomas F. Bayard of Delaware, 81 for Henry B. Payne of Ohio, 68.5 for Allen G. Thurman of Ohio, 65 for Stephen J. Field of California, 62 for William R. Morrison of Illinois, 49.5 for Thomas A. Hendricks of Indiana, and the rest scattered. On the next ballot, Tilden supporters pushed Samuel J. Randall of Pennsylvania to second place with 128.5 votes, but Hancock held such a commanding lead with 320 votes that masses of delegates bolted to him before the second ballot was recorded, giving him 705 votes and the nomination.
The motion to have Hancock's nomination be declared unanimous was carried unanimously.[3]
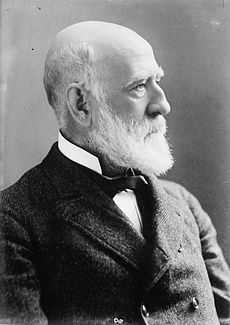
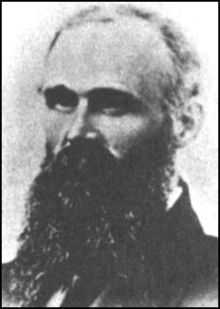
William Hayden English, an anti-Greenback Indiana banker, was unanimously declared the candidate for vice-president without a formal ballot after the name of Richard M. Bishop was withdrawn from consideration.[4] Historian Emma Lou Thornbrough suggests that, following the uncontested nomination of English as the vice-presidential candidate, the Democratic infatuation with the money question in Indiana ceased and "a political era had ended."[5]
Greenback Party nomination
-

Representative
Hendrick B. Wright
of Pennsylvania -

Lawyer[1]
Stephen D. Dillaye
of New Jersey -
Former Representative
Benjamin F. Butler
of Massachusetts -

Publisher
Solon Chase
of Maine -
Industrialist
Edward P. Allis
of Wisconsin -

Representative
Thompson H. Murch
of Maine
(Declined to be Nominated)


Dissatisfied with the fiscal policies of both parties, the Greenback Party, a minor force in the 1876 election, returned with James B. Weaver as its presidential nominee and Barzillai J. Chambers as his running mate.
| Presidential Ballot | Vice-Presidential Ballot | |||
| Ballot | 1st (Before Shifts) | 1st (After Shifts) | 1st | |
|---|---|---|---|---|
| James B. Weaver | 224.5 | 718 | Barzillai J. Chambers | 403 |
| Hendrick B. Wright | 126.5 | - | Absolom M. West | 311 |
| Stephen D. Dillaye | 119 | - | ||
| Benjamin F. Butler | 95 | - | ||
| Solon Chase | 89 | - | ||
| Edward P. Allis | 41 | - | ||
| Alexander Campbell | 21 | - | ||
Prohibition Party nomination

At the 3rd Prohibition Party National Convention, 142 delegates nominated Neal Dow for president by acclamation. Henry Adams Thompson was nominated for vice-president.
Just before the national election, major national newspapers reported incorrectly that Dow was dropping out of the race and endorsing Garfield. It is thought that these reports resulted in Dow's poor showing (he won only 9,674 votes).[6]
American Party nomination
The distrust of the Masonic movement had led to the creation of a new nativist political party that revived the old name of the American Party. Former Civil War general John W. Phelps, the head of the Vermont Anti-Masonic movement, was nominated for president and former Kansas senator Samuel C. Pomeroy was nominated for vice-president.
General election
Campaign


Democrats began by attacking the contested 1876 election, with Republicans bringing up the Civil War again, but the campaign soon shifted to personality. Garfield campaigned as a hard-working, self-made man. Republicans avoided direct attacks on Hancock, who was widely respected for his service at Gettysburg, but claimed that the general would act as a figurehead for corrupt Democrats, like the ones who tried to defame Garfield with the Morey letter.[7] The Democrats campaigned on Republican corruption, attacking Garfield and especially his running mate Arthur.
The end of the effects of the Panic of 1873 combined with a well-funded and well-run campaign gave the advantage to Garfield.
Results
Of the 2,320 counties/independent cities making returns, Hancock won in 1,242 (53.53%) while Garfield carried 1,061 (45.73%). In Virginia, nine counties (0.39%) recorded more votes cast for the "Readjuster Democratic" ticket than either of the two-party candidates. Six counties (0.26%) spread across four states recorded a Weaver victory while one county (0.04%) in Arkansas recorded more votes cast for "Scattering" (Non-Democratic/Non-Republican/Non-Greenback-Labor). One county (0.04%) in Indiana split evenly between Hancock and Garfield.
Two Democratic Electoral Tickets were nominated, one by the debt-paying, the other by the "Readjuster" or anti-debt paying faction of the party in Virginia. The "Readjuster" ticket carried 9 counties and received 31,527 votes for 14.89% of the vote.[8]
The merger with the Socialist Labor had broadened the Greenback base. Even though Weaver failed to capture a single electoral vote in this election, the Greenback Labor Party won 6 counties in Iowa (Weaver's home state), Texas (Chambers' home state), Missouri, and Mississippi.
The popular vote at the county level shows that the Democratic Party had a county-level base in the Republican North, Midwest, and West. The Hancock-led Democrats won far more counties (53.5%) than the victorious Republican Party (45.7%). Thus, the Republican Party, even after the Compromise of 1877, had a county base in the South, but it was a much smaller presence than the one that the Democratic Party had in the North. It had dwindled since the 1876 election, particularly in South Carolina.
From the analysis of the county-level map data, there are several major indicators. The Democratic Party at the count level was multi-regional, while the Republican Party was essentially uni-regional, with scattered support in other regions. The Democrats' county-level victories seem to have come from sparsely populated counties, the Republicans' in more densely populated counties.[9] This would explain Hancock's narrow popular vote loss to Garfield despite carrying many more counties.
Although Hancock lost the popular vote, "The Hero of Gettysburg" did carry Adams County, Pennsylvania, with 53.9% of the vote.
To date, this was the closest election ever in terms of popular vote (with a margin of fewer than 10,000) and states carried, as both candidates won 19 states. This election also makes the first (and as of 2014 the only) election in which the two main candidates won the same number of states.
| Presidential candidate | Party | Home state | Popular vote | Electoral vote |
Running mate | |||
|---|---|---|---|---|---|---|---|---|
| Count | Pct | Vice-presidential candidate | Home state | Elect. vote | ||||
| James A. Garfield | Republican | Ohio | 4,453,337 | 48.31% | 214(b) | Chester A. Arthur | New York | 214(b) |
| Winfield Scott Hancock | Democratic | Pennsylvania | 4,444,267 | 48.22% | 155(a) | William Hayden English | Indiana | 155(a) |
| James B. Weaver | Greenback | Iowa | 306,135 | 3.32% | 0 | Benjamin J. Chambers | Texas | 0 |
| Neal S. Dow | Prohibition | Maine | 10,269 | 0.11% | 0 | Henry Adams Thompson | Ohio | 0 |
| John W. Phelps | American | Vermont | 631 | 0.01% | 0 | Samuel C. Pomeroy | Kansas | 0 |
| Other | 2,771 | 0.03% | — | Other | — | |||
| Total | 9,217,410 | 100% | 369 | 369 | ||||
| Needed to win | 185 | 185 | ||||||
Source (Popular Vote): Leip, David. 1880 Presidential Election Results. Dave Leip's Atlas of U.S. Presidential Elections (July 27, 2005).
Source (Electoral Vote): Electoral College Box Scores 1789–1996. Official website of the National Archives. (July 31, 2005).
(a) See "Georgia's vote" below.
(b) See "California's vote" below.
-

Results by county, shaded according to winning candidate's percentage of the vote
Results by state
[10]
As of 2012, this is the second and last election where the two leading candidates each carried half of the states. It had previously happened in 1848.
| States won by Garfield/Arthur |
| States won by Hancock/English |
| James Garfield Republican |
Winfield Hancock Democratic |
James Weaver Greenback |
Neal Dow Prohibition |
Margin | State Total | ||||||||||||
|---|---|---|---|---|---|---|---|---|---|---|---|---|---|---|---|---|---|
| State | electoral votes |
# | % | electoral votes |
# | % | electoral votes |
# | % | electoral votes |
# | % | electoral votes |
# | % | # | |
| Alabama | 10 | 56,350 | 37.10 | - | 91,130 | 59.99 | 10 | 4,422 | 2.91 | - | - | - | - | -34,780 | -22.90 | 151,902 | AL |
| Arkansas | 6 | 41,661 | 38.66 | - | 60,489 | 56.13 | 6 | 4,079 | 3.78 | - | - | - | - | -18,828 | -17.47 | 107,772 | AR |
| California | 6 | 80,282 | 48.89 | 1 | 80,426 | 48.98 | 5 | 3,381 | 2.06 | - | 54 | 0.03 | - | -144 | -0.09 | 164,218 | CA |
| Colorado | 3 | 27,450 | 51.26 | 3 | 24,647 | 46.03 | - | 1,435 | 2.68 | - | - | - | - | 2,803 | 5.23 | 53,546 | CO |
| Connecticut | 6 | 67,071 | 50.51 | 6 | 64,411 | 48.50 | - | 868 | 0.65 | - | 409 | 0.31 | - | 2,660 | 2.00 | 132,798 | CT |
| Delaware | 3 | 14,148 | 48.03 | - | 15,181 | 51.53 | 3 | 129 | 0.44 | - | - | - | - | -1,033 | -3.51 | 29,458 | DE |
| Florida | 4 | 23,654 | 45.83 | - | 27,964 | 54.17 | 4 | - | - | - | - | - | - | -4,310 | -8.35 | 51,618 | FL |
| Georgia | 11 | 54,470 | 34.59 | - | 102,981 | 65.41 | 11 | - | - | - | - | - | - | -48,511 | -30.81 | 157,451 | GA |
| Illinois | 21 | 318,036 | 51.11 | 21 | 277,321 | 44.56 | - | 26,358 | 4.24 | - | 440 | 0.07 | - | 40,715 | 6.54 | 622,305 | IL |
| Indiana | 15 | 232,164 | 49.33 | 15 | 225,522 | 47.91 | - | 12,986 | 2.76 | - | - | - | - | 6,642 | 1.41 | 470,672 | IN |
| Iowa | 11 | 183,904 | 56.99 | 11 | 105,845 | 32.80 | - | 32,327 | 10.02 | - | 592 | 0.18 | - | 78,059 | 24.19 | 322,668 | IA |
| Kansas | 5 | 121,549 | 60.40 | 5 | 59,801 | 29.72 | - | 19,851 | 9.86 | - | 10 | 0.00 | - | 61,748 | 30.68 | 201,236 | KS |
| Kentucky | 12 | 106,490 | 39.87 | - | 148,875 | 55.74 | 12 | 11,506 | 4.31 | - | 233 | 0.09 | - | -42,385 | -15.87 | 267,104 | KY |
| Louisiana | 8 | 38,978 | 37.31 | - | 65,047 | 62.27 | 8 | 437 | 0.42 | - | - | - | - | -26,069 | -24.96 | 104,462 | LA |
| Maine | 7 | 74,052 | 51.46 | 7 | 65,211 | 45.32 | - | 4,409 | 3.06 | - | 92 | 0.06 | - | 8,841 | 6.14 | 143,903 | ME |
| Maryland | 8 | 78,515 | 45.59 | - | 93,706 | 54.41 | 8 | - | - | - | - | - | - | -15,191 | -8.82 | 172,221 | MD |
| Massachusetts | 13 | 165,198 | 58.53 | 13 | 111,720 | 39.58 | - | 4,548 | 1.61 | - | 682 | 0.24 | - | 53,478 | 18.95 | 282,265 | MA |
| Michigan | 11 | 185,335 | 52.49 | 11 | 131,597 | 37.27 | - | 34,895 | 9.88 | - | 940 | 0.27 | - | 53,738 | 15.22 | 353,079 | MI |
| Minnesota | 5 | 93,902 | 62.28 | 5 | 53,315 | 35.36 | - | 3,267 | 2.17 | - | 286 | 0.19 | - | 40,587 | 26.92 | 150,770 | MN |
| Mississippi | 8 | 34,844 | 29.76 | - | 75,750 | 64.71 | 8 | 5,797 | 4.95 | - | - | - | - | -40,906 | -34.94 | 117,068 | MS |
| Missouri | 15 | 153,647 | 38.67 | - | 208,600 | 52.51 | 15 | 35,042 | 8.82 | - | - | - | - | -54,953 | -13.83 | 397,289 | MO |
| Nebraska | 3 | 54,979 | 62.87 | 3 | 28,523 | 32.62 | - | 3,950 | 4.52 | - | - | - | - | 26,456 | 30.25 | 87,452 | NE |
| Nevada | 3 | 8,732 | 47.60 | - | 9,613 | 52.40 | 3 | - | - | - | - | - | - | -881 | -4.80 | 18,345 | NV |
| New Hampshire | 5 | 44,856 | 51.94 | 5 | 40,797 | 47.24 | - | 528 | 0.61 | - | 180 | 0.21 | - | 4,059 | 4.70 | 86,361 | NH |
| New Jersey | 9 | 120,555 | 49.02 | - | 122,565 | 49.84 | 9 | 2,617 | 1.06 | - | 191 | 0.08 | - | -2,010 | -0.82 | 245,928 | NJ |
| New York | 35 | 555,544 | 50.32 | 35 | 534,511 | 48.42 | - | 12,373 | 1.12 | - | 1,517 | 0.14 | - | 21,033 | 1.91 | 1,103,945 | NY |
| North Carolina | 10 | 115,616 | 47.98 | - | 124,204 | 51.55 | 10 | 1,126 | 0.47 | - | - | - | - | -8,588 | -3.56 | 240,946 | NC |
| Ohio | 22 | 375,048 | 51.73 | 22 | 340,821 | 47.01 | - | 6,456 | 0.89 | - | 2,616 | 0.36 | - | 34,227 | 4.72 | 724,967 | OH |
| Oregon | 3 | 20,619 | 50.51 | 3 | 19,955 | 48.88 | - | 249 | 0.61 | - | - | - | - | 664 | 1.63 | 40,823 | OR |
| Pennsylvania | 29 | 444,704 | 50.84 | 29 | 407,428 | 46.57 | - | 20,668 | 2.36 | - | 1,939 | 0.22 | - | 37,276 | 4.26 | 874,783 | PA |
| Rhode Island | 4 | 18,195 | 62.24 | 4 | 10,779 | 36.87 | - | 236 | 0.81 | - | 20 | 0.07 | - | 7,416 | 25.37 | 29,235 | RI |
| South Carolina | 7 | 57,954 | 34.13 | - | 111,236 | 65.51 | 7 | 567 | 0.33 | - | - | - | - | -53,282 | -31.38 | 169,793 | SC |
| Tennessee | 12 | 107,677 | 44.26 | - | 129,569 | 53.26 | 12 | 6,017 | 2.47 | - | - | - | - | -21,892 | -9.00 | 243,263 | TN |
| Texas | 8 | 57,893 | 23.95 | - | 156,428 | 64.71 | 8 | 27,405 | 11.34 | - | - | - | - | -98,535 | -40.76 | 241,726 | TX |
| Vermont | 5 | 45,091 | 69.81 | 5 | 18,182 | 28.15 | - | 1,212 | 1.88 | - | - | - | - | 26,909 | 41.66 | 64,594 | VT |
| Virginia | 11 | 83,533 | 39.47 | - | 128,083 | 60.53 | 11 | - | - | - | - | - | - | -44,550 | -21.05 | 211,616 | VA |
| West Virginia | 5 | 46,243 | 41.05 | - | 57,390 | 50.95 | 5 | 9,008 | 8.00 | - | - | - | - | -11,147 | -9.90 | 112,641 | WV |
| Wisconsin | 10 | 144,398 | 54.04 | 10 | 114,644 | 42.91 | - | 7,986 | 2.99 | - | 68 | 0.03 | - | 29,754 | 11.14 | 267,187 | WI |
| TOTALS: | 369 | 4,453,337 | 48.31 | 214 | 4,444,267 | 48.22 | 155 | 306,135 | 3.32 | - | 10,269 | 0.11 | - | 9,070 | 0.10 | 9,217,410 | US |
Close states
Margin of victory less than 5% (146 electoral votes):
- California, 0.09%
- New Jersey, 0.82%
- Indiana, 1.41%
- Oregon, 1.63%
- New York, 1.91%
- Connecticut, 2.00%
- Delaware, 3.51%
- North Carolina, 3.56%
- Pennsylvania, 4.26%
- New Hampshire, 4.70%
- Ohio, 4.72%
- Nevada, 4.80%
Margin of victory between 5% and 10% (60 electoral votes):
- Colorado, 5.23%
- Maine, 6.14%
- Illinois, 6.54%
- Florida, 8.35%
- Maryland, 8.82%
- Tennessee, 9.00%
- West Virginia, 9.90%
Geography of Results
Cartographic Gallery
-
Map of presidential election results by county.
-

Map of Republican presidential election results by county.
-

Map of Democratic presidential election results by county.
-

Map of "other" presidential election results by county.
-

Cartogram of presidential election results by county.
-

Cartogram of Republican presidential election results by county.
-

Cartogram of Democratic presidential election results by county.
-

Cartogram of "other" presidential election results by county.
Georgia's vote
According to Article II, Section 1, clause 3 of the Constitution, "The Congress may determine the Time of choosing the Electors, and the Day on which they shall give their Votes; which Day shall be the same throughout the United States." In 1792, Congress had set the date for the Electoral College to vote at the first Wednesday in December, and it was still set to that day in 1880, when it fell on December 1. However, Georgia's electors failed to cast their ballots on December 1, instead voting on the following Wednesday, December 8. Congress chose to count Georgia's vote in the official tally, but it is arguable that Georgia's electoral vote was constitutionally invalid, and thus that Hancock's electoral vote should have been 144, not 155.
California's vote
In this year, California's electoral votes were split between the two candidates, with Garfield getting one and Hancock getting five, giving Garfield nineteen states plus one electoral vote. It is speculated that Garfield lost electoral votes in California due to a letter written by Senator James G. Blaine, Garfield's primary supporter, before the election that allegedly favored Chinese immigration. Many in the western states were against Chinese immigration, claiming that the Chinese were limiting the growth of the Pacific coast.[11]
Notably, Garfield won the presidency without simultaneously winning California. No Republican presidential candidate managed to reproduce this feat until George W. Bush in 2000, 120 years later.
See also
- American election campaigns in the 19th century
- History of the United States (1865–1918)
- Inauguration of James A. Garfield
- Third Party System
References
- ↑ "Voter Turnout in Presidential Elections". The American Presidency Project. UC Santa Barbara.
- ↑ Stone, Irving. They Also Ran: The Story of the Men Who Were Defeated for the Presidency (1943)
- ↑ Official Proceedings of the National Democratic Convention Held in Cincinnati, O., June 22d, 23d, and 24th, 1880 p. 118
- ↑ Official Proceedings of the National Democratic Convention Held in Cincinnati, O., June 22d, 23d, and 24th, 1880 p. 137
- ↑ Emma Lou Thornbrough, Indiana in the Civil War Era, pg. 317.
- ↑ http://www.ourcampaigns.com/RaceDetail.html?RaceID=352151
- ↑ Harper's Weekly
- ↑ Spofford, Ainsworth R. An American Almanac and Treasury of Facts, Statistical, Financial, and Political, for the year 1882, p. 267
- ↑ Presidential Elections, 1789-2008: County, State, and National Mapping of Election Data, Donald R. Deskins, Jr., Hanes Walton, Jr., and Sherman C. Puckett, pg. 222-223
- ↑ "1880 Presidential General Election Data - National". Retrieved May 7, 2013.
- ↑ American Tariff League (May 30, 1919). The Tariff review, Volumes 63-64. p. 344. Retrieved May 23, 2010.
Bibliography
- Ackerman, Kenneth D. Dark Horse: The Surprise Election and Political Murder of President James A. Garfield Carroll & Graf, 2004.
- Appleton's Annual Cyclopedia...for 1880 (1881), large compendium of facts, covers every state online
- Barlow, William R. "Cincinnati Hosts the Democrats in 1880,: Cincinnati Historical Society Bulletin, 1964, Vol. 22 Issue 3, pp 145-161, the national convention
- Clancy, Herbert J. The Presidential election of 1880 (1958), standard scholarly narrative
- Joens, David. "Ulysses S. Grant, Illinois, and the Election of 1880," Journal of the Illinois State Historical Society, Dec 2004, Vol. 97 Issue 4, pp 310–330
- Jordan, David A. Winfield Scott Hancock: A Soldier's Life. (1989)
- Lause, Mark A. The Civil War's Last Campaign: James B. Weaver, the Greenback-Labor Party and the Politics of Race and Section (2001)
- Morgan, H. Wayne. From Hayes to McKinley: National Party Politics, 1877-1896 (1969) online edition
- Peskin, Allan. "The Election of 1880," Wilson Quarterly, Spring 1980, Vol. 4 Issue 2, pp 172–181
- Peskin, Allan. Garfield: A Biography, (1978). ISBN 0-87338-210-2 excerpt and text search
- Phillipp, Ernest Joseph. The presidential election of 1880 (1917), old scholarship complete text online
- Schlesinger, Jr., Arthur M. ed. History of American Presidential Elections. 4 vols. (1971). vol. 2 covers 1880
- Summers, Mark Wahlgren. Party Games: Getting, Keeping, and Using Power in Gilded Age Politics (2003) excerpt and text search
- Taylor, John M. "General Hancock: Soldier of the Gilded Age," . Pennsylvania History, Spring 1965, Vol. 32 Issue 2, pp187–196, on Hancock as politician
External links
- Presidential Election of 1880: A Resource Guide from the Library of Congress
- 1880 popular vote by counties
- Garfield and Arthur campaign handkerchief, 1880, in the Staten Island Historical Society Online Collections Database
- Harpers Weekly
- Caricature by Joseph Keppler of 1880 Presidential Candidates
- How close was the 1880 election? — Michael Sheppard, Massachusetts Institute of Technology
- Election of 1880 in Counting the Votes
Navigation
| ||||||||||||||||||||||||||||||||||||||||||||||||||||||||||||||||||||||||||
| ||||||||||||||