United States presidential election, 1836
| | |||||||||||||||||||||||||||||||||||||||||||||||||||||||||||||||||||||||||||||||||||
| |||||||||||||||||||||||||||||||||||||||||||||||||||||||||||||||||||||||||||||||||||
| |||||||||||||||||||||||||||||||||||||||||||||||||||||||||||||||||||||||||||||||||||
|
| |||||||||||||||||||||||||||||||||||||||||||||||||||||||||||||||||||||||||||||||||||
| Presidential election results map. Blue denotes states won by Van Buren and Johnson or Smith, pale grey-purple denotes those won by Harrison and Granger or Tyler, purple denotes those won by White/Tyler, coral pink denotes those won by Webster/Granger, and bluegrass green denotes those won by Mangum/Tyler. Numbers indicate the number of electoral votes allotted to each state. | |||||||||||||||||||||||||||||||||||||||||||||||||||||||||||||||||||||||||||||||||||
| |||||||||||||||||||||||||||||||||||||||||||||||||||||||||||||||||||||||||||||||||||


The United States presidential election of 1836 was the 13th quadrennial presidential election, held from Thursday, November 3, to Wednesday, December 7, 1836. As the third consecutive election victory for the Democratic Party, it ushered incumbent Vice-President Martin Van Buren into the White House with 170 electoral votes to 124 electoral votes for William Henry Harrison and other Whigs. The popular vote was closer; Martin Van Buren attracted 764,000 votes to the 738,000 won by the various Whig candidates.
The election of 1836 is principally remembered for three distinctive circumstances. The most important was the strategy of the Whig party in running several presidential candidates simultaneously. No major party before or since ever attempted this. In 1836, the Whigs ran four candidates in different parts of the country in hopes that each would be popular enough to defeat Democrat Martin Van Buren in their respective regions. In that case, it would have been left to the House of Representatives to decide between the competing Whig candidates. This strategy failed: Van Buren won a majority of electoral (and popular) votes and became president. The election of 1836 was also the last until 1988 to result in the elevation of an incumbent vice-president to the nation's highest office through means other than the president's death or resignation, and the only one in which a vice-presidential election was thrown into the United States Senate.
Nominations
Democratic Party nomination
Democratic candidates
- Martin Van Buren, Vice President of the United States from New York
Candidates gallery
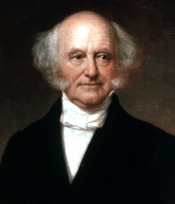
Incumbent President Andrew Jackson decided to retire after two terms and supported his vice-president, Martin Van Buren, to serve as the next president. Although Southerners disliked the New Yorker Van Buren as well as his intended running mate, Colonel Richard Mentor Johnson of Kentucky, Van Buren secured the nomination at the 1835 Democratic National Convention held in Baltimore, Maryland.
| Presidential vote | Vice Presidential vote | ||
|---|---|---|---|
| Martin Van Buren | 265 | Richard M. Johnson | 178 |
| William C. Rives | 87 |
Whig Party nomination
Whig candidates
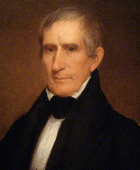
- William Henry Harrison, former United States senator from Ohio
- Daniel Webster, U.S. senator from Massachusetts
- Hugh L. White, United States senator from Tennessee
- Willie Person Mangum, United States senator from North Carolina
Candidates gallery
The Whig Party emerged during the 1834 mid-term elections as the chief opposition to the Democratic Party. It absorbed the National Republican Party, the Anti-Masonic Party and remnants of the Federalist Party. Some Southerners who were angered by Jackson's opposition to states' rights, including Sen. John C. Calhoun and the Nullifiers, were temporarily part of the Whig coalition.
Southern Nullifiers placed Tennessee Senator Hugh Lawson White into contention for the presidency in 1834 soon after his break with Jackson. White was a moderate on the states' rights issue, which made him acceptable in the South, but not in the North. The state legislatures of Alabama and Tennessee officially nominated White. By early 1835, Whigs in the North were lining up behind Massachusetts Senator Daniel Webster. Both Webster and White used debates in the Senate to establish their positions on the issues of the day, and newspapers nationwide carried the text of their speeches. Beginning at the end of 1835, some Whig state conventions in the North began to shift from Webster to popular former general William Henry Harrison. By the middle of 1836, Harrison had replaced Webster as the Whig nominee in all "free" states except Massachusetts. Harrison also replaced White in four border states. Southern Whigs felt betrayed by Northern Whigs for abandoning White, who was still very popular there.
Unable to agree on a single candidate, the Whigs ended up with two primary tickets: William Henry Harrison for president and Francis Granger for vice-president in the North and the border states, and Hugh Lawson White for president and John Tyler for vice-president in the middle and lower South. In Massachusetts, the ticket was Daniel Webster and Granger. In South Carolina, the ticket was Willie P. Mangum for president and Tyler for vice-president.
General election
Campaign

The Whigs attacked Van Buren on all sides, even disrupting the Senate where he presided. Harrison was the most effective of his opponents, but Van Buren's superior party organization carried the day, earning him a majority of the popular vote. Van Buren defeated Harrison by a margin of (51.4%) to (48.6%) in the North, and he defeated White by a similar margin of (50.7%) to (49.3%) in the South.
Disputes
A dispute similar to that of Indiana in 1817 and Missouri in 1821 arose during the counting of the electoral votes. Michigan only became a state on January 26, 1837, and had cast its electoral votes for president before that date. Anticipating a challenge to the results, Congress resolved on February 4, 1837, that during the counting four days later the final tally would be read twice, once with Michigan and once without Michigan. The counting proceeded in accordance with the resolution. The dispute had no bearing on the final result: either way Van Buren was elected, and either way no candidate had a majority for vice-president.[2]
Results
Virginia's 23 electors were all pledged to Van Buren and his running mate, Richard Mentor Johnson. However, all 23 of them became faithless electors and refused to vote for Johnson. This left Johnson one vote short of the 148-vote majority required to elect him. Under the Twelfth Amendment to the United States Constitution, the Senate decided between the top two vote-getters and chose Johnson over Francis Granger.
| Presidential Candidate | Party | Home State | Popular Vote(a) | Electoral Vote | |
|---|---|---|---|---|---|
| Count | Percentage | ||||
| Martin Van Buren | Democratic | New York | 764,176 | 50.8% | 170 |
| William Henry Harrison | Whig | Ohio | 550,816 | 36.6% | 73 |
| Hugh Lawson White | Whig | Tennessee | 146,107 | 9.7% | 26 |
| Daniel Webster | Whig | Massachusetts | 41,201 | 2.7% | 14 |
| Willie Person Mangum | Whig | North Carolina | —(b) | — | 11 |
| Other | 1,234 | 0.1% | 0 | ||
| Total | 1,503,534 | 100.0% | 294 | ||
| Needed to win | 148 | ||||
Source (Popular Vote): Leip, David. 1836 Presidential Election Results. Dave Leip's Atlas of U.S. Presidential Elections (July 27, 2005). Source (Electoral Vote): Electoral College Box Scores 1789–1996. Official website of the National Archives. (July 31, 2005).
(a) The popular vote figures exclude South Carolina where the Electors were chosen by the state legislature rather than by popular vote.
(b) Mangum received his electoral votes from South Carolina where the Electors were chosen by the state legislatures rather than by popular vote.
| Vice Presidential Candidate | Party | State | Electoral Vote |
|---|---|---|---|
| Richard Mentor Johnson | Democratic | Kentucky | 147 |
| Francis Granger | Whig | New York | 77 |
| John Tyler | Whig | Virginia | 47 |
| William Smith | Democratic | South Carolina | 23 |
| Total | 294 | ||
| Needed to win | 148 | ||
Source: Electoral College Box Scores 1789–1996. Official website of the National Archives. (July 31, 2005).
Results by state
| Martin Van Buren Democratic |
William Henry Harrison Whig |
Hugh L. White Whig |
Daniel Webster Whig |
Willie Person Mangum Whig |
State Total | |||||||||||||
|---|---|---|---|---|---|---|---|---|---|---|---|---|---|---|---|---|---|---|
| State | electoral votes |
# | % | electoral votes |
# | % | electoral votes |
# | % | electoral votes |
# | % | electoral votes |
# | % | electoral votes |
# | |
| style"text-align:left" | Alabama | 7 | 20,638 | 55.34 | 7 | no ballots | 16,658 | 44.66 | - | no ballots | no ballots | 37,296 | AL | ||||||
| style"text-align:left" | Arkansas | 3 | 2,380 | 64.08 | 3 | no ballots | 1,334 | 35.92 | - | no ballots | no ballots | 3,714 | AR | ||||||
| style"text-align:left" | Connecticut | 8 | 19,294 | 50.65 | 8 | 18,799 | 49.35 | - | no ballots | no ballots | no ballots | 38,093 | CT | ||||||
| style"text-align:left" | Delaware | 3 | 4,154 | 46.70 | - | 4,736 | 53.24 | 3 | no ballots | no ballots | no ballots | 8,895 | DE | ||||||
| style"text-align:left" | Georgia | 11 | 22,778 | 48.20 | - | no ballots | 24,481 | 51.80 | 11 | no ballots | no ballots | 47,259 | GA | ||||||
| style"text-align:left" | Illinois | 5 | 18,369 | 54.69 | 5 | 15,220 | 45.31 | - | no ballots | no ballots | no ballots | 33,589 | IL | ||||||
| style"text-align:left" | Indiana | 9 | 32,478 | 44.03 | - | 41,281 | 55.97 | 9 | no ballots | no ballots | no ballots | 73,759 | IN | ||||||
| style"text-align:left" | Kentucky | 15 | 33,229 | 47.41 | - | 36,861 | 52.59 | 15 | no ballots | no ballots | no ballots | 70,090 | KY | ||||||
| style"text-align:left" | Louisiana | 5 | 3,842 | 51.74 | 5 | no ballots | 3,583 | 48.26 | - | no ballots | no ballots | 7,425 | LA | ||||||
| style"text-align:left" | Maine | 10 | 22,825 | 58.92 | 10 | 14,803 | 38.21 | - | no ballots | no ballots | no ballots | 38,740 | ME | ||||||
| style"text-align:left" | Maryland | 10 | 22,267 | 46.27 | - | 25,852 | 53.73 | 10 | no ballots | no ballots | no ballots | 48,119 | MD | ||||||
| style"text-align:left" | Massachusetts | 14 | 33,486 | 44.81 | - | no ballots | no ballots | 41,201 | 55.13 | 14 | no ballots | 74,687 | MA | ||||||
| style"text-align:left" | Michigan | 3 | 7,122 | 56.22 | 3 | 5,545 | 43.78 | - | no ballots | no ballots | no ballots | 12,667 | MI | ||||||
| style"text-align:left" | Mississippi | 4 | 10,297 | 51.28 | 4 | no ballots | 9,782 | 48.72 | - | no ballots | no ballots | 20,079 | MS | ||||||
| style"text-align:left" | Missouri | 4 | 10,995 | 59.98 | 4 | no ballots | 7,337 | 40.02 | - | no ballots | no ballots | 18,332 | MO | ||||||
| style"text-align:left" | New Hampshire | 7 | 18,697 | 75.01 | 7 | 6,228 | 24.99 | - | no ballots | no ballots | no ballots | 24,925 | NH | ||||||
| style"text-align:left" | New Jersey | 8 | 25,592 | 49.47 | - | 26,137 | 50.53 | 8 | no ballots | no ballots | no ballots | 51,729 | NJ | ||||||
| style"text-align:left" | New York | 42 | 166,795 | 54.63 | 42 | 138,548 | 45.37 | - | no ballots | no ballots | no ballots | 305,343 | NY | ||||||
| style"text-align:left" | North Carolina | 15 | 26,631 | 53.10 | 15 | no ballots | 23,521 | 46.90 | - | no ballots | no ballots | 50,153 | NC | ||||||
| style"text-align:left" | Ohio | 21 | 96,238 | 47.56 | - | 104,958 | 51.87 | 21 | no ballots | no ballots | no ballots | 202,333 | OH | ||||||
| style"text-align:left" | Pennsylvania | 30 | 91,457 | 51.18 | 30 | 87,235 | 48.82 | - | no ballots | no ballots | no ballots | 178,692 | PA | ||||||
| style"text-align:left" | Rhode Island | 4 | 2,964 | 52.24 | 4 | 2,710 | 47.76 | - | no ballots | no ballots | no ballots | 5,674 | RI | ||||||
| style"text-align:left" | South Carolina | 11 | no popular vote | no popular vote | no popular vote | no popular vote | no popular vote | 11 | - | SC | |||||||||
| style"text-align:left" | Tennessee | 15 | 26,170 | 42.08 | - | no ballots | 36,027 | 57.92 | 15 | no ballots | no ballots | 62,197 | TN | ||||||
| style"text-align:left" | Vermont | 7 | 14,037 | 40.07 | - | 20,994 | 59.93 | 7 | no ballots | no ballots | no ballots | 35,031 | VT | ||||||
| style"text-align:left" | Virginia | 23 | 30,556 | 56.64 | 23 | no ballots | 23,384 | 43.35 | - | no ballots | no ballots | 53,940 | VA | ||||||
| TOTALS: | 294 | 763,291 | 50.79 | 170 | 549,907 | 36.59 | 73 | 146,107 | 9.72 | 26 | 41,201 | 2.74 | 14 | - | - | 11 | 1,502,811 | US |
| TO WIN: | 148 | |||||||||||||||||
Breakdown by ticket
| Presidential Candidate | Running Mate | Electoral Vote |
|---|---|---|
| Martin Van Buren | Richard Mentor Johnson | 147 |
| William Henry Harrison | Francis Granger | 63 |
| Hugh Lawson White | John Tyler | 26 |
| Martin Van Buren | William Smith | 23 |
| Daniel Webster | Francis Granger | 14 |
| Willie Person Mangum | John Tyler | 11 |
| William Henry Harrison | John Tyler | 10 |
Contingent election
The Senate was required to choose between Richard Johnson and Francis Granger as the next vice-president. Johnson was elected easily in a single ballot by 33 to 16.
Electoral college selection
| Method of choosing Electors | State(s) |
|---|---|
| Each Elector appointed by state legislature | South Carolina |
| Each Elector chosen by voters statewide | (all other States) |
See also
- Inauguration of Martin Van Buren
- History of the United States (1789-1849)
- United States House elections, 1836
- United States Senate elections, 1836
References
- ↑ "Voter Turnout in Presidential Elections". The American Presidency Project. UC Santa Barbara.
- ↑ United States Congress (1837). Senate Journal. 24th Congress, 2nd Session, February 4. pp. 203–204. Retrieved August 20, 2006.
Bibliography
- "A Historical Analysis of the Electoral College". The Green Papers. Retrieved March 20, 2005.
- "U.S. President - Whig Nominees 1836". OurCampaigns.com. Retrieved March 20, 2008.
- How close was the 1836 election? — Michael Sheppard, Massachusetts Institute of Technology
- Presidential Election of 1836: A Resource Guide from the Library of Congress
External links
Navigation
| ||||||||||||||
| ||||||||||||||||||||