United States House of Representatives elections, 2010
| | |||||||||||||||||||||||||||||||||||||||||||||||||||
| |||||||||||||||||||||||||||||||||||||||||||||||||||
| |||||||||||||||||||||||||||||||||||||||||||||||||||
|
| |||||||||||||||||||||||||||||||||||||||||||||||||||
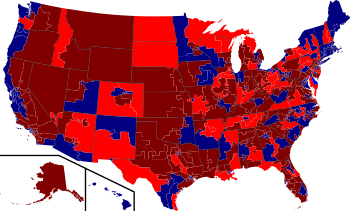
| Results:
Democratic hold
Democratic gain
Republican hold
Republican gain | |||||||||||||||||||||||||||||||||||||||||||||||||||
| |||||||||||||||||||||||||||||||||||||||||||||||||||


The 2010 United States House of Representatives elections were held on November 2, 2010, as part of the 2010 midterm elections (along with Senate elections), at the midpoint of President Barack Obama's first term in office. Voters of the 50 U.S. states chose 435 U.S. Representatives. Voters of the U.S. territories, commonwealths, and the District of Columbia chose their non-voting delegates.[lower-alpha 1]
Republicans regained control of the chamber they had lost in the 2006 midterm elections, picking up a net total of 63 seats and erasing the gains Democrats made in 2006 and 2008. Although the sitting U.S. President's party usually loses seats in a midterm election, the 2010 election resulted in the highest loss of a party in a House midterm election since 1938,[6][7] and the largest House swing since 1948.[8] This also happened to be the Republicans' largest gain in House seats since 1938.[9] Republicans gained the most in New York state where they picked up six seats, defeating five incumbents and winning an open Democratic district. The heavy Democratic Party losses were attributed to anger with President Obama, opposition to the Affordable Care Act, large budget deficits, and the weak economy.[10][11][12] This was also the third consecutive midterm election in a president's first term where the Republican Party has made gains in the House of Representatives, as well as the second consecutive midterm election where party control of the said chamber changed hands.
Background
Following the 2006 elections, Democrats took control of the House as well as the Senate. In the 2008 elections, which coincided with Democrat Barack Obama's victory over Republican John McCain for the presidency, Democrats increased their majorities in both chambers. Of the 435 congressional districts, 242 were carried by Obama, while 193 voted for McCain. Of the districts Obama won, 34 elected a Republican to the House, while 49 of the districts McCain won elected a Democrat.[13]
Republican gains
The Republicans' 63-seat pickup in the House to take control of that chamber, as well as their gain of six Senate seats, signified a dramatic rollback of recent Democratic gains. In the election, Republicans won their greatest number of House seats since 1946.[14] This has been attributed to the continued economic recession, as well as President Obama's controversial stimulus and health care reform bills. Republicans also took control of 29 of the 50 state governorships, and gained 690 seats in state legislatures, to hold their greatest number since the 1928 elections.[15] In North Carolina, Republicans won control of both chambers of the state legislature for the first time in 140 years.[16] The Great Lakes region, which had recently favored the Democratic Party, went strongly Republican. In California and the Pacific Northwest, however, the Democrats retained the upper hand.[17]
Results summary
| 242 | 193 |
| Republican | Democratic |
| Parties(and Independents) | Seats | Popular Vote | ||||||
|---|---|---|---|---|---|---|---|---|
| 2008 | 2010 | Share | Vote | % | ||||
| Republican Party | 178 | 242 | |
55.6% | 44,827,441 | 51.7% | | |
| Democratic Party | 257 | 193 | |
44.4% | 38,980,192 | 44.9% | | |
| Libertarian Party | — | — | — | — | 1,010,891 | 1.2% | | |
| Independent | — | — | — | — | 519,043 | 0.6% | | |
| Green Party | — | — | — | — | 252,688 | 0.3% | | |
| Constitution Party | — | — | — | — | 195,008 | 0.2% | | |
| Independence Party | — | — | — | — | 118,099 | 0.1% | | |
| American Independent Party | — | — | — | — | 56,907 | 0.1% | | |
| Tea Party | — | — | — | — | 38,790 | <0.1% | | |
| Peace and Freedom Party | — | — | — | — | 30,714 | <0.1% | | |
| Conservative Party | — | — | — | — | 24,394 | <0.1% | | |
| Independent Green Party | — | — | — | — | 21,374 | <0.1% | | |
| Towne for Congress Party | — | — | — | — | 15,248 | <0.1% | | |
| Reform Party | — | — | — | — | 9,333 | <0.1% | | |
| Socialist Workers Party | — | — | — | — | 8,905 | <0.1% | | |
| Independent No War Bailout Party | — | — | — | — | 8,397 | <0.1% | | |
| Independent Citizen for Constitutional Government Party | — | — | — | — | 8,001 | <0.1% | | |
| Liberty Party | — | — | — | — | 4,387 | <0.1% | | |
| Working Families Party | — | — | — | — | 4,148 | <0.1% | | |
| Independent Party of Delaware | — | — | — | — | 3,704 | <0.1% | | |
| Florida Whig Party | — | — | — | — | 3,244 | <0.1% | | |
| Socialist Party | — | — | — | — | 3,222 | <0.1% | | |
| Bring Home Troops Party | — | — | — | — | 3,084 | <0.1% | | |
| Tax Revolt Independent Party | — | — | — | — | 2,873 | <0.1% | | |
| Coalition on Government Reform Party | — | — | — | — | 2,802 | <0.1% | | |
| American Congress Party | — | — | — | — | 2,708 | <0.1% | | |
| Independent Progressive Party | — | — | — | — | 2,468 | <0.1% | | |
| Truth Vision Hope Party | — | — | — | — | 2,154 | <0.1% | | |
| Citizen Legislator Party | — | — | — | — | 1,991 | <0.1% | | |
| For Americans Party | — | — | — | — | 1,646 | <0.1% | | |
| Time for Change Party | — | — | — | — | 1,257 | <0.1% | | |
| Action No Talk Party | — | — | — | — | 1,141 | <0.1% | | |
| marklovett.us Party | — | — | — | — | 1,123 | <0.1% | | |
| Your Country Again Party | — | — | — | — | 1,113 | <0.1% | | |
| Agent of Change Party | — | — | — | — | 1,080 | <0.1% | | |
| Green Tea Patriots Party | — | — | — | — | 1,017 | <0.1% | | |
| United Citizens Party | — | — | — | — | 1,013 | <0.1% | | |
| Socialist Action Party | — | — | — | — | 955 | <0.1% | | |
| Gravity Buoyancy Solution Party | — | — | — | — | 910 | <0.1% | | |
| Tax Revolt Party | — | — | — | — | 798 | <0.1% | | |
| American Labor Party | — | — | — | — | 727 | <0.1% | | |
| American Renaissance Movement Party | — | — | — | — | 582 | <0.1% | | |
| Defend American Constitution Party | — | — | — | — | 521 | <0.1% | | |
| Natural Law Party | — | — | — | — | 409 | <0.1% | | |
| Be Determined Party | — | — | — | — | 336 | <0.1% | | |
| Others | — | — | — | — | 608.119 | 0.7% | | |
| Totals | 435 | 435 | 0 | 100.0% | 86,784,957 | 100.0% | | |
Sources: House Clerk - Statistics of the Congressional Election, 2010, House Clerk - Statistics of the Congressional Election, 2008
Retiring incumbents
Thirty-seven incumbents retired.
Democrats
Seventeen incumbent Democrats retired.
- Alabama's 7th congressional district: Artur Davis: To run for Governor of Alabama.[18]
- Arkansas's 1st congressional district: Marion Berry: Retired due to health concerns.[19]
- Arkansas's 2nd congressional district: Vic Snyder: Retired to spend more time with family.[20]
- California's 33rd congressional district: Diane Watson: Retired; "It should be a seat inherited by someone who can represent everyone in this district."[21]
- Florida's 17th congressional district: Kendrick Meek: To run for U.S. Senate.[22]
- Indiana's 8th congressional district: Brad Ellsworth: To run for U.S. Senate.
- Kansas's 3rd congressional district: Dennis Moore: Retired; "Time for a new generation of leadership."[23]
- Louisiana's 3rd congressional district: Charlie Melancon: To run for U.S. Senate.[24]
- Massachusetts's 10th congressional district: Bill Delahunt: Retired; "Life is about change. I think it's healthy. It's time."[25]
- Michigan's 1st congressional district: Bart Stupak: Retired; "I've accomplished what I want to do."[26]
- New Hampshire's 2nd congressional district: Paul Hodes: To run for U.S. Senate.[27]
- Pennsylvania's 7th congressional district: Joe Sestak: To run for U.S. Senate.[28]
- Rhode Island's 1st congressional district: Patrick J. Kennedy: Retired to "[take] a new direction."[29]
- Tennessee's 6th congressional district: Bart Gordon: Retired; "…it's time for a new chapter."[30]
- Tennessee's 8th congressional district: John S. Tanner: Retired; decided 20 years was long enough.[31]
- Washington's 3rd congressional district: Brian Baird: Retired, to pursue other options.[32]
- Wisconsin's 7th congressional district: Dave Obey: Retired; "But even more frankly, I am bone tired."[33] Media reports indicated Obey's future plans included joining a DC lobbying firm run by former Representative Dick Gephardt.[34]
Republicans
Twenty incumbent Republicans retired.
- Arkansas's 3rd congressional district: John Boozman: To run for U.S. Senate
- Arizona's 3rd congressional district: John Shadegg: Retired to pursue other interests.[35]
- California's 19th congressional district: George Radanovich: Retired to put family obligations first.[36]
- Delaware's at-large congressional district: Michael Castle: To run for U.S. Senate.[37]
- Florida's 5th congressional district: Ginny Brown-Waite: Retired due to health issues.[38]
- Florida's 12th congressional district: Adam Putnam: To run for Florida Commissioner of Agriculture.[39]
- Florida's 21st congressional district: Lincoln Diaz-Balart: Retired to return to law practice.
- Florida's 25th congressional district: Mario Diaz-Balart: To run for Florida's 21st district, held by his brother Lincoln Diaz-Balart, who had announced plans to return to law practice.[40]
- Georgia's 7th congressional district: John Linder: Retired.[41]
- Illinois's 10th congressional district: Mark Kirk: To run for U.S. Senate.[42]
- Indiana's 4th congressional district: Steve Buyer: Retired due to wife's illness[43]
- Kansas's 1st congressional district: Jerry Moran: To run for U.S. Senate.[44]
- Kansas's 4th congressional district: Todd Tiahrt: To run for U.S. Senate.[45]
- Michigan's 2nd congressional district: Peter Hoekstra: To run for Governor of Michigan.[46]
- Michigan's 3rd congressional district: Vern Ehlers: Retired.[47]
- Missouri's 7th congressional district: Roy Blunt: To run for U.S. Senate.[48]
- Oklahoma's 5th congressional district: Mary Fallin: To run for Governor of Oklahoma.[49]
- South Carolina's 1st congressional district: Henry E. Brown, Jr.: Retired to spend more time with his family.[50]
- South Carolina's 3rd congressional district: J. Gresham Barrett: To run for Governor of South Carolina.[51]
- Tennessee's 3rd congressional district: Zach Wamp: To run for Governor of Tennessee.[52]
Incumbents defeated
There were nine Democrats who survived reelection in the 1994 Republican Revolution, but were defeated this year.
Lost renomination
Democrats
Two Democrats lost renomination. One seat remained Democratic, and the other seat was taken by a Republican.
- Michigan's 13th congressional district: Carolyn Cheeks Kilpatrick (first elected in 1996) lost to Hansen Clarke
- West Virginia's 1st congressional district: Alan Mollohan (first elected in 1982) lost to Mike Oliverio, but Oliverio lost in the general election to Republican David McKinley.
Republicans
Two Republicans lost renomination. Both seats remained Republican.
- Alabama's 5th congressional district: Parker Griffith (first elected in 2008 as a Democrat; switched parties in 2009) lost to Mo Brooks
- South Carolina's 4th congressional district: Bob Inglis (first elected in 1992) lost to Trey Gowdy
Lost re-election
Fifty-four incumbents lost re-election; almost all of them were Democrats.[53][53]
Democrats
Fifty-two Democrats lost re-election.
- Alabama's 2nd congressional district, Bobby Bright (first elected in 2008) lost to Martha Roby
- Arizona's 1st congressional district, Ann Kirkpatrick (first elected in 2008) lost to Paul Gosar
- Arizona's 5th congressional district, Harry Mitchell (first elected in 2006) lost to David Schweikert
- Colorado's 3rd congressional district, John Salazar (first elected in 2004) lost to Scott Tipton
- Colorado's 4th congressional district, Betsy Markey (first elected in 2008) lost to Cory Gardner
- Florida's 2nd congressional district, Allen Boyd (first elected in 1996) lost to Steve Southerland
- Florida's 8th congressional district, Alan Grayson (first elected in 2008) lost to Daniel Webster
- Florida's 22nd congressional district, Ron Klein (first elected in 2006) lost to Allen West
- Florida's 24th congressional district, Suzanne Kosmas (first elected in 2008) lost to Sandy Adams
- Georgia's 8th congressional district, Jim Marshall (first elected in 2002) lost to Austin Scott
- Idaho's 1st congressional district, Walt Minnick (first elected in 2008) lost to Raúl Labrador
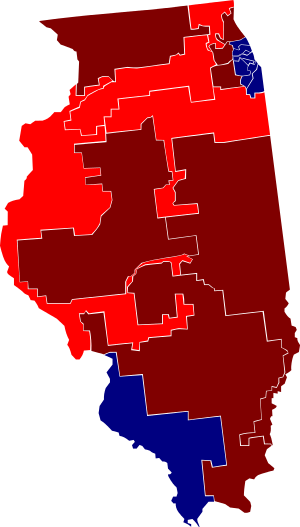
- Illinois's 8th congressional district, Melissa Bean (first elected in 2004) lost to Joe Walsh
- Illinois's 11th congressional district, Debbie Halvorson (first elected in 2008) lost to Adam Kinzinger
- Illinois's 14th congressional district, Bill Foster (first elected in 2008) lost to Randy Hultgren
- Illinois's 17th congressional district, Phil Hare (first elected in 2006) lost to Bobby Schilling
- Indiana's 9th congressional district, Baron Hill (originally elected in 1998) lost to Todd Young
- Maryland's 1st congressional district, Frank Kratovil (first elected in 2008) lost to Andrew P. Harris
- Michigan's 7th congressional district, Mark Schauer (first elected in 2008) lost to Tim Walberg
- Minnesota's 8th congressional district, Jim Oberstar (first elected in 1974) lost to Chip Cravaack
- Mississippi's 1st congressional district, Travis Childers (first elected in 2008) lost to Alan Nunnelee
- Mississippi's 4th congressional district, Gene Taylor (first elected in 1989) lost to Steven Palazzo
- Missouri's 4th congressional district, Ike Skelton (first elected in 1976) lost to Vicky Hartzler
- Nevada's 3rd congressional district, Dina Titus (first elected in 2008) lost to Joe Heck
- New Hampshire's 1st congressional district, Carol Shea-Porter (first elected in 2006) lost to Frank Guinta
- New Jersey's 3rd congressional district, John Adler (first elected in 2008) lost to Jon Runyan
- New Mexico's 2nd congressional district, Harry Teague (first elected in 2008) lost to Steve Pearce
- New York's 13th congressional district, Michael McMahon (first elected in 2008) lost to Michael Grimm
- New York's 19th congressional district, John Hall (first elected in 2006) lost to Nan Hayworth
- New York's 20th congressional district, Scott Murphy (first elected in 2009) lost to Chris Gibson
- New York's 24th congressional district, Mike Arcuri (first elected in 2006) lost to Richard L. Hanna
- New York's 25th congressional district, Dan Maffei (first elected in 2008) lost to Ann Marie Buerkle
- North Carolina's 2nd congressional district, Bob Etheridge (first elected in 1996) lost to Renee Ellmers
- North Dakota's at-large congressional district, Earl Pomeroy (first elected in 1992) lost to Rick Berg
- Ohio's 1st congressional district, Steve Driehaus (first elected in 2008) lost to Steve Chabot
- Ohio's 6th congressional district, Charlie Wilson (first elected in 2006) lost to Bill Johnson
- Ohio's 15th congressional district, Mary Jo Kilroy (first elected in 2008) lost to Steve Stivers
- Ohio's 16th congressional district, John Boccieri (first elected in 2008) lost to Jim Renacci
- Ohio's 18th congressional district, Zack Space (first elected in 2006) lost to Bob Gibbs
- Pennsylvania's 3rd congressional district, Kathy Dahlkemper (first elected in 2008) lost to Mike Kelly
- Pennsylvania's 8th congressional district, Patrick Murphy (first elected in 2006) lost to Mike Fitzpatrick
- Pennsylvania's 10th congressional district, Chris Carney (first elected in 2006) lost to Tom Marino
- Pennsylvania's 11th congressional district, Paul E. Kanjorski (first elected in 1984) lost to Lou Barletta
- South Carolina's 5th congressional district, John M. Spratt, Jr. (first elected in 1982) lost to Mick Mulvaney
- South Dakota's at-large congressional district, Stephanie Herseth Sandlin (first elected in 2004) lost to Kristi Noem
- Tennessee's 4th congressional district, Lincoln Davis (first elected in 2002) lost to Scott DesJarlais
- Texas's 17th congressional district, Chet Edwards (first elected in 1990) lost to Bill Flores
- Texas's 23rd congressional district, Ciro Rodriguez (originally elected in 1996) lost to Quico Canseco
- Texas's 27th congressional district, Solomon P. Ortiz (first elected in 1982) lost to Blake Farenthold
- Virginia's 2nd congressional district, Glenn Nye (first elected in 2008) lost to Scott Rigell
- Virginia's 5th congressional district, Tom Perriello (first elected in 2008) lost to Robert Hurt
- Virginia's 9th congressional district, Rick Boucher (first elected in 1982) lost to Morgan Griffith
- Wisconsin's 8th congressional district, Steve Kagen (first elected in 2006) lost to Reid Ribble
Republicans
Two Republicans lost re-election.
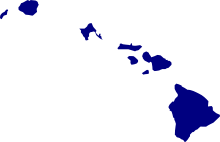
- Hawaii's 1st congressional district, Charles Djou (first elected in 2010) lost to Colleen Hanabusa
- Louisiana's 2nd congressional district, Joseph Cao (first elected in 2008) lost to Cedric Richmond
Open seat gains
Democratic to Republican
Fourteen open seats, held by Democrats, were won by Republicans.
- Arkansas's 1st congressional district
- Arkansas's 2nd congressional district
- Indiana's 8th congressional district
- Kansas's 3rd congressional district
- Louisiana's 3rd congressional district
- Michigan's 1st congressional district
- New Hampshire's 2nd congressional district
- New York's 29th congressional district
- Pennsylvania's 7th congressional district
- Tennessee's 6th congressional district
- Tennessee's 8th congressional district
- Washington's 3rd congressional district
- West Virginia's 1st congressional district
- Wisconsin's 7th congressional district
Republican to Democratic
One open seat, held by a Republican, was won by a Democrat.
Predictions

The following were predictions of the outcome of the 2010 United States House of Representatives elections.
- RealClearPolitics.
- As of November 2, 2010, RCP projected the Republicans would take 224 seats, the Democrats would take 167, and 44 races were toss-ups.[54]
- Nate Silver, FiveThirtyEight (New York Times)
- As of November 2, 2010, Nate Silver's prediction model projected the Republicans would win (on average) 232.2 seats, and the Democrats would win 202.8.[55]
- Patrick Ishmael, Hot Air.com
- Crystal Ball
- As of November 1, 2010, Larry Sabato predicted, "If the election were held today: + 55 Republican House seats".[59]
- Charlie Cook
- On October 26, 2010, The Cook Political Report raised its House forecast to "a Democratic net loss of 48 to 60 seats, with higher losses possible."[60]
- In a February 2010 interview with National Journal, he said that "it's very hard to come up with a scenario where Democrats don't lose the House. It's very hard."[61]
- Rasmussen Reports
- On November 1, 2010, Scott Rasmussen predicted the Democrats "will likely lose 55 or more seats in the House."[62]
- Rothenberg Political Report.
- On October 28, 2010, Rothenberg Political Report predicted "Likely Republican gain of 55-65 seats, with gains at or above 70 seats possible."[63]
- In April 2010, Stuart Rothenberg wrote on his blog that "…the atmospherics remain strongly behind the GOP, and major Republican House gains are extremely likely" and that "it's clear that the battleground is almost entirely on Democratic soil. Obviously, control of the House is at risk."[64]
- Congressional Quarterly.
- In October 2010, Congressional Quarterly projected the Democrats would take 195 seats, the Republicans 199, and they considered 41 races too close to call.[65]
- In July 2010, Congressional Quarterly projected the Democrats would take 205 seats, the Republicans 190, and they considered 40 races too close to call.[66]
The following table contains the final ratings of the competitiveness of selected races according to noted political analysts. Races which were considered safe for the incumbent's party are not included. Incumbents who did not run for re-election have parentheses around their name.
| District | Incumbent | Cook[67] | Rothenberg[68] | CQ Politics[69] | Sabato's Crystal Ball[70] |
RealClear[71] | Winner | ||
|---|---|---|---|---|---|---|---|---|---|
| AL-2 | Bright (D) | Tossup | Tossup/Tilts R | Tossup | Leans D | Tossup | Roby (R) | ||
| AL-5 | (Griffith) (R) | Likely R | Safe R | Safe R | Likely R | Likely R | Brooks (R) | ||
| AZ-1 | Kirkpatrick (D) | Leans R | Leans R | Leans R | Leans R | Leans R | Gosar (R) | ||
| AZ-3 | (Shadegg) (R) | Lean R | Safe R | Safe R | Leans R | Leans R | Quayle (R) | ||
| AZ-5 | Mitchell (D) | Tossup | Tossup/Tilts R | Tossup | Leans R | Leans R | Schweikert (R) | ||
| AZ-7 | Grijalva (D) | Tossup | Leans D | Leans D | Leans D | Tossup | Grijalva (D) | ||
| AZ-8 | Giffords (D) | Tossup | Pure Tossup | Tossup | Leans D | Leans R | Giffords (D) | ||
| AR-1 | (Berry) (D) | Lean R | Tossup/Tilts R | Tossup | Leans R | Leans R | Crawford (R) | ||
| AR-2 | (Snyder) (D) | Likely R | R Favored | Likely R | Likely R | Likely R | Griffin (R) | ||
| CA-3 | Lungren (R) | Leans R | Leans R | Leans R | Leans R | Leans R | Lungren (R) | ||
| CA-11 | McNerney (D) | Tossup | Pure Tossup | Tossup | Leans R | Leans R | McNerney (D) | ||
| CA-18 | Cardoza (D) | Likely D | Safe D | Safe D | Likely D | Leans D | Cardoza (D) | ||
| CA-20 | Costa (D) | Tossup | Leans D | Leans D | Leans D | Leans R | Costa (D) | ||
| CA-47 | Sanchez (D) | Leans D | Leans D | Leans D | Likely D | Leans D | Sanchez (D) | ||
| CO-3 | Salazar (D) | Tossup | Tossup/Tilts R | Tossup | Leans R | Leans R | Tipton (R) | ||
| CO-4 | Markey (D) | Leans R | R Favored | Likely R | Leans R | Leans R | Gardner (R) | ||
| CO-7 | Perlmutter (D) | Leans D | D Favored | Leans D | Likely D | Tossup | Perlmutter (D) | ||
| CT-4 | Himes (D) | Leans D | D Favored | Leans D | Leans D | Tossup | Himes (D) | ||
| CT-5 | C. Murphy (D) | Leans D | D Favored | Leans D | Leans D | Tossup | C. Murphy (D) | ||
| DE-AL | (Castle) (R) | Likely D | Leans D | Likely D | Leans D | Leans D | Carney (D) | ||
| FL-2 | Boyd (D) | Leans R | R Favored | Leans R | Leans R | Leans R | Southerland (R) | ||
| FL-8 | Grayson (D) | Likely R | R Favored | Leans R | Leans R | Leans R | Webster (R) | ||
| FL-12 | (Putnam) (R) | Lean R | Tossup/Tilts R | Leans R | Leans R | Likely R | Ross (R) | ||
| FL-22 | Klein (D) | Tossup | Pure Tossup | Leans D | Leans R | Leans R | West (R) | ||
| FL-24 | Kosmas (D) | Lean R | R Favored | Likely R | Leans R | Leans R | Adams (R) | ||
| FL-25 | (M. Diaz-Balart) (R) | Lean R | Leans R | Leans R | Leans R | Leans R | Rivera (R) | ||
| GA-2 | S. Bishop (D) | Tossup | Leans D | Tossup | Leans R | Leans R | S. Bishop (D) | ||
| GA-8 | Marshall (D) | Lean R | Leans R | Leans R | Leans R | Leans R | Scott (R) | ||
| HI-1 | Djou (R) | Tossup | Pure Tossup | Tossup | Leans R | Tossup | Hanabusa (D) | ||
| ID-1 | Minnick (D) | Tossup | Tossup/Tilts D | Leans D | Leans R | Tossup | Labrador (R) | ||
| IL-8 | Bean (D) | Likely D | Safe D | Safe D | Likely D | Leans D | Walsh (R) | ||
| IL-10 | (Kirk) (R) | Leans D | Tossup/Tilts D | Leans D | Leans D | Tossup | Dold (R) | ||
| IL-11 | Halvorson (D) | Leans R | R Favored | Likely R | Leans R | Likely R | Kinzinger (R) | ||
| IL-14 | Foster (D) | Tossup | Tossup/Tilts R | Tossup | Leans R | Leans R | Hultgren (R) | ||
| IL-17 | Hare (D) | Tossup | Tossup/Tilts R | Tossup | Leans R | Leans R | Schilling (R) | ||
| IN-2 | Donnelly (D) | Tossup | Leans D | Leans D | Leans D | Tossup | Donnelly (D) | ||
| IN-8 | (Ellsworth) (D) | Likely R | R Favored | Likely R | Likely R | Leans R | Bucshon (R) | ||
| IN-9 | Hill (D) | Tossup | Tossup/Tilts R | Leans R | Leans R | Leans R | Young (R) | ||
| IA-1 | Braley (D) | Lean D | D Favored | Leans D | Likely D | Leans D | Braley (D) | ||
| IA-2 | Loebsack (D) | Lean D | D Favored | Leans D | Likely D | Leans D | Loebsack (D) | ||
| IA-3 | Boswell (D) | Lean D | D Favored | Leans D | Leans D | Leans D | Boswell (D) | ||
| KS-3 | (Moore) (D) | Likely R | R Favored | Likely R | Likely R | Likely R | Yoder (R) | ||
| KY-3 | Yarmuth (D) | Likely D | D Favored | Likely D | Likely D | Leans D | Yarmuth (D) | ||
| KY-6 | Chandler (D) | Tossup | Leans D | Leans D | Leans D | Tossup | Chandler (D) | ||
| LA-2 | Cao (R) | Leans D | D Favored | Likely D | Leans D | Leans D | Richmond (D) | ||
| LA-3 | (Melancon) (D) | Likely R | R Favored | Safe R | Likely R | Likely R | Landry (R) | ||
| ME-1 | Pingree (D) | Tossup | D Favored | Leans D | Leans D | Tossup | Pingree (D) | ||
| ME-2 | Michaud (D) | Lean D | D Favored | Likely D | Safe D | Tossup | Michaud (D) | ||
| MD-1 | Kratovil (D) | Lean R | Leans R | Leans R | Leans R | Leans R | Harris (R) | ||
| MA-4 | Frank (D) | Lean D | Safe D | Likely D | Likely D | Leans D | Frank (D) | ||
| MA-5 | Tsongas (D) | Likely D | Safe D | Likely D | Safe D | Likely D | Tsongas (D) | ||
| MA-10 | (Delahunt) (D) | Tossup | Pure Tossup | Tossup | Leans D | Tossup | Keating (D) | ||
| MI-1 | (Stupak) (D) | Leans R | Tossup/Tilt R | Leans R | Leans R | Leans R | Benishek (R) | ||
| MI-7 | Schauer (D) | Tossup | Pure Tossup | Tossup | Leans R | Tossup | Walberg (R) | ||
| MI-9 | Peters (D) | Lean D | Leans D | Likely D | Leans D | Tossup | Peters (D) | ||
| MN-1 | Walz (D) | Leans D | D Favored | Leans D | Leans D | Leans D | Walz (D) | ||
| MN-6 | Bachmann (R) | Likely R | Safe R | Safe R | Likely R | Likely R | Bachmann (R) | ||
| MN-8 | Oberstar (D) | Tossup | D Favored | Likely D | Leans D | Tossup | Cravaack (R) | ||
| MS-1 | Childers (D) | Tossup | Tossup/Tilts R | Tossup | Leans R | Leans R | Nunnelee (R) | ||
| MS-4 | Taylor (D) | Tossup | Pure Tossup | Tossup | Leans D | Tossup | Palazzo (R) | ||
| MO-3 | Carnahan (D) | Lean D | D Favored | Likely D | Likely D | Leans D | Carnahan (D) | ||
| MO-4 | Skelton (D) | Tossup | Pure Tossup | Tossup | Leans D | Tossup | Hartzler (R) | ||
| NE-2 | Terry (R) | Likely R | Safe R | Safe R | Likely R | Likely R | Terry (R) | ||
| NV-3 | Titus (D) | Lean R | Tossup/Tilts R | Leans R | Leans R | Leans R | Heck (R) | ||
| NH-1 | Shea-Porter (D) | Lean R | R Favored | Leans R | Leans R | Leans R | Guinta (R) | ||
| NH-2 | (Hodes) (D) | Tossup | Pure Tossup | Tossup | Leans R | Tossup | Bass (R) | ||
| NJ-3 | Adler (D) | Tossup | Tossup/Tilts R | Leans D | Leans R | Leans R | Runyan (R) | ||
| NJ-12 | Holt (D) | Likely D | Safe D | Safe D | Likely D | Leans D | Holt (D) | ||
| NM-1 | Heinrich (D) | Tossup | Pure Tossup | Leans D | Leans D | Tossup | Heinrich (D) | ||
| NM-2 | Teague (D) | Lean R | Leans R | Tossup | Leans R | Leans R | Pearce (R) | ||
| NY-1 | T. Bishop (D) | Tossup | Tossup/Tilts D | Tossup | Likely D | Tossup | T. Bishop (D) | ||
| NY-4 | McCarthy (D) | Likely D | Safe D | Likely D | Safe D | Likely D | McCarthy (D) | ||
| NY-13 | McMahon (D) | Lean D | D Favored | Leans D | Likely D | Tossup | Grimm (R) | ||
| NY-19 | Hall (D) | Tossup | Tossup/Tilts R | Tossup | Leans R | Tossup | Hayworth (R) | ||
| NY-20 | S. Murphy (D) | Tossup | Tossup/Tilts R | Tossup | Leans R | Leans R | Gibson (R) | ||
| NY-22 | Hinchey (D) | Lean D | Safe D | Likely D | Likely D | Leans D | Hinchey (D) | ||
| NY-23 | Owens (D) | Tossup | Pure Tossup | Tossup | Leans R | Leans R | Owens (D) | ||
| NY-24 | Arcuri (D) | Tossup | Pure Tossup | Tossup | Leans D | Tossup | Hanna (R) | ||
| NY-25 | Maffei (D) | Leans D | D Favored | Likely D | Likely D | Leans D | Buerkle (R) | ||
| NY-29 | Zeller (D) | Likely R | R Favored | Safe R | Likely R | Likely R | Reed (R) | ||
| NC-2 | Etheridge (D) | Leans D | Tossup/Tilts D | Likely D | Likely D | Tossup | Ellmers (R) | ||
| NC-7 | McIntyre (D) | Tossup | Tossup/Tilts D | Leans D | Likely D | Tossup | McIntyre (D) | ||
| NC-8 | Kissell (D) | Tossup | Leans D | Tossup | Leans R | Tossup | Kissell (D) | ||
| NC-11 | Shuler (D) | Lean D | D Favored | Likely D | Likely D | Tossup | Shuler (D) | ||
| ND-AL | Pomeroy (D) | Tossup | Tossup/Tilt R | Tossup | Leans R | Leans R | Berg (R) | ||
| OH-1 | Driehaus (D) | Leans R | R Favored | Likely R | Leans R | Leans R | Chabot (R) | ||
| OH-6 | Wilson (D) | Tossup | Pure Tossup | Tossup | Leans D | Tossup | Johnson (R) | ||
| OH-12 | Tiberi (R) | Likely R | Safe R | Safe R | Likely R | Likely R | Tiberi (R) | ||
| OH-13 | Sutton (D) | Likely D | D Favored | Likely D | Likely D | Leans D | Sutton (D) | ||
| OH-15 | Kilroy (D) | Leans R | R Favored | Likely R | Leans R | Likely R | Stivers (R) | ||
| OH-16 | Boccieri (D) | Tossup | Leans R | Tossup | Leans R | Leans R | Renacci (R) | ||
| OH-18 | Space (D) | Tossup | Tossup/Tilts R | Tossup | Leans R | Leans R | Gibbs (R) | ||
| OR-1 | Wu (D) | Likely D | Safe D | Likely D | Safe D | Likely D | Wu (D) | ||
| OR-5 | Schrader (D) | Tossup | Pure Tossup | Tossup | Leans D | Tossup | Schrader (D) | ||
| PA-3 | Dahlkemper (D) | Leans R | R Favored | Likely R | Leans R | Leans R | Kelly (R) | ||
| PA-4 | Altmire (D) | Lean D | D Favored | Likely D | Likely D | Leans D | Altmire (D) | ||
| PA-6 | Gerlach (R) | Likely R | Safe R | Safe R | Likely R | Leans R | Gerlach (R) | ||
| PA-7 | (Sestak) (D) | Leans R | Tossup/Tilts R | Tossup | Leans R | Tossup | Meehan (R) | ||
| PA-8 | P. Murphy (D) | Tossup | Tossup/Tilts R | Tossup | Leans R | Tossup | Fitzpatrick (R) | ||
| PA-10 | Carney (D) | Tossup | Pure Tossup | Tossup | Leans R | Leans R | Marino (R) | ||
| PA-11 | Kanjorski (D) | Tossup | Tossup/Tilts R | Leans R | Leans R | Tossup | Barletta (R) | ||
| PA-12 | Critz (D) | Lean D | Pure Tossup | Leans D | Leans D | Tossup | Critz (D) | ||
| PA-15 | Dent (R) | Likely R | R Favored | Leans R | Leans R | Likely R | Dent (R) | ||
| PA-17 | Holden (D) | Likely D | Safe D | Likely D | Likely D | Likely D | Holden (D) | ||
| RI-1 | (Kennedy) (D) | Lean D | Leans D | Leans D | Leans D | Tossup | Cicilline (D) | ||
| SC-5 | Spratt (D) | Tossup | Leans R | Leans R | Leans R | Leans R | Mulvaney (R) | ||
| SD-AL | Herseth Sandlin (D) | Tossup | Tossup/Tilts R | Tossup | Leans R | Leans R | Noem (R) | ||
| TN-4 | Davis (D) | Tossup | Tossup/Tilts R | Tossup | Leans R | Tossup | DesJarlais (R) | ||
| TN-6 | (Gordon) (D) | Likely R | R Favored | Safe R | Likely R | Likely R | Black (R) | ||
| TN-8 | (Tanner) (D) | Likely R | R Favored | Likely R | Likely R | Likely R | Fincher (R) | ||
| TX-17 | Edwards (D) | Leans R | R Favored | Likely R | Leans R | Likely R | Flores (R) | ||
| TX-23 | Rodriguez (D) | Tossup | Pure Tossup | Tossup | Leans R | Leans R | Canseco (R) | ||
| TX-27 | Ortiz (D) | Lean D | D Favored | Likely D | Safe D | Tossup | Farenthold (R) | ||
| VA-2 | Nye (D) | Lean R | Leans R | Leans R | Leans R | Leans R | Rigell (R) | ||
| VA-5 | Perriello (D) | Lean R | Tossup/Tilts R | Tossup | Leans R | Leans R | Hurt (R) | ||
| VA-9 | Boucher (D) | Tossup | Tossup/Tilts D | Leans D | Leans D | Tossup | Griffith (R) | ||
| VA-11 | Connolly (D) | Tossup | Leans D | Leans D | Leans D | Tossup | Connolly (D) | ||
| WA-2 | Larsen (D) | Tossup | Leans D | Leans D | Leans D | Tossup | Larsen (D) | ||
| WA-3 | (Baird) (D) | Lean R | Tossup/Tilts R | Leans R | Leans R | Tossup | Herrera (R) | ||
| WA-8 | Reichert (R) | Likely R | R Favored | Leans R | Leans R | Leans R | Reichert (R) | ||
| WV-1 | (Mollohan) (D) | Tossup | Pure tossup | Tossup | Leans R | Tossup | McKinley (R) | ||
| WV-3 | Rahall (D) | Likely D | Safe D | Likely D | Likely D | Leans D | Rahall (D) | ||
| WI-3 | Kind (D) | Leans D | D Favored | Leans D | Likely D | Tossup | Kind (D) | ||
| WI-7 | (Obey) (D) | Tossup | Tossup/Tilts R | Tossup | Leans R | Leans R | Duffy (R) | ||
| WI-8 | Kagen (D) | Leans R | Leans R | Leans R | Leans R | Leans R | Ribble (R) | ||
| District | Incumbent | Cook | Rothenberg | CQ Politics | Sabato's Crystal Ball |
RealClear | Winner |
Complete list
- Most recent election results are listed. Winning candidates are listed in bold.
Key:
| Abbreviation | Party |
|---|---|
| AI | American Independent Party |
| AK | Alaskan Independence Party |
| BE | Blue Enigma Party |
| C | Constitution Party |
| Cons | Conservative Party |
| Cov | Covenant Party |
| D | Democratic Party |
| DC | D.C. Statehood Green Party |
| FL Whig | Florida Whig Party |
| G | Green Party |
| I | Independent |
| IA | Independent American Party |
| IG | Independent Green Party |
| IP | Independence Party |
| L | Libertarian Party |
| LU | Liberty Union Party |
| PG | Pacific Green Party |
| PF | Peace and Freedom Party |
| P | Progressive Party |
| Ref | Reform Party |
| R | Republican Party |
| S | Socialist Party |
| SA | Socialist Action Party |
| SW | Socialist Workers Party |
| Tea | Tea Party |
| TL | Term Limits Party |
| TR | Tax Revolt Party |
| TVH | Truth Vision Hope Party |
| U | Unity Party |
| UC | United Citizens Party |
| UST | U.S. Taxpayers Party |
| WF | Working Families Party |
| W-I | Write-In Candidate |
Alabama

| District | Incumbent | Party | First elected |
Result | Candidates[72] |
|---|---|---|---|---|---|
| Alabama 1 | Jo Bonner | Republican | 2002 | Re-elected | Jo Bonner (R) 83.0% David Walter (C) 17.0% |
| Alabama 2 | Bobby Bright | Democratic | 2008 | Lost re-election Republican gain |
Martha Roby (R) 51.3% Bobby Bright (D) 48.7% |
| Alabama 3 | Mike Rogers | Republican | 2002 | Re-elected | Mike Rogers (R) 59.1% Steve Segrest (D) 40.9% |
| Alabama 4 | Robert Aderholt | Republican | 1996 | Re-elected | Robert Aderholt (R) unopposed |
| Alabama 5 | Parker Griffith | Republican | 2008 | Lost renomination Republican hold |
Mo Brooks (R) 58.5% Steve Raby (D) 41.5% |
| Alabama 6 | Spencer Bachus | Republican | 1992 | Re-elected | Spencer Bachus (R) unopposed |
| Alabama 7 | Artur Davis | Democratic | 2002 | Retired to run for Governor Democratic hold |
Terri Sewell (D) 72.6% Don Chamberlain (R) 27.4% |
Alaska

| District | Incumbent | Party | First elected |
Result | Candidates[73] |
|---|---|---|---|---|---|
| Alaska at-large | Don Young | Republican | 1973 | Re-elected | Don Young (R) 69.0% Harry Crawford (D) 30.5% |
Arizona

| District | Incumbent | Party | First elected |
Result | Candidates[74] |
|---|---|---|---|---|---|
| Arizona 1 | Ann Kirkpatrick | Democratic | 2008 | Lost re-election Republican gain |
Paul Gosar (R) 49.7% Ann Kirkpatrick (D) 43.7% Nicole Patti (L) 6.6% |
| Arizona 2 | Trent Franks | Republican | 2002 | Re-elected | Trent Franks (R) 64.9% John Thrasher (D) 31.1% Powell Gammill (L) 4.0% |
| Arizona 3 | John Shadegg | Republican | 1994 | Retired Republican hold |
Ben Quayle (R) 52.2% Jon Hulburd (D) 41.1% Michael Shoen (L) 5.0% Leonard Clark (G) 1.6% |
| Arizona 4 | Ed Pastor | Democratic | 1991 | Re-elected | Ed Pastor (D) 66.9% Janet Contreras (R) 27.5% Joe Cobb (L) 3.0% Rebecca DeWitt (G) 2.6% |
| Arizona 5 | Harry Mitchell | Democratic | 2006 | Lost re-election Republican gain |
David Schweikert (R) 52.0% Harry Mitchell (D) 43.2% Nick Coons (L) 4.8% |
| Arizona 6 | Jeff Flake | Republican | 2000 | Re-elected | Jeff Flake (R) 66.4% Rebecca Schneider (D) 29.1% Richard Grayson (G) 3.1% Darell Tapp (L) 1.4% |
| Arizona 7 | Raul Grijalva | Democratic | 2002 | Re-elected | Raul Grijalva (D) 50.2% Ruth McClung (R) 44.2% Harley Meyer (I) 2.8% George Keane (L) 2.7% |
| Arizona 8 | Gabrielle Giffords | Democratic | 2006 | Re-elected | Gabrielle Giffords (D) 48.8% Jesse Kelly (R) 47.3% Steven Stoltz (L) 3.9% |
Arkansas
| District | Incumbent | Party | First elected |
Result | Candidates[75] |
|---|---|---|---|---|---|
| Arkansas 1 | Marion Berry | Democratic | 1996 | Retired Republican gain |
Rick Crawford (R) 51.8% Chad Causey (D) 43.5% Ken Adler (G) 4.6% |
| Arkansas 2 | Vic Snyder | Democratic | 1996 | Retired Republican gain |
Tim Griffin (R) 57.9% Joyce Elliott (D) 38.3% Lance Levi (I) 2.1% Lewis Kennedy (G) 1.7% |
| Arkansas 3 | John Boozman | Republican | 2000 | Retired to run for U.S. Senate Republican hold |
Steve Womack (R) 72.4% David Whitaker (D) 27.6% |
| Arkansas 4 | Mike Ross | Democratic | 2000 | Re-elected | Mike Ross (D) 57.5% Beth Anne Rankin (R) 40.2% Joshua Drake (G) 2.3% |
California

| District | Incumbent | Party | First elected |
Result | Candidates[76] |
|---|---|---|---|---|---|
| California 1 | Mike Thompson | Democratic | 1998 | Re-elected | Mike Thompson (D) 63.0% Loren Hanks (R) 31.0% Carol Wolman (G) 3.5% Mike Rodrigues (L) 2.5% |
| California 2 | Wally Herger | Republican | 1988 | Re-elected | Wally Herger (R) 57.1% Jim Reed (D) 42.9% Mark A. Jensen (W/I) 0.0% |
| California 3 | Dan Lungren | Republican | 1998 | Re-elected | Dan Lungren (R) 50.1% Ami Bera (D) 43.2% Jerry Leidecker (AI) 2.5% Douglas Arthur Tuma (L) 2.4% Mike Roskey (PF) 1.8% |
| California 4 | Tom McClintock | Republican | 2008 | Re-elected | Tom McClintock (R) 61.3% Clint Curtis (D) 31.4% Ben Emery (G) 7.3% |
| California 5 | Doris Matsui | Democratic | 2005 | Re-elected | Doris Matsui (D) 72.0% Paul Smith (R) 25.3% Gerald Allen Frink (PF) 2.7% |
| California 6 | Lynn Woolsey | Democratic | 1992 | Re-elected | Lynn Woolsey (D) 65.9% Jim Judd (R) 29.6% Eugene Ruyle (PF) 2.3% Joel Smolen (L) 2.2% |
| California 7 | George Miller | Democratic | 1974 | Re-elected | George Miller (D) 68.3% Rick Tubbs (R) 31.7% |
| California 8 | Nancy Pelosi | Democratic | 1987 | Re-elected | Nancy Pelosi (D) 80.1% John Dennis (R) 15.1% Gloria La Riva (PF) 2.5% Philip Berg (L) 2.3% Summer Shields (W/I) 0.0% |
| California 9 | Barbara Lee | Democratic | 1998 | Re-elected | Barbara Lee (D) 84.3% Gerald Hashimoto (R) 10.8% Dave Heller (G) 2.3% James Eyer (L) 1.9% Larry Allen (PF) 0.8% |
| California 10 | John Garamendi | Democratic | 2009 | Re-elected | John Garamendi (D) 58.8% Gary Clift (R) 37.9% Jeremy Cloward (G) 3.3% |
| California 11 | Jerry McNerney | Democratic | 2006 | Re-elected | Jerry McNerney (D) 48.0% David Harmer (R) 46.9% David Christensen (AI) 5.2% |
| California 12 | Jackie Speier | Democratic | 2008 | Re-elected | Jackie Speier (D) 75.6% Mike Moloney (R) 22.1% Mark Paul Williams (L) 2.3% Joseph Michael Harding (W/I) 0.0% |
| California 13 | Pete Stark | Democratic | 1972 | Re-elected | Pete Stark (D) 72.0% Forest Baker (R) 27.7% Chris Pareja (W/I) 0.3% |
| California 14 | Anna Eshoo | Democratic | 1992 | Re-elected | Anna Eshoo (D) 69.1% Dave Chapman (R) 27.8% Paul Lazaga (L) 3.1% |
| California 15 | Mike Honda | Democratic | 2000 | Re-elected | Mike Honda (D) 67.6% Scott Kirkland (R) 32.4% |
| California 16 | Zoe Lofgren | Democratic | 1994 | Re-elected | Zoe Lofgren (D) 67.8% Daniel Sahagun (R) 24.3% Edward Gonzalez (L) 7.9% |
| California 17 | Sam Farr | Democratic | 1992 | Re-elected | Sam Farr (D) 66.6% Jeff Taylor (R) 26.5% Mary Larkin (L) 4.9% Eric Petersen (G) 1.9% Ronald P. Kabat (W/I) 0.1% |
| California 18 | Dennis Cardoza | Democratic | 2002 | Re-elected | Dennis Cardoza (D) 58.5% Michael Clarke Berryhill (R) 41.5% |
| California 19 | George Radanovich | Republican | 1994 | Retired Republican hold |
Jeff Denham (R) 64.6% Loraine Goodwin (D) 35.1% Les Marsden (D-W/I) 0.3% |
| California 20 | Jim Costa | Democratic | 2004 | Re-elected | Jim Costa (D) 51.7% Andy Vidak (R) 48.3% |
| California 21 | Devin Nunes | Republican | 2000 | Re-elected | Devin Nunes (R) unopposed |
| California 22 | Kevin McCarthy | Republican | 2006 | Re-elected | Kevin McCarthy (R) 98.8% John Uebersax (W/I) 1.2% |
| California 23 | Lois Capps | Democratic | 1998 | Re-elected | Lois Capps (D) 57.8% Tom Watson (R) 37.6% John Hager (I) 2.9% Darrell Stafford (L) 1.7% |
| California 24 | Elton Gallegly | Republican | 1986 | Re-elected | Elton Gallegly (R) 59.9% Timothy Allison (D) 40.1% |
| California 25 | Howard McKeon | Republican | 1992 | Re-elected | Howard McKeon (R) 61.8% Jackie Conaway (D) 38.2% |
| California 26 | David Dreier | Republican | 1980 | Re-elected | David Dreier (R) 54.1% Russ Warner (D) 36.5% David Miller (AI) 6.1% Randall Weissbuch (L) 3.2% |
| California 27 | Brad Sherman | Democratic | 1996 | Re-elected | Brad Sherman (D) 65.2% Mark Reed (R) 34.8% |
| California 28 | Howard Berman | Democratic | 1982 | Re-elected | Howard Berman (D) 69.5% Merlin Froyd (R) 22.4% Carlos Rodriguez (L) 8.1% |
| California 29 | Adam Schiff | Democratic | 2000 | Re-elected | Adam Schiff (D) 64.8% John Colbert (R) 32.0% William Cushing (L) 3.2% |
| California 30 | Henry Waxman | Democratic | 1974 | Re-elected | Henry Waxman (D) 64.6% Chuck Wilkerson (R) 31.9% Erich Miller (L) 2.1% Richard Castaldo (PF) 1.3% |
| California 31 | Xavier Becerra | Democratic | 1992 | Re-elected | Xavier Becerra (D) 83.8% Stephen Smith (R) 16.2% Sal Genovese (W/I) 0.0% |
| California 32 | Judy Chu | Democratic | 2009 | Re-elected | Judy Chu (D) 71.0% Ed Schmerling (R) 29.0% |
| California 33 | Diane Watson | Democratic | 2001 | Retired Democratic hold |
Karen Bass (D) 86.1% James Andion (R) 13.9% Mervin Leon Evans 0.0% |
| California 34 | Lucille Roybal-Allard | Democratic | 1992 | Re-elected | Lucille Roybal-Allard (D) 77.2% Wayne Miller (R) 22.8% |
| California 35 | Maxine Waters | Democratic | 1990 | Re-elected | Maxine Waters (D) 79.3% Bruce Brown (R) 20.7% Suleiman Charles Edmonson (W/I) 0.0% |
| California 36 | Jane Harman | Democratic | 1986 | Re-elected | Jane Harman (D) 59.6% Mattie Fein (R) 34.7% Herb Peters (L) 5.6% |
| California 37 | Laura Richardson | Democratic | 2007 | Re-elected | Laura Richardson (D) 68.4% Star Parker (R) 23.2% Nicholas Dibs (I) 8.4% |
| California 38 | Grace Napolitano | Democratic | 1998 | Re-elected | Grace Napolitano (D) 73.5% Robert Vaughn (R) 26.5% |
| California 39 | Linda Sánchez | Democratic | 2002 | Re-elected | Linda Sánchez (D) 63.3% Larry Andre (R) 32.6% John Smith (AI) 4.1% |
| California 40 | Ed Royce | Republican | 1992 | Re-elected | Ed Royce (R) 66.8% Christina Avalos (D) 33.2% |
| California 41 | Jerry Lewis | Republican | 1978 | Re-elected | Jerry Lewis (R) 63.2% Pat Meagher (D) 36.8% Pamela Zander (W/I) 0.0% |
| California 42 | Gary Miller | Republican | 1998 | Re-elected | Gary Miller (R) 62.2% Michael Williamson (D) 31.9% Mark Lambert (L) 5.9% |
| California 43 | Joe Baca | Democratic | 1999 | Re-elected | Joe Baca (D) 65.5% Scott Folkens (R) 34.5% |
| California 44 | Ken Calvert | Republican | 1992 | Re-elected | Ken Calvert (R) 55.6% Bill Hedrick (D) 44.4% |
| California 45 | Mary Bono | Republican | 1998 | Re-elected | Mary Bono Mack (R) 51.5% Steve Pougnet (D) 42.1% Bill Lussenheide (AI) 6.4% |
| California 46 | Dana Rohrabacher | Republican | 1988 | Re-elected | Dana Rohrabacher (R) 62.2% Ken Arnold (D) 37.8% Jay Shah (D-W/I) 0.0% |
| California 47 | Loretta Sanchez | Democratic | 1996 | Re-elected | Loretta Sanchez (D) 53.0% Van Tran (R) 39.3% Ceci Iglesias (I) 7.8% |
| California 48 | John Campbell | Republican | 2005 | Re-elected | John Campbell (R) 59.9% Beth Krom (D) 34.5% Mike Binkley (L) 3.6% |
| California 49 | Darrell Issa | Republican | 2000 | Re-elected | Darrell Issa (R) 62.8% Howard Katz (D) 31.5% Dion Clark (AI) 3.5% Mike Paster (L) 2.3% |
| California 50 | Brian Bilbray | Republican | 2006 | Re-elected | Brian Bilbray (R) 56.6% Francine Busby (D) 39.0% Lars Grossmith (L) 2.2% Miriam Clark (PF) 2.2% |
| California 51 | Bob Filner | Democratic | 1992 | Re-elected | Bob Filner (D) 60.1% Nick Popaditch (R) 39.9% Marcus Shapiro (W/I) 0.0% |
| California 52 | Duncan D. Hunter | Republican | 2008 | Re-elected | Duncan D. Hunter (R) 63.1% Ray Lutz (D) 32.1% Michael Benoit (L) 4.9% |
| California 53 | Susan Davis | Democratic | 2000 | Re-elected | Susan Davis (D) 62.3% Michael Crimmins (R) 34.0% Paul Dekker (L) 3.7% |
Colorado

| District | Incumbent | Party | First elected |
Result | Candidates[77] |
|---|---|---|---|---|---|
| Colorado 1 | Diana DeGette | Democratic | 1996 | Re-elected | Diana DeGette (D) 67.4% Mike Fallon (R) 28.8% Gary Swing (G) 1.4% Clint Jones (L) 1.4% Chris Styskal (C) 1.0% |
| Colorado 2 | Jared Polis | Democratic | 2008 | Re-elected | Jared Polis (D) 57.4% Stephen Bailey (R) 37.9% Jenna Goss (C) 2.7% Curtis Harris (L) 2.0% |
| Colorado 3 | John Salazar | Democratic | 2004 | Lost re-election Republican gain |
Scott Tipton (R) 50.1% John Salazar (D) 45.8% Gregory Gilman (L) 2.2% Jake Segrest (I) 1.9% |
| Colorado 4 | Betsy Markey | Democratic | 2008 | Lost re-election Republican gain |
Cory Gardner (R) 52.5% Betsy Markey (D) 41.4% Doug Aden (C) 4.7% Ken Waskiewicz (I) 1.5% |
| Colorado 5 | Doug Lamborn | Republican | 2006 | Re-elected | Doug Lamborn (R) 65.8% Kevin Bradley (D) 29.3% Brian Scott (C) 2.5% Jerrell Klaver (L) 2.4% |
| Colorado 6 | Mike Coffman | Republican | 2008 | Re-elected | Mike Coffman (R) 65.7% John Flerlage (D) 31.5% Rob McNealy (L) 2.8% |
| Colorado 7 | Ed Perlmutter | Democratic | 2006 | Re-elected | Ed Perlmutter (D) 53.4% Ryan Frazier (R) 41.8% Buck Bailey (L) 4.8% |
Connecticut
| District | Incumbent | Party | First elected |
Result | Candidates[78] |
|---|---|---|---|---|---|
| Connecticut 1 | John Larson | Democratic | 1998 | Re-elected | John Larson (D) 61.3% Ann Brickley (R) 37.2% Kenneth Krayeske (G) 1.1% Christopher Hutchinson (SA) 0.4% |
| Connecticut 2 | Joe Courtney | Democratic | 2006 | Re-elected | Joe Courtney (D) 59.9% Janet Peckinpaugh (R) 38.8% Scott Deshefy (G) 1.3% |
| Connecticut 3 | Rosa DeLauro | Democratic | 1990 | Re-elected | Rosa DeLauro (D) 65.1% Larry Labriola (R) 33.6% Charles Pillsbury (G) 1.3% |
| Connecticut 4 | Jim Himes | Democratic | 2008 | Re-elected | Jim Himes (D) 53.1% Dan Debicella (R) 46.9% |
| Connecticut 5 | Chris Murphy | Democratic | 2006 | Re-elected | Chris Murphy (D) 54.1% Sam Caligiuri (R) 45.9% |
Delaware
| District | Incumbent | Party | First elected |
Result | Candidates[79] |
|---|---|---|---|---|---|
| Delaware at-large | Michael Castle | Republican | 1992 | Retired to run for U.S. Senate Democratic gain |
John Carney (D) 56.8% Glen Urquhart (R) 41.0% Earl Lofland (I) 1.2% Brent Wangen (L) 0.6% Jeffrey Brown (BE) 0.4% |
Florida

| District | Incumbent | Party | First elected |
Result | Candidates[80] |
|---|---|---|---|---|---|
| Florida 1 | Jeff Miller | Republican | 2001 | Re-elected | Jeff Miller (R) 80.0% Joe Cantrell (I) 10.9% John Krause (I) 8.6% Jim Bryan (W-I) 0.6% |
| Florida 2 | Allen Boyd | Democratic | 1996 | Lost re-election Republican gain |
Steve Southerland (R) 53.6% Allen Boyd (D) 41.4% Paul McKain (I) 2.8% Dianne Berryhill (I) 2.2% |
| Florida 3 | Corrine Brown | Democratic | 1992 | Re-elected | Corrine Brown (D) 63.0% Mike Yost (R) 33.9% Terry Martin-Black (I) 3.1% |
| Florida 4 | Ander Crenshaw | Republican | 2000 | Re-elected | Ander Crenshaw (R) 77.2% Troy Stanley (I) 22.8% |
| Florida 5 | Ginny Brown-Waite | Republican | 2002 | Retired Republican hold |
Rich Nugent (R) 67.4% Jim Piccillo (D) 32.6% |
| Florida 6 | Cliff Stearns | Republican | 1988 | Re-elected | Cliff Stearns (R) 71.5% Steve Schonberg (I) 28.5% |
| Florida 7 | John Mica | Republican | 1992 | Re-elected | John Mica (R) 69.0% Heather Beaven (D) 31.0% |
| Florida 8 | Alan Grayson | Democratic | 2008 | Lost re-election Republican gain |
Dan Webster (R) 56.1% Alan Grayson (D) 38.2% Peg Dunmire (Tea) 3.8% George Metcalfe (I) 1.9% |
| Florida 9 | Gus Bilirakis | Republican | 2006 | Re-elected | Gus Bilirakis (R) 71.4% Anita de Palma (D) 28.6% |
| Florida 10 | Bill Young | Republican | 1970 | Re-elected | Bill Young (R) 65.9% Charlie Justice (D) 34.1% |
| Florida 11 | Kathy Castor | Democratic | 2006 | Re-elected | Kathy Castor (D) 59.6% Mike Prendergast (R) 40.4% |
| Florida 12 | Adam Putnam | Republican | 2000 | Retired to run for Florida Agriculture Commissioner Republican hold |
Dennis Ross (R) 48.1% Lori Edwards (D) 41.1% Randy Wilkinson (Tea) 10.7% |
| Florida 13 | Vern Buchanan | Republican | 2006 | Re-elected | Vern Buchanan (R) 68.9% James Golden (D) 31.1% |
| Florida 14 | Connie Mack IV | Republican | 2004 | Re-elected | Connie Mack (R) 68.6% James Lloyd Roach (D) 27.1% William Maverick St. Claire (I) 4.3% |
| Florida 15 | Bill Posey | Republican | 2008 | Re-elected | Bill Posey (R) 64.7% Shannon Roberts (D) 35.3% |
| Florida 16 | Tom Rooney | Republican | 2008 | Re-elected | Tom Rooney (R) 66.9% Jim Horn (D) 33.1% |
| Florida 17 | Kendrick Meek | Democratic | 2002 | Retired to run for U.S. Senate Democratic hold |
Frederica Wilson (D) 86.2% Roderick Vereen (I) 13.8% |
| Florida 18 | Ileana Ros-Lehtinen | Republican | 1989 | Re-elected | Ileana Ros-Lehtinen (R) 68.9% Rolando Banciella (D) 31.1% |
| Florida 19 | Ted Deutch | Democratic | 2010 | Re-elected | Ted Deutch (D) 62.6% Joe Budd (R) 37.3% |
| Florida 20 | Debbie Wasserman Schultz | Democratic | 2004 | Re-elected | Debbie Wasserman Schultz (D) 60.2% Karen Harrington (R) 38.1% Stanley Blumenthal (I) 1.0% Robert Kunst (I) 0.8% |
| Florida 21 | Lincoln Diaz-Balart | Republican | 1992 | Retired Republican hold |
Mario Diaz-Balart (R) unopposed |
| Mario Diaz-Balart (Moved from 25th district) |
Republican | 2002 | Re-elected | ||
| Florida 22 | Ron Klein | Democratic | 2006 | Lost re-election Republican gain |
Allen West (R) 54.4% Ron Klein (D) 45.6% |
| Florida 23 | Alcee Hastings | Democratic | 1992 | Re-elected | Alcee Hastings (D) 79.1% Bernard Sansaricq (R) 20.9% |
| Florida 24 | Suzanne Kosmas | Democratic | 2008 | Lost re-election Republican gain |
Sandy Adams (R) 59.6% Suzanne Kosmas (D) 40.3% |
| Florida 25 | Open seat Incumbent moved to 21st district |
Republican hold | David Rivera (R) 52.2% Joe Garcia (D) 42.6% Roly Arroyo (Tea) 3.0% Craig Porter (FL Whig) 2.2% | ||
Georgia

| District | Incumbent | Party | First elected |
Result | Candidates[81] |
|---|---|---|---|---|---|
| Georgia 1 | Jack Kingston | Republican | 1992 | Re-elected | Jack Kingston (R) 71.6% Oscar Harris (D) 28.4% |
| Georgia 2 | Sanford Bishop | Democratic | 1992 | Re-elected | Sanford Bishop (D) 51.4% Mike Keown (R) 48.6% |
| Georgia 3 | Lynn Westmoreland | Republican | 2004 | Re-elected | Lynn Westmoreland (R) 69.5% Frank Saunders (D) 30.5% |
| Georgia 4 | Hank Johnson | Democratic | 2006 | Re-elected | Hank Johnson (D) 74.7% Liz Carter (R) 25.3% |
| Georgia 5 | John Lewis | Democratic | 1986 | Re-elected | John Lewis (D) 73.7% Fenn Little (R) 26.3% |
| Georgia 6 | Tom Price | Republican | 2004 | Re-elected | Tom Price (R) unopposed |
| Georgia 7 | John Linder | Republican | 1992 | Retired Republican hold |
Rob Woodall (R) 67.1% Doug Heckman (D) 32.9% |
| Georgia 8 | Jim Marshall | Democratic | 2002 | Lost re-election Republican gain |
Austin Scott (R) 52.7% Jim Marshall (D) 47.3% |
| Georgia 9 | Tom Graves | Republican | 2010 | Re-elected | Tom Graves (R) unopposed |
| Georgia 10 | Paul Broun | Republican | 2007 | Re-elected | Paul Broun (R) 67.4% Russell Edwards (D) 32.6% |
| Georgia 11 | Phil Gingrey | Republican | 2002 | Re-elected | Phil Gingrey (R) unopposed |
| Georgia 12 | John Barrow | Democratic | 2004 | Re-elected | John Barrow (D) 56.6% Raymond McKinney (R) 43.4% |
| Georgia 13 | David Scott | Democratic | 2002 | Re-elected | David Scott (D) 69.4% Mike Crane (R) 30.6% |
Hawaii
| District | Incumbent | Party | First elected |
Result | Candidates[82] |
|---|---|---|---|---|---|
| Hawaii 1 | Charles Djou | Republican | 2010 | Lost re-election Democratic gain |
Colleen Hanabusa (D) 53.2% Charles Djou (R) 46.8% |
| Hawaii 2 | Mazie Hirono | Democratic | 2006 | Re-elected | Mazie Hirono (D) 72.2% John Willoughby (R) 25.3% Patric Brock (L) 1.8% Andrew Von Sonn (I) 0.7% |
Idaho

| District | Incumbent | Party | First elected |
Result | Candidates[83] |
|---|---|---|---|---|---|
| Idaho 1 | Walt Minnick | Democratic | 2008 | Lost re-election Republican gain |
Raúl Labrador (R) 51.0% Walt Minnick (D) 41.3% Dave Olson (I) 5.8% Mike Washburn (L) 1.9% |
| Idaho 2 | Mike Simpson | Republican | 1998 | Re-elected | Mike Simpson (R) 68.8% Mike Crawford (D) 24.4% Brian Schad (I) 6.8% |
Illinois
| District | Incumbent | Party | First elected |
Result | Candidates[84] |
|---|---|---|---|---|---|
| Illinois 1 | Bobby Rush | Democratic | 1992 | Re-elected | Bobby Rush (D) 80.3% Ray Wardingley (R) 15.9% Jeff Adams (G) 3.8% |
| Illinois 2 | Jesse Jackson, Jr. | Democratic | 1995 | Re-elected | Jesse Jackson, Jr. (D) 80.5% Isaac C. Hayes (R) 13.8% Anthony Williams (G) 5.7% |
| Illinois 3 | Dan Lipinski | Democratic | 2004 | Re-elected | Dan Lipinski (D) 69.7% Michael Bendas (R) 24.3% Laurel Lambert Schmidt (G) 6.0% |
| Illinois 4 | Luis Gutiérrez | Democratic | 1992 | Re-elected | Luis Gutiérrez (D) 77.4% Israel Vasquez (R) 14.3% Robert J. Burns (G) 8.3% |
| Illinois 5 | Michael Quigley | Democratic | 2009 | Re-elected | Michael Quigley (D) 70.6% David Ratowitz (R) 25.4% Matthew Reichel (G) 4.0% |
| Illinois 6 | Peter Roskam | Republican | 2006 | Re-elected | Peter Roskam (R) 63.7% Benjamin Lowe (D) 36.3% |
| Illinois 7 | Danny Davis | Democratic | 1996 | Re-elected | Danny Davis (D) 81.5% Mark Weiman (R) 16.1% Clarence Desmond Clemons (I) 2.4% |
| Illinois 8 | Melissa Bean | Democratic | 2004 | Lost re-election Republican gain |
Joe Walsh (R) 48.5% Melissa Bean (D) 48.3% Bill Scheurer (G) 3.2% |
| Illinois 9 | Jan Schakowsky | Democratic | 1998 | Re-elected | Jan Schakowsky (D) 66.3% Joel Pollak (R) 31.1% Simon Ribeiro (G) 2.5% |
| Illinois 10 | Mark Kirk | Republican | 2000 | Retired to run for U.S. Senate Republican hold |
Robert Dold (R) 51.1% Daniel Seals (D) 48.9% |
| Illinois 11 | Debbie Halvorson | Democratic | 2008 | Lost re-election Republican gain |
Adam Kinzinger (R) 57.4% Debbie Halvorson (D) 42.6% |
| Illinois 12 | Jerry Costello | Democratic | 1988 | Re-elected | Jerry Costello (D) 59.8% Teri Newman (R) 36.5% Rodger Jennings (G) 3.6% |
| Illinois 13 | Judy Biggert | Republican | 1998 | Re-elected | Judy Biggert (R) 63.8% Scott Harper (D) 36.2% |
| Illinois 14 | Bill Foster | Democratic | 2008 | Lost re-election Republican gain |
Randy Hultgren (R) 51.3% Bill Foster (D) 45.0% Daniel Kairis (G) 3.6% |
| Illinois 15 | Tim Johnson | Republican | 2000 | Re-elected | Tim Johnson (R) 64.3% David Gill (D) 35.7% |
| Illinois 16 | Donald Manzullo | Republican | 1992 | Re-elected | Donald Manzullo (R) 65.0% George Gaulrapp (D) 31.0% Terry Campbell (G) 4.0% |
| Illinois 17 | Phil Hare | Democratic | 2006 | Lost re-election Republican gain |
Bobby Schilling (R) 52.6% Phil Hare (D) 43.0% Roger Davis (G) 4.4% |
| Illinois 18 | Aaron Schock | Republican | 2008 | Re-elected | Aaron Schock (R) 69.1% D.K. Hirner (D) 25.8% Sheldon Schafer (G) 5.1% |
| Illinois 19 | John Shimkus | Republican | 1996 | Re-elected | John Shimkus (R) 71.2% Tim Bagwell (D) 28.8% |
Indiana

| District | Incumbent | Party | First elected |
Result | Candidates[85] |
|---|---|---|---|---|---|
| Indiana 1 | Pete Visclosky | Democratic | 1984 | Re-elected | Pete Visclosky (D) 58.6% Mark Leyva (R) 38.6% Jon Morris (L) 2.8% |
| Indiana 2 | Joe Donnelly | Democratic | 2006 | Re-elected | Joe Donnelly (D) 48.2% Jackie Walorski (R) 46.8% Mark Vogel (L) 5.0% |
| Indiana 3 Special |
Vacant since the May 18, 2010 resignation of Mark Souder (R) | A special election for the remainder of his term ending January 3, 2011 was held on the same day as the general election. Republican hold |
Marlin Stutzman (R) 62.7% Tom Hayhurst (D) 33.1% Scott Wise (L) 4.3% | ||
| Indiana 3 | Vacant Republican hold |
Marlin Stutzman (R) 62.8% Tom Hayhurst (D) 33.1% Scott Wise (L) 4.1% | |||
| Indiana 4 | Steve Buyer | Republican | 1992 | Retired Republican hold |
Todd Rokita (R) 68.6% David Sanders (D) 26.3% John Duncan (L) 5.1% |
| Indiana 5 | Dan Burton | Republican | 1982 | Re-elected | Dan Burton (R) 62.1% Tim Crawford (D) 25.4% Richard Reid (L) 7.8% Jesse Trueblood (I) 4.8% |
| Indiana 6 | Mike Pence | Republican | 2000 | Re-elected | Mike Pence (R) 66.6% Barry Welsh (D) 29.9% T.J. Thompson Jr. (L) 3.5% |
| Indiana 7 | André Carson | Democratic | 2008 | Re-elected | André Carson (D) 58.9% Marvin Scott (R) 37.8% Dav Wilson (L) 3.3% |
| Indiana 8 | Brad Ellsworth | Democratic | 2006 | Retired to run for U.S. Senate Republican gain |
Larry Bucshon (R) 57.6% Trent VanHaaften (D) 37.4% John Cunningham (L) 5.0% |
| Indiana 9 | Baron Hill | Democratic | 2006 | Lost re-election Republican gain |
Todd Young (R) 52.3% Baron Hill (D) 42.3% Greg Knott (L) 5.4% |
Iowa

| District | Incumbent | Party | First elected |
Result | Candidates[86] |
|---|---|---|---|---|---|
| Iowa 1 | Bruce Braley | Democratic | 2006 | Re-elected | Bruce Braley (D) 49.5% Benjamin Lange (R) 47.5% Rob Petsche (L) 1.9% Jason Faulkner (I) 1.0% |
| Iowa 2 | David Loebsack | Democratic | 2006 | Re-elected | David Loebsack (D) 51.0% Mariannette Miller-Meeks (R) 45.9% Gary Sicard (L) 1.9% Jon Tack (C) 1.1% |
| Iowa 3 | Leonard Boswell | Democratic | 1996 | Re-elected | Leonard Boswell (D) 50.7% Brad Zaun (R) 46.5% Rebecca Williamson (SW) 2.6% |
| Iowa 4 | Tom Latham | Republican | 1994 | Re-elected | Tom Latham (R) 65.6% Bill Maske (D) 32.0% Dan Lensing (I) 2.4% |
| Iowa 5 | Steve King | Republican | 2002 | Re-elected | Steve King (R) 65.8% Matthew Campbell (D) 32.3% Martin James Monroe (I) 1.9% |
Kansas

| District | Incumbent | Party | First elected |
Result | Candidates[87] |
|---|---|---|---|---|---|
| Kansas 1 | Jerry Moran | Republican | 1996 | Retired to run for U.S. Senate Republican hold |
Tim Huelskamp (R) 73.7% Alan Jilka (D) 22.8% Jack Warner (L) 3.3% |
| Kansas 2 | Lynn Jenkins | Republican | 2008 | Re-elected | Lynn Jenkins (R) 63.1% Cheryl Hudspeth (D) 32.3% Robert Garrard (L) 4.5% |
| Kansas 3 | Dennis Moore | Democratic | 1998 | Retired Republican gain |
Kevin Yoder (R) 58.4% Stephene Moore (D) 38.6% Jasmin Talbert (L) 2.9% |
| Kansas 4 | Todd Tiahrt | Republican | 1994 | Retired to run for U.S. Senate Republican hold |
Mike Pompeo (R) 58.7% Raj Goyle (D) 36.4% Susan Ducey (Ref) 2.4% Shawn Smith (L) 2.2% |
Kentucky

| District | Incumbent | Party | First elected |
Result | Candidates[88] |
|---|---|---|---|---|---|
| Kentucky 1 | Ed Whitfield | Republican | 1994 | Re-elected | Ed Whitfield (R) 71.2% Charles Kendall Hatchett (D) 28.8% |
| Kentucky 2 | Brett Guthrie | Republican | 2008 | Re-elected | Brett Guthrie (R) 67.9% Ed Marksberry (D) 32.1% |
| Kentucky 3 | John Yarmuth | Democratic | 2006 | Re-elected | John Yarmuth (D) 54.7% Todd Lally (R) 44.0% Edward Martin (L) 0.8% Michael Hansen (I) 0.5% |
| Kentucky 4 | Geoff Davis | Republican | 2004 | Re-elected | Geoff Davis (R) 69.5% John Waltz (D) 30.5% |
| Kentucky 5 | Hal Rogers | Republican | 1980 | Re-elected | Hal Rogers (R) 77.4% Jim Holbert (D) 22.6% |
| Kentucky 6 | Ben Chandler | Democratic | 2004 | Re-elected | Ben Chandler (D) 50.1% Andy Barr (R) 49.8% |
Louisiana

| District | Incumbent | Party | First elected |
Result | Candidates[89] |
|---|---|---|---|---|---|
| Louisiana 1 | Steve Scalise | Republican | 2008 | Re-elected | Steve Scalise (R) 78.5% Myron Katz (D) 19.2% Arden Wells (I) 2.3% |
| Louisiana 2 | Joseph Cao | Republican | 2008 | Lost re-election Democratic gain |
Cedric Richmond (D) 64.6% Joseph Cao (R) 33.5% Anthony Marquize (I) 1.4% Jack Radosta (I) 0.5% |
| Louisiana 3 | Charlie Melancon | Democratic | 2004 | Retired to run for U.S. Senate Republican gain |
Jeff Landry (R) 63.8% Ravi Sangisetty (D) 36.2% |
| Louisiana 4 | John Fleming | Republican | 2008 | Re-elected | John Fleming (R) 62.3% David Melville (D) 32.4% Artis Cash (I) 5.3% |
| Louisiana 5 | Rodney Alexander | Republican | 2002 | Re-elected | Rodney Alexander (R) 78.6% Tom Gibbs (I) 21.4% |
| Louisiana 6 | Bill Cassidy | Republican | 2008 | Re-elected | Bill Cassidy (R) 65.6% Merritt McDonald (D) 34.4% |
| Louisiana 7 | Charles Boustany | Republican | 2004 | Re-elected | Charles Boustany (R) unopposed |
Maine

| District | Incumbent | Party | First elected |
Result | Candidates[90] |
|---|---|---|---|---|---|
| Maine 1 | Chellie Pingree | Democratic | 2008 | Re-elected | Chellie Pingree (D) 56.8% Dean Peter Scontras (R) 43.2% |
| Maine 2 | Mike Michaud | Democratic | 2002 | Re-elected | Mike Michaud (D) 55.1% Jason Levesque (R) 44.9% |
Maryland
| District | Incumbent | Party | First elected |
Result | Candidates[91] |
|---|---|---|---|---|---|
| Maryland 1 | Frank Kratovil | Democratic | 2008 | Lost re-election Republican gain |
Andy Harris (R) 54.1% Frank Kratovil (D) 42.0% Richard James Davis (L) 3.8% |
| Maryland 2 | Dutch Ruppersberger | Democratic | 2002 | Re-elected | Dutch Ruppersberger (D) 64.2% Marcello Cardarelli (R) 33.3% Lorenzo Gaztanaga (L) 2.4% |
| Maryland 3 | John Sarbanes | Democratic | 2006 | Re-elected | John Sarbanes (D) 61.1% Jim Wilhelm (R) 36.0% Jerry McKinley (L) 2.2% Alain Lareau (C) 0.7% |
| Maryland 4 | Donna Edwards | Democratic | 2008 | Re-elected | Donna Edwards (D) 83.4% Robert Broadus (R) 16.4% |
| Maryland 5 | Steny Hoyer | Democratic | 1981 | Re-elected | Steny Hoyer (D) 64.3% Charles Lollar (R) 34.6% Gavin Shickle (L) 1.1% |
| Maryland 6 | Roscoe Bartlett | Republican | 1992 | Re-elected | Roscoe Bartlett (R) 61.5% Andrew Duck (D) 33.2% Dan Massey (L) 2.8% Michael Reed (C) 2.4% |
| Maryland 7 | Elijah Cummings | Democratic | 1996 | Re-elected | Elijah Cummings (D) 75.2% Frank Mirable Jr. (R) 22.8% Scott Spencer (L) 1.9% |
| Maryland 8 | Chris Van Hollen Jr. | Democratic | 2002 | Re-elected | Chris Van Hollen Jr. (D) 73.3% Michael Lee Philips (R) 25.0% Mark Grannis (L) 1.3% Fred Nordhorn (C) 0.3% |
Massachusetts

| District | Incumbent | Party | First elected |
Result | Candidates[92] |
|---|---|---|---|---|---|
| Massachusetts 1 | John Olver | Democratic | 1991 | Re-elected | John Olver (D) 60.0% William Gunn (R) 34.9% Michael Engel (I) 5.1% |
| Massachusetts 2 | Richard Neal | Democratic | 1988 | Re-elected | Richard Neal (D) 57.4% Thomas Wesley (R) 42.6% |
| Massachusetts 3 | Jim McGovern | Democratic | 1996 | Re-elected | Jim McGovern (D) 56.5% Martin Lamb (R) 39.2% Patrick Barron (I) 4.3% |
| Massachusetts 4 | Barney Frank | Democratic | 1980 | Re-elected | Barney Frank (D) 53.9% Sean Bielat (R) 43.4% Susan Allen (I) 1.5% Donald Jordan (I) 1.2% |
| Massachusetts 5 | Niki Tsongas | Democratic | 2007 | Re-elected | Niki Tsongas (D) 54.9% Jonathan Golnik (R) 42.3% Dale Brown (I) 2.0% Robert Clark (I) 0.9% |
| Massachusetts 6 | John Tierney | Democratic | 1996 | Re-elected | John Tierney (D) 56.9% Bill Hudak (R) 43.1% |
| Massachusetts 7 | Ed Markey | Democratic | 1976 | Re-elected | Ed Markey (D) 66.5% Gerry Dembrowski (R) 33.5% |
| Massachusetts 8 | Mike Capuano | Democratic | 1998 | Re-elected | Mike Capuano (D) unopposed |
| Massachusetts 9 | Stephen Lynch | Democratic | 2001 | Re-elected | Stephen Lynch (D) 68.4% Vernon Harrison (R) 26.1% Philip Dunkelbarger (I) 5.6% |
| Massachusetts 10 | Bill Delahunt | Democratic | 1996 | Retired Democratic hold |
William Keating (D) 46.9% Jeff Perry (R) 42.4% Maryanne Lewis (I) 5.9% James Sheets (I) 3.7% Joe Van Nes (I) 1.1% |
Michigan

| District | Incumbent | Party | First elected |
Result | Candidates[93] |
|---|---|---|---|---|---|
| Michigan 1 | Bart Stupak | Democratic | 1992 | Retired Republican gain |
Dan Benishek (R) 51.9% Gary McDowell (D) 40.9% Glenn Wilson (I) 3.4% Pat Lambert (UST) 1.8% Keith Shelton (L) 1.1% Ellis Boal (G) 0.9% |
| Michigan 2 | Pete Hoekstra | Republican | 1992 | Retired to run for Governor Republican hold |
Bill Huizenga (R) 65.3% Fred Johnson (D) 31.6% Jay Gillotte (L) 1.2% Ronald Graeser (UST) 1.0% Lloyd Clarke (G) 0.9% |
| Michigan 3 | Vern Ehlers | Republican | 1993 | Retired Republican hold |
Justin Amash (R) 59.7% Pat Miles (D) 37.5% James Rogers (L) 1.2% Ted Gerrard (UST) 1.0% Charlie Shick (G) 0.7% |
| Michigan 4 | Dave Camp | Republican | 1990 | Re-elected | Dave Camp (R) 66.2% Jerry Campbell (D) 30.5% John Emerick (UST) 1.7% Clint Foster (L) 1.6% |
| Michigan 5 | Dale Kildee | Democratic | 1976 | Re-elected | Dale Kildee (D) 53.0% John Kuipec (R) 44.3% [94] Matt de Heus (G) 1.3% Michael Moon (L) 1.3% |
| Michigan 6 | Fred Upton | Republican | 1986 | Re-elected | Fred Upton (R) 62.0% Don Cooney (D) 33.6% Mel Vaulkner (UST) 1.8% Fred Strand (L) 1.7% Pat Foster (G) 0.9% |
| Michigan 7 | Mark Schauer | Democratic | 2008 | Lost re-election Republican gain |
Tim Walberg (R) 50.2% Mark Schauer (D) 45.4% Scott Aughney (I) 1.6% Greg Merle (L) 1.4% Richard Wunsch (G) 1.4% |
| Michigan 8 | Mike Rogers | Republican | 2000 | Re-elected | Mike Rogers (R) 64.1% Lance Enderle (D) 34.3% Bob Dashairya (L) 1.6% |
| Michigan 9 | Gary Peters | Democratic | 2008 | Re-elected | Gary Peters (D) 49.8% Andrew Raczkowski (R) 47.2% Douglas Campbell (G) 1.0% Adam Goodman (L) 1.0% Bob Gray (I) 0.7% Matthew Kuofie (I) 0.3% |
| Michigan 10 | Candice Miller | Republican | 2002 | Re-elected | Candice Miller (R) 72.0% Henry Yanez (D) 25.0% Claude Beavers (L) 1.6% Candace Caveny (G) 1.4% |
| Michigan 11 | Thad McCotter | Republican | 2002 | Re-elected | Thad McCotter (R) 59.3% Natalie Mosher (D) 38.5% John Tatar (L) 2.2% |
| Michigan 12 | Sander Levin | Democratic | 1982 | Re-elected | Sander Levin (D) 61.1% Don Volaric (R) 35.0% Julia Williams (G) 1.5% Leonard Schwartz (L) 1.1% Lester Townsend (UST) 1.1% Alan Jacquemotte (I) 0.2% |
| Michigan 13 | Carolyn Kilpatrick | Democratic | 1996 | Lost renomination Democratic hold |
Hansen Clarke (D) 79.4% John Hauler (R) 18.5% George Corsetti (G) 0.8% Duane Montgomery (I) 0.7% Heidi Peterson (L) 0.6% |
| Michigan 14 | John Conyers Jr. | Democratic | 1964 | Re-elected | John Conyers Jr. (D) 76.8% Don Ukrainec (R) 19.9% Marc Sosnowski (UST) 2.1% Rick Secula (L) 1.2% |
| Michigan 15 | John Dingell | Democratic | 1955 | Re-elected | John Dingell (D) 56.8% Rob Steele (R) 40.1% Aimee Smith (G) 1.3% Kerry Lee Morgan (L) 0.9% Matthew Furman (UST) 0.9% |
Minnesota
| District | Incumbent | Party | First elected |
Result | Candidates[95] |
|---|---|---|---|---|---|
| Minnesota 1 | Tim Walz | Democratic | 2006 | Re-elected | Tim Walz (D) 49.3% Randy Demmer (R) 44.1% Steven Wilson (IP) 5.3% Lars Johnson (I) 1.2% |
| Minnesota 2 | John Kline | Republican | 2002 | Re-elected | John Kline (R) 63.3% Shelly Madore (D) 36.6% |
| Minnesota 3 | Erik Paulsen | Republican | 2008 | Re-elected | Erik Paulsen (R) 58.8% Jim Meffert (D) 36.6% Jon Oleson (IP) 4.6% |
| Minnesota 4 | Betty McCollum | Democratic | 2000 | Re-elected | Betty McCollum (D) 59.1% Teresa Collett (R) 34.6% Steve Carlson (IP) 6.1% |
| Minnesota 5 | Keith Ellison | Democratic | 2006 | Re-elected | Keith Ellison (D) 67.7% Joel Demos (R) 24.1% Lynn Torgerson (I) 3.7% Tom Schrunk (IP) 3.3% Michael Cavlan (I) 1.1% |
| Minnesota 6 | Michele Bachmann | Republican | 2006 | Re-elected | Michele Bachmann (R) 52.5% Tarryl Clark (D) 39.8% Bob Anderson (IP) 5.8% Aubrey Immelman (I) 1.8% |
| Minnesota 7 | Collin Peterson | Democratic | 1990 | Re-elected | Collin Peterson (D) 55.2% Lee Byberg (R) 37.6% Gene Waldorf (I) 3.9% Glen Menze (IP) 3.3% |
| Minnesota 8 | Jim Oberstar | Democratic | 1974 | Lost re-election Republican gain |
Chip Cravaack (R) 48.2% Jim Oberstar (D) 46.6% Timothy Olson (IP) 4.3% George Burton (C) 0.9% |
Mississippi
| District | Incumbent | Party | First elected |
Result | Candidates[96] |
|---|---|---|---|---|---|
| Mississippi 1 | Travis Childers | Democratic | 2008 | Lost re-election Republican gain |
Alan Nunnelee (R) 55.3% Travis Childers (D) 40.8% Wally Pang (I) 1.0% Les Green (I) 0.9% A. G. Baddley (I) 0.9% Gail Giaranita (C) 0.6% Rico Hoskins (I) 0.2% Harold Taylor (L) 0.2% Barbara Washer (Ref) 0.2% |
| Mississippi 2 | Bennie Thompson | Democratic | 1993 | Re-elected | Bennie Thompson (D) 61.5% Bill Marcy (R) 37.6% Ashley Norwood (Ref) 0.9% |
| Mississippi 3 | Gregg Harper | Republican | 2008 | Re-elected | Gregg Harper (R) 68.0% Joel Gill (D) 31.2% Tracella Lou O'Hara Hill (Ref) 0.8% |
| Mississippi 4 | Gene Taylor | Democratic | 1989 | Lost re-election Republican gain |
Steven Palazzo (R) 51.9% Gene Taylor (D) 46.8% Tim Hampton (L) 0.9% Anna Jewel Revies (Ref) 0.4% |
Missouri
| District | Incumbent | Party | First elected |
Result | Candidates[97] |
|---|---|---|---|---|---|
| Missouri 1 | William Lacy Clay Jr. | Democratic | 2000 | Re-elected | William Lacy Clay, Jr. (D) 73.6% Robyn Hamlin (R) 23.6% Julie Stone (L) 2.8% |
| Missouri 2 | Todd Akin | Republican | 2000 | Re-elected | Todd Akin (R) 67.9% Arthur Lieber (D) 29.2% Steve Mosbacher (L) 2.9% |
| Missouri 3 | Russ Carnahan | Democratic | 2004 | Re-elected | Russ Carnahan (D) 48.9% Ed Martin (R) 46.7% Steven Hedrick (L) 2.8% Nick Ivanovich (C) 1.6% |
| Missouri 4 | Ike Skelton | Democratic | 1976 | Lost re-election Republican gain |
Vicky Hartzler (R) 50.4% Ike Skelton (D) 45.1% Jason Michael Braun (L) 2.7% Greg Cowan (C) 1.7% |
| Missouri 5 | Emanuel Cleaver | Democratic | 2004 | Re-elected | Emanuel Cleaver (D) 53.3% Jacob Turk (R) 44.2% Randy Langkraehr (L) 1.6% Dave Lay (C) 0.9% |
| Missouri 6 | Sam Graves | Republican | 2000 | Re-elected | Sam Graves (R) 69.4% Clint Hylton (D) 30.5% |
| Missouri 7 | Roy Blunt | Republican | 1996 | Retired to run for U.S. Senate Republican hold |
Billy Long (R) 63.4% Scott Eckersley (D) 30.4% Kevin Craig (L) 6.2% |
| Missouri 8 | Jo Ann Emerson | Republican | 1996 | Re-elected | Jo Ann Emerson (R) 65.6% Tommy Sowers (D) 28.8% Larry Bill (I) 3.7% Rick Vandeven (L) 2.0% |
| Missouri 9 | Blaine Luetkemeyer | Republican | 2008 | Re-elected | Blaine Luetkemeyer (R) 77.4% Christopher Dwyer (L) 22.3% Jeff Reed (W-I) 0.4% |
Montana

| District | Incumbent | Party | First elected |
Result | Candidates[98] |
|---|---|---|---|---|---|
| Montana at-large | Denny Rehberg | Republican | 2000 | Re-elected | Denny Rehberg (R) 60.3% Dennis McDonald (D) 33.8% Mike Fellows (L) 5.7% |
Nebraska
| District | Incumbent | Party | First elected |
Result | Candidates[99] |
|---|---|---|---|---|---|
| Nebraska 1 | Jeff Fortenberry | Republican | 2004 | Re-elected | Jeff Fortenberry (R) 71.3% Ivy Harper (D) 28.7% |
| Nebraska 2 | Lee Terry | Republican | 1998 | Re-elected | Lee Terry (R) 60.8% Tom White (D) 39.2% |
| Nebraska 3 | Adrian Smith | Republican | 2006 | Re-elected | Adrian Smith (R) 70.1% Rebekah Davis (D) 17.9% Dan Hill (I) 12.0% |
Nevada

| District | Incumbent | Party | First elected |
Result | Candidates[100] |
|---|---|---|---|---|---|
| Nevada 1 | Shelley Berkley | Democratic | 1998 | Re-elected | Shelley Berkley (D) 61.7% Kenneth A. Wegner (R) 35.3% Jonathan J. Hansen (IA) 1.7% Ed Klapproth (L) 1.3% |
| Nevada 2 | Dean Heller | Republican | 2006 | Re-elected | Dean Heller (R) 63.3% Nancy Price (D) 32.7% Russell Best (IA) 4.0% |
| Nevada 3 | Dina Titus | Democratic | 2008 | Lost re-election Republican gain |
Joe Heck (R) 48.1% Dina Titus (D) 47.5% Barry Michaels (I) 2.4% Joseph P. Silvestri (L) 1.5% Scott David Narder (IA) 0.5% |
New Hampshire

| District | Incumbent | Party | First elected |
Result | Candidates[101] |
|---|---|---|---|---|---|
| New Hampshire 1 | Carol Shea-Porter | Democratic | 2006 | Lost re-election Republican gain |
Frank Guinta (R) 54.0% Carol Shea-Porter (D) 42.4% Philip Hodson (L) 3.5% |
| New Hampshire 2 | Paul Hodes | Democratic | 2006 | Retired to run for U.S. Senate Republican gain |
Charlie Bass (R) 48.3% Ann McLane Kuster (D) 46.8% Tim vanBlommesteyn (I) 2.8% Howard Wilson (L) 2.1% |
New Jersey

| District | Incumbent | Party | First elected |
Result | Candidates[102] |
|---|---|---|---|---|---|
| New Jersey 1 | Rob Andrews | Democratic | 1990 | Re-elected | Rob Andrews (D) 63.2% Dale Glading (R) 34.8% Mark Heacock (G) 1.0% Margaret Chapman (I) 0.7% Nicky Petrutz (I) 0.3% |
| New Jersey 2 | Frank LoBiondo | Republican | 1994 | Re-elected | Frank LoBiondo (R) 65.5% Gary Stein (D) 30.9% Peter Boyce (C) 2.5% Mark Lovett (I) 0.7% Vitov Valdes-Munoz (I) 0.4% |
| New Jersey 3 | John Adler | Democratic | 2008 | Lost re-election Republican gain |
Jon Runyan (R) 50.0% John Adler (D) 47.3% Peter DeStefano (Tea) 1.5% Russ Conger (L) 0.7% Lawrence Donahue (I) 0.5% |
| New Jersey 4 | Chris Smith | Republican | 1980 | Re-elected | Chris Smith (R) 69.4% Howard Kleinhendler (D) 27.9% Joe Siano (L) 1.6% Steven Welzer (G) 0.8% David Meiswinkle (I) 0.3% |
| New Jersey 5 | Scott Garrett | Republican | 2002 | Re-elected | Scott Garrett (R) 65.0% Tod Thiese (D) 32.7% Ed Fanning (G) 1.2% Mark Quick (I) 0.9% James Radigan (I) 0.2% |
| New Jersey 6 | Frank Pallone | Democratic | 1988 | Re-elected | Frank Pallone (D) 54.7% Anna C. Little (R) 43.7% Jack Freudenheim (I) 0.9% Karen Anne Zaletel (I) 0.7% |
| New Jersey 7 | Leonard Lance | Republican | 2008 | Re-elected | Leonard Lance (R) 59.4% Ed Potosnak (D) 40.6% |
| New Jersey 8 | Bill Pascrell | Democratic | 1996 | Re-elected | Bill Pascrell (D) 62.7% Roland Straten (R) 36.1% Raymond Giangrasso (I) 1.2% |
| New Jersey 9 | Steve Rothman | Democratic | 1996 | Re-elected | Steve Rothman (D) 60.7% Michael Agosta (R) 37.8% Patricia Alessandrini (G) 1.4% |
| New Jersey 10 | Don Payne | Democratic | 1988 | Re-elected | Don Payne (D) 85.2% Michael Alonso (R) 12.8% Joanne Miller (I) 1.0% Robert Louis Toussaint (I) 1.0% |
| New Jersey 11 | Rodney Frelinghuysen | Republican | 1994 | Re-elected | Rodney Frelinghuysen (R) 67.2% Douglas Herbert (D) 30.5% Jim Gawron (L) 2.3% |
| New Jersey 12 | Rush Holt | Democratic | 1998 | Re-elected | Rush Holt (D) 53.0% Scott M. Sipprelle (R) 45.9% Kenneth Cody (TVH) 1.1% |
| New Jersey 13 | Albio Sires | Democratic | 2006 | Re-elected | Albio Sires (D) 74.1% Henrietta Dwyer (R) 23.0% Anthony Zanowic (I) 1.8% Maximo Gomez Nacer (I) 1.1% |
New Mexico

| District | Incumbent | Party | First elected |
Result | Candidates[103] |
|---|---|---|---|---|---|
| New Mexico 1 | Martin Heinrich | Democratic | 2008 | Re-elected | Martin Heinrich (D) 51.8% Jon Barela (R) 48.2% |
| New Mexico 2 | Harry Teague | Democratic | 2008 | Lost re-election Republican gain |
Steve Pearce (R) 55.4% Harry Teague (D) 44.6% |
| New Mexico 3 | Ben Lujan | Democratic | 2008 | Re-elected | Ben Lujan (D) 57.0% Tom Mullins (R) 43.0% |
New York

| District | Incumbent | Party | First elected |
Result | Candidates[104] |
|---|---|---|---|---|---|
| New York 1 | Tim Bishop | Democratic | 2002 | Re-elected | Tim Bishop (D) 50.2% Randy Altschuler (R) 49.8% |
| New York 2 | Steve Israel | Democratic | 2000 | Re-elected | Steve Israel (D) 56.4% John Gomez (R) 42.9% Anthony Tolda (C) 0.7% |
| New York 3 | Peter King | Republican | 1992 | Re-elected | Peter King (R) 72.0% Howard Kudler (D) 28.0% |
| New York 4 | Carolyn McCarthy | Democratic | 1996 | Re-elected | Carolyn McCarthy (D) 53.6% Fran Becker (R) 46.4% |
| New York 5 | Gary Ackerman | Democratic | 1983 | Re-elected | Gary Ackerman (D) 63.1% James Milano (R) 36.2% Elizabeth Berney (L) 0.7% |
| New York 6 | Gregory Meeks | Democratic | 1998 | Re-elected | Gregory Meeks (D) 87.8% Asher Taub (R) 12.2% |
| New York 7 | Joseph Crowley | Democratic | 1998 | Re-elected | Joseph Crowley (D) 80.6% Ken Reynolds (R) 18.2% Anthony Gronowicz (G) 1.2% |
| New York 8 | Jerrold Nadler | Democratic | 1992 | Re-elected | Jerrold Nadler (D) 75.5% Susan Kone (R) 24.5% |
| New York 9 | Anthony Weiner | Democratic | 1998 | Re-elected | Anthony Weiner (D) 60.8% Bob Turner (R) 39.2% |
| New York 10 | Ed Towns | Democratic | 1982 | Re-elected | Ed Towns (D) 91.1% Diana Muniz (R) 7.1% Ernest Johnson (Cons) 1.8% |
| New York 11 | Yvette Clarke | Democratic | 2006 | Re-elected | Yvette Clarke (D) 90.6% Hugh Carr (R) 9.4% |
| New York 12 | Nydia Velazquez | Democratic | 1992 | Re-elected | Nydia Velazquez (D) 93.9% Alice Gaffney (Cons) 6.1% |
| New York 13 | Michael McMahon | Democratic | 2008 | Lost re-election Republican gain |
Mike Grimm (R) 51.3% Michael McMahon (D) 48.0% Tom Vendittelli (L) 0.7% |
| New York 14 | Carolyn Maloney | Democratic | 1992 | Re-elected | Carolyn Maloney (D) 75.1% David Brumberg (R) 22.4% Timothy Healy (Cons) 1.3% Dino LaVerghetta (IP) 1.1% |
| New York 15 | Charles Rangel | Democratic | 1970 | Re-elected | Charles Rangel (D) 80.4% Michael Faulkner (R) 10.4% Craig Schley (IP) 6.8% Roger Calero (SW) 2.3% |
| New York 16 | Jose Serrano | Democratic | 1990 | Re-elected | Jose Serrano (D) 96.3% Frank Della Valle (R) 3.7% |
| New York 17 | Eliot Engel | Democratic | 1988 | Re-elected | Eliot Engel (D) 72.9% Anthony Mele (R) 22.8% York Kleinhandler (Cons) 4.3% |
| New York 18 | Nita Lowey | Democratic | 1988 | Re-elected | Nita Lowey (D) 62.2% James Russell (R) 37.8% |
| New York 19 | John Hall | Democratic | 2006 | Lost re-election Republican gain |
Nan Hayworth (R) 52.7% John Hall (D) 47.3% |
| New York 20 | Scott Murphy | Democratic | 2009 | Lost re-election Republican gain |
Chris Gibson (R) 54.9% Scott Murphy (D) 45.1% |
| New York 21 | Paul Tonko | Democratic | 2008 | Re-elected | Paul Tonko (D) 59.3% Theodore Danz (R) 40.7% |
| New York 22 | Maurice Hinchey | Democratic | 1992 | Re-elected | Maurice Hinchey (D) 52.7% George Phillips (R) 47.3% |
| New York 23 | Bill Owens | Democratic | 2009 | Re-elected | Bill Owens (D) 47.5% Matt Doheny (R) 46.4% Doug Hoffman (Cons) 6.1% |
| New York 24 | Mike Arcuri | Democratic | 2006 | Lost re-election Republican gain |
Richard L. Hanna (R) 53.1% Mike Arcuri (D) 46.9% |
| New York 25 | Dan Maffei | Democratic | 2008 | Lost re-election Republican gain |
Ann Marie Buerkle (R) 50.2% Dan Maffei (D) 49.8% |
| New York 26 | Chris Lee | Republican | 2008 | Re-elected | Chris Lee (R) 73.6% Philip Fedele (D) 26.4% |
| New York 27 | Brian Higgins | Democratic | 2004 | Re-elected | Brian Higgins (D) 60.9% Leonard Roberto (R) 39.1% |
| New York 28 | Louise Slaughter | Democratic | 1986 | Re-elected | Louise Slaughter (D) 64.9% Jill Rowland (R) 35.1% |
| New York 29 | vacant* | Republican gain |
Tom Reed (R) 56.6% Matthew Zeller (D) 43.4% |
- Democrat Eric Massa resigned on March 8, 2010. A special election for the remainder of his term in the 111th Congress was held on the same day as the general election, which Reed won.
North Carolina

| District | Incumbent | Party | First elected |
Result | Candidates[105] |
|---|---|---|---|---|---|
| North Carolina 1 | G. K. Butterfield | Democratic | 2004 | Re-elected | G.K. Butterfield (D) 59.3% Ashley Woolard (R) 40.7% |
| North Carolina 2 | Bob Etheridge | Democratic | 1996 | Lost re-election Republican gain |
Renee Ellmers (R) 49.5% Bob Etheridge (D) 48.7% Tom Rose (L) 1.8% |
| North Carolina 3 | Walter Jones Jr. | Republican | 1994 | Re-elected | Walter Jones (R) 71.9% Johnny Rouse (D) 25.7% Darryl Holloman (L) 2.4% |
| North Carolina 4 | David Price | Democratic | 1996 | Re-elected | David Price (D) 57.2% B.J. Lawson (R) 42.8% |
| North Carolina 5 | Virginia Foxx | Republican | 2004 | Re-elected | Virginia Foxx (R) 65.9% William Kennedy (D) 34.1% |
| North Carolina 6 | Howard Coble | Republican | 1984 | Re-elected | Howard Coble (R) 75.2% Gregory Scott Turner (D) 24.8% |
| North Carolina 7 | Mike McIntyre | Democratic | 1996 | Re-elected | Mike McIntyre (D) 53.7% Ilario Pantano (R) 46.3% |
| North Carolina 8 | Larry Kissell | Democratic | 2008 | Re-elected | Larry Kissell (D) 53.0% Harold Johnson (R) 43.7% Thomas Hill (L) 3.0% |
| North Carolina 9 | Sue Myrick | Republican | 1994 | Re-elected | Sue Myrick (R) 69.0% Jeff Doctor (D) 31.0% |
| North Carolina 10 | Patrick McHenry | Republican | 2004 | Re-elected | Patrick McHenry (R) 71.2% Jeff Gregory (D) 28.8% |
| North Carolina 11 | Heath Shuler | Democratic | 2006 | Re-elected | Heath Shuler (D) 54.3% Jeff Miller (R) 45.7% |
| North Carolina 12 | Mel Watt | Democratic | 1992 | Re-elected | Mel Watt (D) 63.9% Greg Dority (R) 34.1% Lon Vernon Cecil (L) 2.0% |
| North Carolina 13 | Brad Miller | Democratic | 2002 | Re-elected | Brad Miller (D) 55.5% William Randall (R) 44.5% |
North Dakota

| District | Incumbent | Party | First elected |
Result | Candidates[106] |
|---|---|---|---|---|---|
| North Dakota at-large | Earl Pomeroy | Democratic-NPL | 1992 | Lost re-election Republican gain |
Rick Berg (R) 54.7% Earl Pomeroy (D-NPL) 44.9% |
Ohio

| District | Incumbent | Party | First elected |
Result | Candidates[107] |
|---|---|---|---|---|---|
| Ohio 1 | Steve Driehaus | Democratic | 2008 | Lost re-election Republican gain |
Steve Chabot (R) 51.5% Steve Driehaus (D) 46.0% Jim Berns (L) 1.5% Rich Stevenson (G) 1.0% |
| Ohio 2 | Jean Schmidt | Republican | 2005 | Re-elected | Jean Schmidt (R) 58.5% Surya Yalamanchili (D) 34.7% Marc Johnston (L) 6.8% |
| Ohio 3 | Mike Turner | Republican | 2002 | Re-elected | Mike Turner (R) 68.1% Joe Roberts (D) 31.9% |
| Ohio 4 | Jim Jordan | Republican | 2006 | Re-elected | Jim Jordan (R) 71.5% Doug Litt (D) 24.7% Donald Kissick (L) 3.8% |
| Ohio 5 | Bob Latta | Republican | 2007 | Re-elected | Bob Latta (R) 67.8% Caleb Finkenbiner (D) 26.5% Brian Smith (L) 5.7% |
| Ohio 6 | Charlie Wilson | Democratic | 2006 | Lost re-election Republican gain |
Bill Johnson (R) 50.2% Charlie Wilson (D) 45.1% Richard Cadle (C) 2.5% Martin Elsass (L) 2.2% |
| Ohio 7 | Steve Austria | Republican | 2008 | Re-elected | Steve Austria (R) 62.2% Bill Conner (D) 32.3% John Anderson (L) 4.3% David Easton (C) 1.3% |
| Ohio 8 | John Boehner | Republican | 1990 | Re-elected | John Boehner (R) 65.6% Justin Coussoule (D) 30.3% David Harlow (L) 2.4% James Condit (C) 1.7% |
| Ohio 9 | Marcy Kaptur | Democratic | 1982 | Re-elected | Marcy Kaptur (D) 59.4% Rich Iott (R) 40.6% |
| Ohio 10 | Dennis Kucinich | Democratic | 1996 | Re-elected | Dennis Kucinich (D) 53.0% Peter Corrigan (R) 43.9% Jeff Goggins (L) 3.1% |
| Ohio 11 | Marcia Fudge | Democratic | 2008 | Re-elected | Marcia Fudge (D) 82.9% Thomas Pekarek (R) 17.1% |
| Ohio 12 | Pat Tiberi | Republican | 2000 | Re-elected | Pat Tiberi (R) 55.8% Paula Brooks (D) 40.9% Travis Irvine (L) 3.2% |
| Ohio 13 | Betty Sutton | Democratic | 2006 | Re-elected | Betty Sutton (D) 55.7% Tom Ganley (R) 44.3% |
| Ohio 14 | Steve LaTourette | Republican | 1994 | Re-elected | Steve LaTourette (R) 64.9% William O'Neill (D) 31.5% John Jelenic (L) 3.6% |
| Ohio 15 | Mary Jo Kilroy | Democratic | 2008 | Lost re-election Republican gain |
Steve Stivers (R) 54.1% Mary Jo Kilroy (D) 41.3% William Kammerer (L) 2.8% David Ryon (C) 1.8% |
| Ohio 16 | John Boccieri | Democratic | 2008 | Lost re-election Republican gain |
Jim Renacci (R) 52.1% John Boccieri (D) 41.3% Jeffrey Blevins (L) 6.6% |
| Ohio 17 | Tim Ryan | Democratic | 2002 | Re-elected | Tim Ryan (D) 53.9% Jim Graham (R) 30.1% Jim Traficant (I) 16.0% |
| Ohio 18 | Zack Space | Democratic | 2006 | Lost re-election Republican gain |
Bob Gibbs (R) 53.9% Zack Space (D) 40.5% Lindsey Dean Sutton (C) 5.6% |
Oklahoma

| District | Incumbent | Party | First elected |
Result | Candidates[108] |
|---|---|---|---|---|---|
| Oklahoma 1 | John Sullivan | Republican | 2002 | Re-elected | John Sullivan (R) 76.8% Angelia O'Dell (I) 23.2% |
| Oklahoma 2 | Dan Boren | Democratic | 2004 | Re-elected | Dan Boren (D) 56.5% Charles Thompson (R) 43.5% |
| Oklahoma 3 | Frank Lucas | Republican | 1994 | Re-elected | Frank Lucas (R) 78.0% Frankie Robbins (D) 22.0% |
| Oklahoma 4 | Tom Cole | Republican | 2002 | Re-elected | Tom Cole (R) unopposed |
| Oklahoma 5 | Mary Fallin | Republican | 2006 | Retired to run for Governor Republican hold |
James Lankford (R) 62.5% Billy Coyle (D) 34.5% Clark Duffe (I) 1.6% Dave White (I) 1.4% |
Oregon

| District | Incumbent | Party | First elected |
Result | Candidates[109] |
|---|---|---|---|---|---|
| Oregon 1 | David Wu | Democratic | 1998 | Re-elected | David Wu (D) 54.8% Rob Cornilles (R) 42.0% Don LaMunyon (C) 1.3% Chris Henry (PG) 1.0% Joe Tabor (L) 0.9% |
| Oregon 2 | Greg Walden | Republican | 1998 | Re-elected | Greg Walden (R) 74.1% Joyce Segers (D) 25.9% |
| Oregon 3 | Earl Blumenauer | Democratic | 1996 | Re-elected | Earl Blumenauer (D) 70.1% Delia Lopez (R) 24.6% Jeff Lawrence (L) 3.0% Michael Meo (PG) 2.3% |
| Oregon 4 | Peter DeFazio | Democratic | 1986 | Re-elected | Peter DeFazio (D) 54.6% Art Robinson (R) 43.7% Mike Beilstein (PG) 1.7% |
| Oregon 5 | Kurt Schrader | Democratic | 2008 | Re-elected | Kurt Schrader (D) 51.3% Scott Bruun (R) 46.0% Chris Lugo (PG) 2.7% |
Pennsylvania

| District | Incumbent | Party | First elected |
Result | Candidates[110] |
|---|---|---|---|---|---|
| Pennsylvania 1 | Bob Brady | Democratic | 1998 | Re-elected | Bob Brady (D) unopposed |
| Pennsylvania 2 | Chaka Fattah | Democratic | 1994 | Reelected | Chaka Fattah (D) 89.3% Rick Hellberg (R) 10.7% |
| Pennsylvania 3 | Kathy Dahlkemper | Democratic | 2008 | Lost reelection Republican gain |
Mike Kelly (R) 55.7% Kathy Dahlkemper (D) 44.3% |
| Pennsylvania 4 | Jason Altmire | Democratic | 2006 | Reelected | Jason Altmire (D) 50.8% Keith Rothfuss (R) 49.2% |
| Pennsylvania 5 | G.T. Thompson | Republican | 2008 | Reelected | G.T. Thompson (R) 68.7% Michael Pipe (D) 28.2% Vernon Etzel (L) 3.1% |
| Pennsylvania 6 | Jim Gerlach | Republican | 2002 | Reelected | Jim Gerlach (R) 57.1% Manan Trivedi (D) 42.9% |
| Pennsylvania 7 | Joe Sestak | Democratic | 2006 | Retired to run for U.S. Senate Republican gain |
Pat Meehan (R) 54.9% Bryan Lentz (D) 44.0% Jim Schneller (I) 1.1% |
| Pennsylvania 8 | Patrick Murphy | Democratic | 2006 | Lost reelection Republican gain |
Mike Fitzpatrick (R) 53.5% Patrick Murphy (D) 46.5% |
| Pennsylvania 9 | Bill Shuster | Republican | 2001 | Reelected | Bill Shuster (R) 73.1% Tom Conners (D) 26.9% |
| Pennsylvania 10 | Chris Carney | Democratic | 2006 | Lost reelection Republican gain |
Tom Marino (R) 55.2% Chris Carney (D) 44.8% |
| Pennsylvania 11 | Paul Kanjorski | Democratic | 1984 | Lost reelection Republican gain |
Lou Barletta (R) 54.7% Paul Kanjorski (D) 45.3% |
| Pennsylvania 12 | Mark Critz | Democratic | 2010 | Reelected | Mark Critz (D) 50.8% Tim Burns (R) 49.2% |
| Pennsylvania 13 | Allyson Schwartz | Democratic | 2004 | Reelected | Allyson Schwartz (D) 56.3% Dee Adcock (R) 43.7% |
| Pennsylvania 14 | Mike Doyle | Democratic | 1994 | Reelected | Mike Doyle (D) 68.8% Melissa Haluszczak (R) 28.2% Ed Bortz (G) 3.0% |
| Pennsylvania 15 | Charlie Dent | Republican | 2004 | Reelected | Charlie Dent (R) 53.5% John Callahan (D) 39.0% Jake Towne (I) 7.5% |
| Pennsylvania 16 | Joe Pitts | Republican | 1996 | Reelected | Joe Pitts (R) 65.4% Lois Herr (D) 34.6% |
| Pennsylvania 17 | Tim Holden | Democratic | 1992 | Reelected | Tim Holden (D) 55.5% Dave Argall (R) 44.5% |
| Pennsylvania 18 | Tim Murphy | Republican | 2002 | Reelected | Tim Murphy (R) 67.3% Dan Connolly (D) 32.7% |
| Pennsylvania 19 | Todd Platts | Republican | 2000 | Reelected | Todd Platts (R) 71.9% Ryan Sanders (D) 23.3% Joshua Monighan (I) 4.8% |
Rhode Island
| District | Incumbent | Party | First elected |
Result | Candidates[111] |
|---|---|---|---|---|---|
| Rhode Island 1 | Patrick Kennedy | Democratic | 1994 | Retired Democratic hold |
David Cicilline (D) 50.6% John Loughlin (R) 44.6% Kenneth Capalbo (I) 4.0% Gregory Raposa (I) 0.8% |
| Rhode Island 2 | Jim Langevin | Democratic | 2000 | Reelected | Jim Langevin (D) 59.9% Mark Zaccaria (R) 31.8% John Matson (I) 8.4% |
South Carolina

| District | Incumbent | Party | First elected |
Result | Candidates[112] |
|---|---|---|---|---|---|
| South Carolina 1 | Henry Brown, Jr. | Republican | 2000 | Retired Republican hold |
Tim Scott (R) 65.4% Ben Frasier (D) 28.7% Robert Burton (WF) 1.8% Bob Dobbs (G) 1.4% Keith Blandford (L) 1.2% Jimmy Wood (Ind) 1.1% Mac McCullough (UC) 0.4% |
| South Carolina 2 | Joe Wilson | Republican | 2001 | Reelected | Joe Wilson (R) 53.5% Rob Miller (D) 43.8% Eddie McCain (L) 1.6% Marc Beaman (C) 1.1% |
| South Carolina 3 | J. Gresham Barrett | Republican | 2002 | Retired to run for Governor Republican hold |
Jeff Duncan (R) 62.5% Jane Ballard Dyer (D) 36.2% John Dalen (C) 1.3% |
| South Carolina 4 | Bob Inglis | Republican | 2004 | Lost renomination Republican hold |
Trey Gowdy (R) 63.5% Paul Corden (D) 28.8% Dave Edwards (C) 5.1% Rick Mahler (L) 1.4% Faye Walters (G) 1.2% |
| South Carolina 5 | John Spratt | Democratic | 1982 | Lost reelection Republican gain |
Mick Mulvaney (R) 55.1% John Spratt (D) 44.9% |
| South Carolina 6 | Jim Clyburn | Democratic | 1992 | Reelected | Jim Clyburn (D) 62.9% Jim Pratt (R) 36.4% Nammu Muhammad (G) 0.7% |
South Dakota

| District | Incumbent | Party | First elected |
Result | Candidates[113] |
|---|---|---|---|---|---|
| South Dakota at-large | Stephanie Herseth Sandlin | Democratic | 2004 | Lost reelection Republican gain |
Kristi Noem (R) 48.1% Stephanie Herseth Sandlin (D) 45.9% Thomas Marking (I) 6.0% |
Tennessee

| District | Incumbent | Party | First elected |
Result | Candidates[114] |
|---|---|---|---|---|---|
| Tennessee 1 | Phil Roe | Republican | 2008 | Reelected | Phil Roe (R) 80.8% Michael Clark (D) 17.1% Kermit Steck (I) 2.1% |
| Tennessee 2 | Jimmy Duncan Jr. | Republican | 1998 | Reelected | Jimmy Duncan Jr. (R) 81.7% Dave Hancock (D) 14.7% Joseph Leinweber Jr. (I) 1.4% Andy Andrew (I) 1.2% Greg Samples (I) 0.7% H. Headings (I) 0.3% |
| Tennessee 3 | Zach Wamp | Republican | 1994 | Retired to run for Governor Republican hold |
Charles Fleischmann (R) 56.8% John Wolfe Jr. (D) 28.0% Savas Kyriakidis (I) 10.5% Mark DeVol (I) 3.6% Don Barkman (I) 0.5% Gregory Goodwin (I) 0.2% Robert Humphries (I) 0.2% Mo Kiah (I) 0.1% |
| Tennessee 4 | Lincoln Davis | Democratic | 2002 | Lost reelection Republican gain |
Scott DesJarlais (R) 57.1% Lincoln Davis (D) 38.6% Paul Curtis (I) 1.7% Gerald York (I) 1.2% James Gray (I) 0.9% Richard Johnson (I) 0.5% |
| Tennessee 5 | Jim Cooper | Democratic | 2002 | Reelected | Jim Cooper (D) 56.2% David Hall (R) 42.1% Stephen Collings (I) 0.3% Jacqueline Miller (I) 0.3% John Smith (I) 0.3% William Crook (I) 0.2% John Miglietta (I) 0.2% James Whitfield II (I) 0.2% Nathan Harden (I) 0.1% Joe Moore (I) 0.1% Thomas Taylor (I) 0.1% |
| Tennessee 6 | Bart Gordon | Democratic | 1984 | Retired Republican gain |
Diane Black (R) 67.3% Brett Carter (D) 29.4% Jim Boyd (I) 1.1% Tommy Hay (I) 0.7% David Purcell (I) 0.7% Brandon Gore (I) 0.6% Stephen Sprague (I) 0.3% |
| Tennessee 7 | Marsha Blackburn | Republican | 2002 | Reelected | Marsha Blackburn (R) 72.4% Greg Rabidoux (D) 24.8% Bill Stone (I) 2.9% |
| Tennessee 8 | John Tanner | Democratic | 1988 | Retired Republican gain |
Stephen Fincher (R) 59.0% Roy Herron (D) 38.8% Donn Janes (I) 1.5% Mark Rawles (I) 0.7% |
| Tennessee 9 | Steve Cohen | Democratic | 2006 | Reelected | Steve Cohen (D) 74.0% Charlotte Bergmann (R) 25.1% Sandra Sullivan (I) 0.5% Perry Steele (I) 0.4% |
Texas

| District | Incumbent | Party | First elected |
Result | Candidates[115] |
|---|---|---|---|---|---|
| Texas 1 | Louie Gohmert | Republican | 2004 | Reelected | Louie Gohmert (R) 89.7% Charles Parkes (L) 10.3% |
| Texas 2 | Ted Poe | Republican | 2004 | Reelected | Ted Poe (R) 88.6 David Smith (L) 11.4% |
| Texas 3 | Sam Johnson | Republican | 1991 | Reelected | Sam Johnson (R) 66.3% John Lingenfelder (D) 31.3% Christopher Claytor (L) 2.4% |
| Texas 4 | Ralph Hall | Republican | 1980 | Reelected | Ralph Hall (R) 73.2% VaLinda Hathcox (D) 22.0% Jim Prindle (L) 2.5% Shane Shepard (I) 2.3% |
| Texas 5 | Jeb Hensarling | Republican | 2002 | Reelected | Jeb Hensarling (R) 70.5% Tom Berry (D) 27.5% Ken Ashby (L) 2.0% |
| Texas 6 | Joe Barton | Republican | 1984 | Reelected | Joe Barton (R) 65.9% David Cozad (D) 31.2% Byron Severns (L) 2.9% |
| Texas 7 | John Culberson | Republican | 2000 | Reelected | John Culberson (R) 81.4% Bob Townsend (L) 18.0% Lisa Squiers (W-I) 0.6% |
| Texas 8 | Kevin Brady | Republican | 1996 | Reelected | Kevin Brady (R) 80.3% Kent Hargett (D) 17.2% Bruce West (L) 2.5% |
| Texas 9 | Al Green | Democratic | 2004 | Reelected | Al Green (D) 75.7% Steve Mueller (R) 22.9% Michael Hope (L) 1.4% |
| Texas 10 | Michael McCaul | Republican | 2004 | Reelected | Michael McCaul (R) 64.7% Ted Ankrum (D) 33.0% J.P. Perkins (L) 2.3% |
| Texas 11 | Mike Conaway | Republican | 2004 | Reelected | Mike Conaway (R) 80.8% James Quillan (D) 15.4% James Powell (L) 2.8% Jim Howe (G) 0.9% |
| Texas 12 | Kay Granger | Republican | 1996 | Reelected | Kay Granger (R) 71.9% Tracey Smith (D) 25.1% Matthew Sodolow (L) 3.0% |
| Texas 13 | Mac Thornberry | Republican | 1994 | Reelected | Mac Thornberry (R) 87.1% Keith Dyer (I) 8.6% John Burwell (L) 4.3% |
| Texas 14 | Ron Paul | Republican | 1996 | Reelected | Ron Paul (R) 76.0% Robert Pruett (D) 24.0% |
| Texas 15 | Ruben Hinojosa | Democratic | 1996 | Reelected | Ruben Hinojosa (D) 55.7% Eddie Zamora (R) 41.6% Aaron Cohn (L) 2.7% |
| Texas 16 | Silvestre Reyes | Democratic | 1996 | Reelected | Silvestre Reyes (D) 58.1% Tim Besco (R) 36.6% Bill Collins (L) 5.1% Tim Collins (W-I) 0.3% |
| Texas 17 | Chet Edwards | Democratic | 1990 | Lost reelection Republican gain |
Bill Flores (R) 61.8% Chet Edwards (D) 36.6% Richard Kelly (L) 1.6% |
| Texas 18 | Sheila Jackson Lee | Democratic | 1994 | Reelected | Sheila Jackson Lee (D) 70.1% John Faulk (R) 27.3% Mike Taylor (L) 2.6% |
| Texas 19 | Randy Neugebauer | Republican | 2002 | Reelected | Randy Neugebauer (R) 77.7% Andy Wilson (D) 19.1% Chip Peterson (L) 3.2% |
| Texas 20 | Charlie Gonzalez | Democratic | 1998 | Reelected | Charlie Gonzalez (D) 63.6% Clayton Trotter (R) 34.5% Michael Idrogo (L) 1.9% |
| Texas 21 | Lamar Smith | Republican | 1986 | Reelected | Lamar Smith (R) 68.9% Laney Melnick (D) 27.9% James Arthur Strohm (L) 3.2% |
| Texas 22 | Pete Olson | Republican | 2008 | Reelected | Pete Olson (R) 67.5% Kesha Rogers (D) 29.8% Steven Susman (L) 2.7% |
| Texas 23 | Ciro Rodriguez | Democratic | 2006 | Lost reelection Republican gain |
Quico Canseco (R) 49.4% Ciro Rodriguez (D) 44.4% Craig Stephens (I) 3.6% Martin Nitschke (L) 1.6% Ed Scharf (G) 0.9% |
| Texas 24 | Kenny Marchant | Republican | 2004 | Reelected | Kenny Marchant (R) 81.6% David Sparks (L) 18.4% |
| Texas 25 | Lloyd Doggett | Democratic | 1994 | Reelected | Lloyd Doggett (D) 52.8% Donna Campbell (R) 44.8% Jim Stutsman (L) 2.3% |
| Texas 26 | Michael Burgess | Republican | 2002 | Reelected | Michael Burgess (R) 67.1% Neil Durrance (D) 30.7% Mark Boler (L) 2.2% |
| Texas 27 | Solomon Ortiz | Democratic | 1982 | Lost reelection Republican gain |
Blake Farenthold (R) 47.9% Solomon Ortiz (D) 47.1% Ed Mishou (L) 5.0% |
| Texas 28 | Henry Cuellar | Democratic | 2004 | Reelected | Henry Cuellar (D) 56.3% Bryan Underwood (R) 42.0% Stephen Kaat (L) 1.7% |
| Texas 29 | Gene Green | Democratic | 1992 | Reelected | Gene Green (D) 64.6% Roy Morales (R) 34.1% Brad Walters (L) 1.3% |
| Texas 30 | Eddie Bernice Johnson | Democratic | 1992 | Reelected | Eddie Bernice Johnson (D) 75.7% Stephen Broden (R) 21.6% J. B. Oswalt (L) 2.6% |
| Texas 31 | John Carter | Republican | 2002 | Reelected | John Carter (R) 82.5% Bill Oliver (L) 17.5% |
| Texas 32 | Pete Sessions | Republican | 1996 | Reelected | Pete Sessions (R) 62.6% Grier Raggio (D) 34.9% John Jay Myers (L) 2.5% |
Utah

| District | Incumbent | Party | First elected |
Result | Candidates[116] |
|---|---|---|---|---|---|
| Utah 1 | Rob Bishop | Republican | 2002 | Reelected | Rob Bishop (R) 69.2% Morgan Bowen (D) 23.9% Kirk Pearson (C) 4.7% Jared Paul Stratton (L) 2.2% |
| Utah 2 | Jim Matheson | Democratic | 2000 | Reelected | Jim Matheson (D) 50.5% Morgan Philpot (R) 46.1% Randall Hinton (C) 1.8% Dave Glissmeyer (I) 0.9% Wayne Hill (I) 0.7% |
| Utah 3 | Jason Chaffetz | Republican | 2008 | Reelected | Jason Chaffetz (R) 72.3% Karen Hyer (D) 22.9% Douglas Sligting (C) 2.4% Jake Shannon (L) 1.5% Joseph Puente (I) 0.8% |
Vermont

| District | Incumbent | Party | First elected |
Result | Candidates[117] |
|---|---|---|---|---|---|
| Vermont at-large | Peter Welch | Democratic | 2006 | Reelected | Peter Welch (D) 64.6% Paul Beaudry (R) 32.0% Gus Jaccaci (I) 2.0% Jane Newton (S) 1.4% |
Virginia
| District | Incumbent | Party | First elected |
Result | Candidates[118] |
|---|---|---|---|---|---|
| Virginia 1 | Rob Wittman | Republican | 2007 | Reelected | Rob Wittman (R) 63.9% Krystal Ball (D) 34.8% Glenda Gail Parker (IG) 1.2% |
| Virginia 2 | Glenn Nye | Democratic | 2008 | Lost reelection Republican gain |
Scott Rigell (R) 53.1% Glenn Nye (D) 42.5% Kenny Golden (I) 4.3% |
| Virginia 3 | Bobby Scott | Democratic | 1992 | Reelected | Bobby Scott (D) 70.0% Chuck Smith (R) 27.2% James Quigley (L) 1.5% John D. Kelly (I) 1.2% |
| Virginia 4 | Randy Forbes | Republican | 2001 | Reelected | Randy Forbes (R) 62.3% Wynne LeGrow (D) 37.5% |
| Virginia 5 | Tom Perriello | Democratic | 2008 | Lost reelection Republican gain |
Robert Hurt (R) 50.8% Tom Perriello (D) 47.0% Jeffrey Clark (I) 2.1% |
| Virginia 6 | Bob Goodlatte | Republican | 1992 | Reelected | Bob Goodlatte (R) 76.3% Jeffrey Vanke (I) 13.0% Stuart Bain (L) 9.2% |
| Virginia 7 | Eric Cantor | Republican | 2000 | Reelected | Eric Cantor (R) 59.2% Rick Waugh (D) 34.1% Floyd Bayne (IG) 6.5% |
| Virginia 8 | Jim Moran | Democratic | 1990 | Reelected | Jim Moran (D) 61.0% Patrick Murphy (R) 37.3% Ron Fisher (IG) 1.4% |
| Virginia 9 | Rick Boucher | Democratic | 1982 | Lost reelection Republican gain |
Morgan Griffith (R) 51.2% Rick Boucher (D) 46.4% Jeremiah Heaton (I) 2.3% |
| Virginia 10 | Frank Wolf | Republican | 1980 | Reelected | Frank Wolf (R) 62.9% Jeff Barnett (D) 34.8% William Redpath (L) 2.2% |
| Virginia 11 | Gerry Connolly | Democratic | 2008 | Reelected | Gerry Connolly (D) 49.2% Keith Fimian (R) 48.8% Chris DeCarlo (I) 0.8% David Dotson (L) 0.6% David Gillis (IG) 0.4% |
Washington

| District | Incumbent | Party | First elected |
Result | Candidates[119] |
|---|---|---|---|---|---|
| Washington 1 | Jay Inslee | Democratic | 1998 | Reelected | Jay Inslee (D) 57.7% James Watkins (R) 42.3% |
| Washington 2 | Rick Larsen | Democratic | 2000 | Reelected | Rick Larsen (D) 51.1% John Koster (R) 48.9% |
| Washington 3 | Brian Baird | Democratic | 1998 | Retired Republican gain |
Jaime Herrera (R) 53.0% Denny Heck (D) 47.0% |
| Washington 4 | Doc Hastings | Republican | 1994 | Reelected | Doc Hastings (R) 67.6% Jay Clough (D) 32.4% |
| Washington 5 | Cathy McMorris Rodgers | Republican | 2004 | Reelected | Cathy McMorris Rodgers (R) 63.7% Daryl Romeyn (D) 36.3% |
| Washington 6 | Norm Dicks | Democratic | 1976 | Reelected | Norm Dicks (D) 58.0% Doug Cloud (R) 42.0% |
| Washington 7 | Jim McDermott | Democratic | 1988 | Reelected | Jim McDermott (D) 83.0% Bob Jeffers-Schroder (I) 17.0% |
| Washington 8 | Dave Reichert | Republican | 2004 | Reelected | Dave Reichert (R) 52.1% Suzan DelBene (D) 47.9% |
| Washington 9 | Adam Smith | Democratic | 1996 | Reelected | Adam Smith (D) 54.9% Dick Muri (R) 45.1% |
West Virginia
| District | Incumbent | Party | First elected |
Result | Candidates[120] |
|---|---|---|---|---|---|
| West Virginia 1 | Alan Mollohan | Democratic | 1982 | Lost renomination Republican gain |
David McKinley (R) 50.4% Mike Oliverio (D) 49.6% |
| West Virginia 2 | Shelley Capito | Republican | 2000 | Reelected | Shelley Capito (R) 68.5% Virginia Lynch Graf (D) 29.7% Phil Hudok (C) 1.8% |
| West Virginia 3 | Nick Rahall | Democratic | 1976 | Reelected | Nick Rahall (D) 56.0% Spike Maynard (R) 44.0% |
Wisconsin
| District | Incumbent | Party | First elected |
Result | Candidates[121] |
|---|---|---|---|---|---|
| Wisconsin 1 | Paul Ryan | Republican | 1998 | Reelected | Paul Ryan (R) 68.2% John Heckenlively (D) 30.1% Joseph Kexel (L) 1.6% |
| Wisconsin 2 | Tammy Baldwin | Democratic | 1998 | Reelected | Tammy Baldwin (D) 61.8% Chad Lee (R) 38.2% |
| Wisconsin 3 | Ron Kind | Democratic | 1996 | Reelected | Ron Kind (D) 50.3% Dan Kapanke (R) 46.5% Michael Krsiean (I) 3.2% |
| Wisconsin 4 | Gwen Moore | Democratic | 2004 | Reelected | Gwen Moore (D) 69.0% Dan Sebring (R) 29.6% Ahmad Ayyash (I) 1.4% |
| Wisconsin 5 | Jim Sensenbrenner | Republican | 1978 | Reelected | Jim Sensenbrenner (R) 69.3% Todd Kolosso (D) 27.4% Robert R. Raymond (I) 3.3% |
| Wisconsin 6 | Tom Petri | Republican | 1979 | Reelected | Tom Petri (R) 70.7% Joseph Kallas (D) 29.3% |
| Wisconsin 7 | Dave Obey | Democratic | 1969 | Retired Republican gain |
Sean Duffy (R) 52.1% Julie Lassa (D) 44.4% Gary Kauther (I) 3.3% |
| Wisconsin 8 | Steve Kagen | Democratic | 2006 | Lost reelection Republican gain |
Reid Ribble (R) 54.8% Steve Kagen (D) 45.1% |
Wyoming

| District | Incumbent | Party | First elected |
Result | Candidates[122] |
|---|---|---|---|---|---|
| Wyoming at-large | Cynthia Lummis | Republican | 2008 | Reelected | Cynthia Lummis (R) 70.5% David Wendt (D) 24.5% John Love (L) 5.0% |
Non-voting delegates
The House of Representatives includes five Delegates from the District of Columbia and outlying territories elected to two-year terms and one Resident Commissioner of Puerto Rico elected to a four-year term (for which the last election was held in 2008, so the seat was not up for reelection in 2010). These delegates are not allowed to vote on the floor of the House of Representatives.
| District | Incumbent | Party | First elected |
Result | Candidates |
|---|---|---|---|---|---|
| American Samoa | Eni Faleomavaega | Democratic | 1988 | Reelected | Eni Faleomavaega (D) 56.3% Amata Coleman Radewagen (R) 40.5% Tuika Tuika (I) 3.2%[123] |
| District of Columbia | Eleanor Holmes Norton | Democratic | 1990 | Reelected | Eleanor Holmes Norton (D) 88.9% Marjorie Reilly Smith (R) 6.1% Rick Tingling-Clemmons (DC) 3.3% Queen Noble (I) 0.6%[124] |
| Guam | Madeleine Bordallo | Democratic | 2002 | Reelected | Madeleine Bordallo (D) unopposed |
| Northern Mariana Islands | Gregorio Sablan | Independent | 2008 | Reelected | Gregorio Sablan (I) 43.2% Joe Camacho (Cov) 24.2% Juan Babauta (R) 17.5% Jesus Borja (D) 15.1%[125] |
| U.S. Virgin Islands | Donna Christian-Christensen | Democratic | 1996 | Reelected | Donna Christian-Christensen (D) 71.2% Jeffrey Moorhead (I) 18.7% Vincent Emile Danet (R) 8.5% Guillaume Mimoun (I) 1.5%[126] |
See also
Notes
- ↑ The nonvoting delegates represent the District of Columbia; the territories of American Samoa, Guam, and the Virgin Islands; and the commonwealths of the Northern Mariana Islands and Puerto Rico, see 48 U.S.C. § 16. They are all chosen biennially except for Puerto Rico's delegate, who is elected every four years, and next faced reelection in 2012.
References
- ↑ McDonald, Michael (January 28, 2011). "2010 General Election Turnout Rates". United States Election Project. George Mason University. Retrieved September 23, 2011.
- ↑ Hooper, Molly K. (November 17, 2010). "Boehner favored as 61st House Speaker on his 61st birthday". The Hill. Retrieved November 28, 2010.
- ↑ 2122261 "House Democrats keep Nancy Pelosi as their leader". WTOP-FM. Associated Press. November 17, 2010. Retrieved November 28, 2010.
- ↑ 4.0 4.1 4.2 4.3 Miller, Lorraine C. (July 10, 2009). "Statistics of the Presidential and Congressional Election of November 4, 2008" (PDF). Office of the Clerk. U.S. House of Representatives. Retrieved September 23, 2011.
- ↑ 5.0 5.1 5.2 5.3 5.4 5.5 5.6 5.7 Haas, Karen L. (June 3, 2011). "Statistics of the Congressional Election of November 2, 2010" (PDF). Office of the Clerk. U.S. House of Representatives. Retrieved September 23, 2011.
- ↑ "Boehner Must Navigate Around Senate, Obama -- And Tea Party". National Journal. November 3, 2010. Retrieved November 4, 2010.
- ↑ "Heartland Headache". National Journal. November 4, 2010. Retrieved November 24, 2010.
- ↑ "Republicans capture control of House". CNN. November 3, 2010. Retrieved April 9, 2014.
- ↑ The 2010 Midterm Election in Perspective November 10, 2010. Commentary.
- ↑ Catherine Dodge and Lisa Lerer (November 2, 2010). "Democrats Face Biggest House Midterm Defeat in Years". Bloomberg. Retrieved March 11, 2014.
- ↑ "Midterms 2010: What you need to know". Washington Post. Retrieved March 11, 2014.
- ↑ Kate Pickert (November 2, 2010). "Mixed Results on the Health Reform Referendum". TIME. Retrieved March 11, 2014.
- ↑ "CQ Politics | Presidential and House election 08 results by congressional district". Innovation.cq.com. Retrieved July 28, 2009.
- ↑ "After the Wave > Publications >". National Affairs. November 2, 2010. Retrieved March 7, 2012.
- ↑ Drake, Bruce. "Republicans Score Big in the States and Win Leg Up on Redistricting". Politicsdaily.com. Retrieved March 7, 2012.
- ↑ "Archived-Articles: Voting Integrity Also a Rural Issue". Americanthinker.com. February 27, 2012. Retrieved March 7, 2012.
- ↑ Paul R Abramson, John H Aldrich and David W Rohde, Change and Continuity in the 2008 and 2010 Elections (2011)
- ↑ Charles J. Dean (February 1, 2009). "Alabama U.S. Rep. Artur Davis set to launch run for governor". The Birmingham News. Retrieved February 2, 2009.
- ↑ "Arkansas Congressman Berry to Retire". Fox News. January 25, 2010. Retrieved November 24, 2010.
- ↑ John Lyon (January 15, 2010). "Snyder won't seek reelection". Arkansas News. Retrieved January 20, 2010.
- ↑ Decker, Cathleen (February 14, 2010). "Diane Watson's retirement inspires a look back". Los Angeles Times. Retrieved September 13, 2010.
- ↑ "Florida Rep. Kendrick Meek considers Senate run". The Hill. January 12, 2009. Retrieved January 12, 2009.
- ↑ "Kan. Congressman Moore won't seek re-election". WFAA. Associated Press. November 24, 2009. Retrieved November 24, 2010.
- ↑ "Melancon running against Vitter". Politico. August 27, 2009.
- ↑ "Bill Delahunt won't run for re-election". Widgets.onesite.com. Retrieved June 14, 2010.
- ↑ Kraushaar, Allen (April 9, 2010). "Rep. Bart Stupak won't seek reelection". Politico.
- ↑ John Distaso (February 3, 2009). "In 2010, Rep. Hodes will run for U.S. Senate". Union Leader. Retrieved February 3, 2009.
- ↑ "Rep. Sestak to take on Sen. Specter". The Hill.
- ↑ "Patrick Kennedy Won't Run for Re-Election". CBS News. Associated Press. February 11, 2010. Retrieved November 24, 2010.
- ↑ Josh Kraushaar (December 14, 2009). "Bart Gordon retiring". Politico. Retrieved December 15, 2009.
When I was elected, I was the youngest member of the Tennessee congressional delegation; now, I’m one of the oldest. In fact, I have members of my staff who weren’t even born when I took office. That tells me it’s time for a new chapter.
- ↑ Ken Whitehouse and A.C. Kleinheider (December 1, 2009). "Tanner to retire". NashvillePost.com.
- ↑ Reid Wilson and Tim Sahd (December 9, 2009). "Baird Retires; GOP Lands Solid Recruit". The National Journal: Hotline On Call.
- ↑ "Retiring congressman: 'Frankly, I am bone tired'". CNN. May 5, 2010. Retrieved May 26, 2010.
- ↑ "David Obey heading to K Street". Politico. June 3, 2011. Retrieved June 3, 2011.
- ↑ Aaron Blake and Molly Hopper (January 14, 2010). "Shadegg to retire". The Hill. Retrieved February 4, 2010.
- ↑ Josh Kraushaar (December 29, 2009). "Radanovich retiring". Politico. Retrieved January 18, 2010.
- ↑ Kraushaar, Josh (October 6, 2009). "Mike Castle announces run for Joe Biden's Seat". Politico. Retrieved November 24, 2010.
- ↑ Cillizza, Chris (April 30, 2010). "Florida Republican Rep. Ginny Brown-Waite Retires". The Washington Post.
- ↑ "Rep. Putnam will not seek reelection". TheHill.com. Retrieved July 28, 2009.
- ↑ Miller, Sean J.; Blake, Aaron (February 11, 2010). "Mario Diaz-Balart confirms switch, will run for his brother's House seat". The Hill. Retrieved February 28, 2010.
- ↑ Bob Keefe; Jim Galloway (February 27, 2010). "U.S. Rep. Linder will not seek re-election". The Atlanta Journal-Constitution.
- ↑ "Rep. Kirk to run for Senate". The Hill. July 8, 2009.
- ↑ Schneider, Mary Beth (January 29, 2010). "Buyer to retire due to wife's illness". The Indianapolis Star.
- ↑ Hanna, John (November 3, 2010). "U.S. Senate seat goes to Jerry Moran". The Wichita Eagle. Associated Press. Retrieved November 24, 2010.
- ↑ Jeffrey Young (January 31, 2009). "Kansan Tiahrt makes Senate bid official". The Hill. Retrieved January 31, 2009.
- ↑ Emily Cadei (March 27, 2009). "Hoekstra to Announce Entry to Michigan Governor's Race". CQ Politics. Retrieved March 27, 2009.
- ↑ Kiely, Eugene (February 10, 2010). "Rep. Ehlers, a moderate Republican, announces retirement". USA Today.
- ↑ "The Scorecard: 2008 Congressional campaign news and analysis". Politico.com. Retrieved July 28, 2009.
- ↑ Michael McNutt (February 28, 2009). "U.S. Rep Mary Fallin confirms decision to run for Oklahoma governor in 2010". NewsOK. Retrieved February 28, 2009.
- ↑ Martin, Jonathan (January 4, 2010). "Henry Brown Retiring". Politico.com. Retrieved November 24, 2010.
- ↑ "Rep. Barrett to run for S.C. governor". TheHill.com. Retrieved July 28, 2009.
- ↑ "Chattanooga Times Free Press | Tennessee: Wamp touts poll saying he’s top GOP pick for governor". Timesfreepress.com. Retrieved July 28, 2009.
- ↑ 53.0 53.1 "Election 2010: All House Races". CBS News. November 3, 2010. Retrieved November 3, 2010.
- ↑ "Battle For The House". Realclearpolitics.com. Retrieved November 4, 2010.
- ↑ Silver, Nate (October 31, 2010). "The Ultimate Hour-by-Hour, District-by-District Election Guide". Fivethirtyeight.blogs.nytimes.com. Retrieved November 4, 2010.
- ↑ Ishmael, Patrick (October 31, 2010). "Game Time: Final House rankings and printable cheat sheet". Hot Air. Retrieved November 24, 2010.
- ↑ "What To Look For On Election Night". Rasmussen Reports. November 2, 2010. Archived from the original on November 4, 2010. Retrieved November 24, 2010.
- ↑ Ishmael, Patrick (October 25, 2010). "Eight days out, GOP still poised to gain 60+ House seats". Hot Air. Retrieved November 24, 2010.
- ↑ "2010 House Ratings". Centerforpolitics.org. November 1, 2010. Retrieved November 4, 2010.
- ↑ Cook Political Report (October 26, 2010). "Cook Political Ups Projected Democratic Losses To 48 to 60".
- ↑ "Democrats Will Lose the House: Charlie Cook". Outsidethebeltway.com. February 22, 2010. Retrieved June 14, 2010.
- ↑ Scott Rasmussen (November 1, 2010). "A Vote Against Dems, Not for the GOP". wsj.com. Retrieved November 4, 2010.
- ↑ "House Ratings". rothenbergpoliticalreport.com. October 28, 2010. Retrieved November 4, 2010.
- ↑ Rothenberg, The (April 14, 2010). "The Rothenberg Political Report: New Print Edition: House Overview". Rothenbergpoliticalreport.blogspot.com. Retrieved June 14, 2010.
- ↑ "CQ Politics | House Race Ratings Map for 2010". Innovation.cqpolitics.com. Archived from the original on October 28, 2010.
- ↑ "CQ Politics | House Race Ratings Map for 2010". Innovation.cqpolitics.com. Retrieved July 11, 2010.
- ↑ "The Cook Political Report - Charts - 2010 House Competitive Races". Cookpolitical.com. November 1, 2010. Retrieved November 1, 2010.
- ↑ Rothenberg Political Report (November 1, 2010). "House Ratings". Rothenbergpoliticalreport.com. Archived from the original on November 1, 2010. Retrieved November 1, 2010.
- ↑ "2010 House Ratings Chart". CQ Politics. Archived from the original on October 28, 2010. Retrieved November 1, 2010.
- ↑ Crystal Ball, as of November 1, 2010
- ↑ RealClearPolitics, as of November 1, 2010
- ↑ "AL - Election Results". clarityelections.com. Retrieved March 13, 2015.
- ↑ "GEMS ELECTION RESULTS". alaska.gov. Retrieved March 13, 2015.
- ↑ State of Arizona Official Canvass
- ↑ "Arkansas Secretary of State". votenaturally.org. Retrieved March 13, 2015.
- ↑ California SOS - Election Results
- ↑ Colorado Official Results General Election
- ↑ Connecticut Election Results
- ↑ "State Of Delaware - Elections Results". delaware.gov. Retrieved March 13, 2015.
- ↑ Florida Election Results
- ↑ "11/2/2010 - Federal and Statewide". georgia.gov. Retrieved March 13, 2015.
- ↑ Hawaii 2010 General Election Results
- ↑ Idaho SOS - 2010 General Election Results
- ↑ Illinois State Board of Elections General Election Results
- ↑ "Secretary of State : Election Division: Election Results". in.gov. Retrieved March 13, 2015.
- ↑ Iowa SOS - Official General Election Results
- ↑ Kansas Secretary of State - General Election Results
- ↑ "KY - Election Results". clarityelections.com. Retrieved March 13, 2015.
- ↑ "Louisiana Secretary of State". louisiana.gov. Retrieved March 13, 2015.
- ↑ "Bureau of Corporations, Elections & Commissions, Elections Division". maine.gov. Retrieved March 13, 2015.
- ↑ Maryland State Board of Elections. "2010 General Election Official Results". state.md.us. Retrieved March 13, 2015.
- ↑ Massachusetts 2010 Election Results
- ↑ "2010 Official Michigan General Election Results - Representative in Congress". nictusa.com. Retrieved March 13, 2015.
- ↑ de Heus, Matt. "de Heus for Congress".
- ↑ Minnesota SOS - General Election Results
- ↑ "404 We Are Sorry, We Cannot Find That Page". ms.gov. Retrieved March 13, 2015.
- ↑ State of Missouri General Election Results
- ↑ "Montana Secretary of State - Election Night Results - November 4th, 2014". mt.gov. Retrieved March 13, 2015.
- ↑ Nebraska General Election Results
- ↑ "2010 Unofficial Statewide General Election Coverage and Reports". nvsos.gov. Retrieved March 13, 2015.
- ↑ "2010 election homepage". nh.gov. Retrieved March 13, 2015.
- ↑ State of New Jersey General Election Results
- ↑ New Mexico 2010 General Election Results
- ↑ New York General Election Results
- ↑ "NC - Election Results". clarityelections.com. Retrieved March 13, 2015.
- ↑ "Secretary of State - Election Night Results - November 4th, 2014". nd.gov. Retrieved March 13, 2015.
- ↑ "Ohio General Election Results". state.oh.us. Retrieved March 13, 2015.
- ↑ "SUMMARY RESULTS: General Election -- November 2, 2010". ok.gov. Retrieved March 13, 2015.
- ↑ "Oregon Secretary of State" (PDF). state.or.us. Retrieved March 13, 2015.
- ↑ Pennsylvania General Election Results
- ↑ "RI.gov: Election Results". ri.gov. Retrieved March 13, 2015.
- ↑ "SC - Election Results". enr-scvotes.org. Retrieved March 13, 2015.
- ↑ South Dakota General Election Results
- ↑ Tennessee Election Results
- ↑ Texas General Election Results
- ↑ Utah Election Results
- ↑ "Elections - Home - Vermont Secretary of State" (PDF). vermont-elections.org. Retrieved March 13, 2015.
- ↑ Virginia Election Results
- ↑ Washington General Election Results
- ↑ "WV SOS - Elections - Election Results - Online Data Services". wv.gov. Retrieved March 13, 2015.
- ↑ Wisconsin General Election Results
- ↑ Wyoming General Election Results
- ↑ "Prospective lawmakers in American Samoa revealed". Radio New Zealand International. September 3, 2010. Retrieved September 8, 2010.
- ↑ "DC Board Of Elections And Ethics: Election Results". dcboee.org. Retrieved March 13, 2015.
- ↑ Northern Mariana Islands Election Results
- ↑ "Virgin Islands Election Results". vivote.gov. Retrieved March 13, 2015.
Further reading
- Abramson, Paul R. John H Aldrich and David W Rohde, Change and Continuity in the 2008 and 2010 Elections (2011)
- Bullock, Charles S., III et al. Key States, High Stakes: Sarah Palin, the Tea Party, and the 2010 Elections (2011) excerpt and text search
External links
- Candidates for U.S. Congress at Project Vote Smart
- U.S. House of Representatives from OurCampaigns.com
- Congressional Races in 2010 from Open Secrets (campaign contributions)
- 2010 National Congressional Ballot from Pollster.com
- Election 2010: House of Representatives Election from Rasmussen Reports
- Battle for the House from Real Clear Politics
- House Races in 2010 from CQ Politics
- A Look at 2010 Congressional Races at C-SPAN, ongoing video blog
| ||||||||||
| ||||||||||||