United Kingdom general election, 1992
| | |||||||||||||||||||||||||||||||||||||||||||||||||||||||||||||||
| |||||||||||||||||||||||||||||||||||||||||||||||||||||||||||||||
| |||||||||||||||||||||||||||||||||||||||||||||||||||||||||||||||
|
| |||||||||||||||||||||||||||||||||||||||||||||||||||||||||||||||
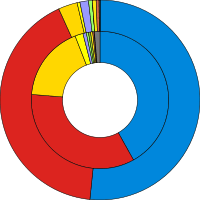
| Colours denote the winning party, as shown in the main table of results. | |||||||||||||||||||||||||||||||||||||||||||||||||||||||||||||||
| |||||||||||||||||||||||||||||||||||||||||||||||||||||||||||||||


| 1983 election • MPs |
| 1987 election • MPs |
| 1992 election • MPs |
| 1997 election • MPs |
| 2001 election • MPs |
The United Kingdom general election of 1992 was held on 9 April 1992, and was the fourth consecutive victory for the Conservative Party. It remains the last outright Conservative victory in the UK. This election result took many by surprise, as polling leading up to the day of the election had shown the Labour Party under leader Neil Kinnock to be consistently, if narrowly, ahead.
John Major had won the leadership election in November 1990 following the resignation of Margaret Thatcher. During his term leading up to the 1992 elections he oversaw the British involvement in the Gulf War, introduced legislation to replace the unpopular Community Charge with Council Tax, and signed the Maastricht treaty. The economy was facing a recession around the time of Major's appointment, along with most of the other industrialised nations. It was one of the most dramatic elections in the UK since the end of the Second World War, after the Conservative Party defeated the initial favourites, the Labour Party.[1]
The BBC's live television broadcast of the election results were presented by David Dimbleby and Peter Snow, with John Cole.[2] On ITV, the ITN-produced coverage was presented by Jon Snow, Alastair Stewart, Julia Somerville with Sir Robin Day performing the same interviewing role for ITV as he had done for the BBC on many previous election nights. Sky News presented full coverage of a general election night for the first time. Their coverage was presented by Sir David Frost, Michael Wilson, Selina Scott, Adam Boulton and political scientist Michael Thrasher, with former BBC political journalist Donald MacCormick presenting analysis of the Scottish vote.
The Conservatives received what remains the largest number of votes in British history, breaking the record set by Labour in 1951.
Overview
The Conservatives had been elected by a landslide in the 1987 general election under the leadership of Margaret Thatcher, but her popularity had sharply declined in 1989 due to the early 1990s recession, internal divisions in the party and the unpopular Community Charge. Labour began to lead the Conservatives in the opinion polls by as much as 20 percentage points. Thatcher resigned after the party leadership ballot in November 1990 and was replaced by John Major. This was well received by the public; Labour lost some momentum as it reduced the impact of their calls for "Time for a Change".[3]
As 1992 dawned, the recession deepened and the election loomed, most opinion polls suggested that Labour were still favourites to win the election, although the lead of the polls had changed from Tory to Labour on several occasions since the end of 1990. The Conservatives maintained strong support in many newspapers, especially The Sun, who ran a series of anti-Labour articles that culminated on election day with a front page headline which urged "the last person to leave Britain" to "turn out the lights" if Labour won the election.[4]
Parliament was due to expire no later than 16 June 1992. Major called the election on 11 March, shortly after Chancellor of the Exchequer Norman Lamont had delivered the Budget.
Campaign
Under the leadership of Neil Kinnock the Labour party had undergone further changes following its 1987 election defeat. Labour entered the campaign confident with most opinion polls showing a slight Labour lead that if maintained suggested a hung parliament, with no single party having an overall majority.
The parties campaigned on the familiar grounds of taxation and health care. Major became known for delivering his speeches while standing on an upturned soapbox during public meetings. Immigration was also an issue, with Home Secretary Kenneth Baker making a controversial speech stating that, under Labour, the floodgates would be opened for immigrants from developing countries. Some speculated that this was a bid by the Conservatives to shore up its support amongst its white working class supporters. The Conservatives also pounded the Labour Party over the issue of taxation, producing a memorable poster entitled "Kinnock's Double-Whammy", showing a boxer wearing gloves marked "tax rises" and "inflation".
An early setback to Labour came in the form of the "War of Jennifer's Ear" controversy, which questioned the truthfulness of a Labour party election broadcast concerning National Health Service (NHS) waiting lists.
Labour seemingly recovered from the NHS controversy, and opinion polls on 1 April (dubbed "Red Wednesday") showed a clear Labour lead. But the lead fell considerably in the following day's polls. Observers blamed the decline on the Labour Party's triumphalist "Sheffield Rally", an enthusiastic American-style political convention at the Sheffield Arena, where Labour Leader Neil Kinnock famously cried out "we're alright!" three times. However most analysts and major participants in the campaign believe it actually had little effect, with the event only receiving widespread attention after the election.[5]
This was the first general election for the newly formed Liberal Democrats, which had grown from the formal merging of the SDP-Liberal Alliance. Its formation had not been without its problems, but under the strong leadership of Paddy Ashdown, who proved to be a likeable and candid figure, the party went into the election ready. They focused on education throughout the campaign, as well as a promise on reforming the voting system.[6]
Minor parties
In Scotland the Scottish National Party (SNP) hoped to make a major electoral breakthrough in 1992 and had run a hard independence campaign with Free by '93 as their slogan. Although the party managed to increase its total vote by 50% since 1987, the SNP only held onto the three seats they had won at the previous election. They also lost Glasgow Govan, which their deputy leader Jim Sillars had taken in a by-election in 1988. Sillars quit active politics after the General Election with a parting shot at the Scottish electorate as being "ninety minute patriots" referring to their supporting the Scotland national football team only during match time.[7]
The election also saw a small change in Northern Ireland as the Conservatives organised and stood candidates in the province for the first time since the Ulster Unionist Party had broken with them in 1972 over the Sunningdale Agreement. Although they won no seats, their best result was Laurence Kennedy achieving over 14,000 votes to run second to James Kilfedder in North Down.
Margaret Thatcher, Norman Tebbit, Denis Healey, Nigel Lawson, Geoffrey Howe, Michael Foot, David Owen, Merlyn Rees, then-Speaker Bernard Weatherill, Cecil Parkinson, John Wakeham, Nicholas Ridley and Peter Morrison were among the prominent retirees.
Polling
Almost every poll leading up to polling day predicted either a hung parliament, with Labour the largest party or a small Labour majority of around 19 to 23. Polls on the last few days before the country voted predicted a very slim Labour majority.[8]
With opinion polls at the end of the campaign showing Labour and the Conservatives neck and neck, the actual election result was a surprise to many in the media and in polling organisations. The apparent failure of the opinion polls to come close to predicting the actual result led to an inquiry by the Market Research Society. Following the election, most opinion polling companies changed their methodology in the belief that a 'Shy Tory Factor' affected the polling.
Results
The election turnout of 77.67%[9] was the highest in eighteen years. There was an overall Labour swing of 2.2%, which widened the gap between Labour and the Liberal Democrats. For the Conservatives, despite the reasonable percentage of votes received (only 0.3% down on 1987), the actual Conservative overall majority in the House of Commons was reduced to twenty-one seats. This number was reduced progressively during the course of Major's term in office due to defections of MPs to other parties, by-election defeats and for a time in 1994-95 suspension of the Conservative whip for some MPs who voted against the government on its European policy - by 1996, the Conservatives held a single-seat majority and were in minority going into 1997 up until the 1997 General Election. The Conservatives in 1992 received the most total votes ever for any political party in any UK general election, beating the previous largest total vote of 13.98 million achieved by Labour in 1951 (although this was from a smaller electorate and represented a higher vote share). Nine government ministers lost their seats in 1992, including party chairman Chris Patten.
The Sun′s analysis of the election results was headlined "It's the Sun wot won it" though in his testimony to the April 2012 Leveson inquiry, Rupert Murdoch claimed that the "infamous" headline was "both tasteless and wrong".[10] Tony Blair also accepted this theory of Labour's defeat and put considerable effort into securing The Sun's support for New Labour, both as Leader of the Opposition before the 1997 general election and as Prime Minister afterwards.
The results continued the Conservatives' decline in Northern England with Labour regaining many seats they had not held since 1979. The Conservatives also began to lose support in the Midlands, but had a slight increase in their vote in Scotland, where they had a net gain of one seat there. Labour and Plaid Cymru strengthened in Wales with Conservative support declining. However, in the South East, South West, London and Eastern England the Conservative vote held up leading to few losses there with many considering Basildon to be indicative of a nouveau riche working class element referred to as Essex Man voting strongly Conservative.
For the Liberal Democrats their first election campaign was a reasonable success, the party had worked itself up from a "low base" during its troubled creation and come out relatively unscathed.[11]
It was the second General Election defeat under Leader Neil Kinnock and Deputy Leader Roy Hattersley and both resigned soon after the election, and were succeeded by John Smith and Margaret Beckett respectively.
Sitting MPs Dave Nellist, Terry Fields, Ron Brown, John Hughes and Syd Bidwell who had been expelled or deselected by the Labour Party and stood as independents were all defeated, although in Nellist's case only very narrowly. Tommy Sheridan, fighting the election from prison, polled 19%.
| 336 | 271 | 20 | 24 |
| Conservative | Labour | Lib Dem | O |
| UK General Election 1992[9] | |||||||||||||||
|---|---|---|---|---|---|---|---|---|---|---|---|---|---|---|---|
| Candidates | Votes | ||||||||||||||
| Party | Standing | Elected | Gained | Unseated | Net | % of total | % | No. | Net % | ||||||
| Conservative | 645 | 336 | 3 | 44 | - 41 | 51.69 | 41.9 | 14,093,007 | - 0.3 | ||||||
| Labour | 634 | 271 | 43 | 1 | + 42 | 41.62 | 34.4 | 11,560,484 | + 3.6 | ||||||
| Liberal Democrat | 632 | 20 | 4 | 6 | - 2 | 3.07 | 17.8 | 5,999,606 | - 4.8 | ||||||
| SNP | 72 | 3 | 0 | 0 | 0 | 0.46 | 1.9 | 629,564 | + 0.6 | ||||||
| UUP | 13 | 9 | 0 | 0 | 0 | 1.38 | 0.8 | 271,049 | 0.0 | ||||||
| SDLP | 13 | 4 | 1 | 0 | + 1 | 0.61 | 0.5 | 184,445 | 0.0 | ||||||
| Green | 253 | 0 | 0 | 0 | 0 | 0.5 | 170,047 | + 0.2 | |||||||
| Plaid Cymru | 38 | 4 | 1 | 0 | + 1 | 0.61 | 0.5 | 156,796 | + 0.1 | ||||||
| DUP | 7 | 3 | 0 | 0 | 0 | 0.46 | 0.3 | 103,039 | 0.0 | ||||||
| Sinn Féin | 14 | 0 | 0 | 1 | - 1 | 0.2 | 78,291 | - 0.1 | |||||||
| Alliance | 16 | 0 | 0 | 0 | 0 | 0.2 | 68,665 | 0.0 | |||||||
| Liberal | 73 | 0 | 0 | 0 | 0 | 0.2 | 64,744 | N/A | |||||||
| Natural Law | 309 | 0 | 0 | 0 | 0 | 0.2 | 62,888 | N/A | |||||||
| Social Democratic | 10 | 0 | 0 | 0 | 0 | 0.1 | 35,248 | N/A | |||||||
| Independent Labour | 6 | 0 | 0 | 0 | 0 | 0.1 | 22,844 | N/A | |||||||
| Ulster Popular Unionist | 1 | 1 | 0 | 0 | 0 | 0.15 | 0.1 | 19,305 | 0.0 | ||||||
| Independent Conservative | 12 | 0 | 0 | 0 | 0 | 0.1 | 11,356 | N/A | |||||||
| Monster Raving Loony | 25 | 0 | 0 | 0 | 0 | 0.1 | 7,929 | + 0.1 | |||||||
| Independent | 23 | 0 | 0 | 0 | 0 | 0.1 | 7,631 | N/A | |||||||
| BNP | 13 | 0 | 0 | 0 | 0 | 0.1 | 7,631 | N/A | |||||||
| Scottish Militant Labour | 1 | 0 | 0 | 0 | 0 | 0.1 | 6,287 | N/A | |||||||
| National Front | 14 | 0 | 0 | 0 | 0 | 0.1 | 4,816 | N/A | |||||||
| True Labour | 1 | 0 | 0 | 0 | 0 | 0.1 | 4,665 | N/A | |||||||
| Anti-Federalist | 17 | 0 | 0 | 0 | 0 | 0.1 | 4,383 | N/A | |||||||
| Workers' Party | 8 | 0 | 0 | 0 | 0 | 0.1 | 4,359 | 0.0 | |||||||
| Official Conservative Hove Party | 1 | 0 | 0 | 0 | 0 | 0.0 | 2,658 | N/A | |||||||
| Loony Green | 5 | 0 | 0 | 0 | 0 | 0.0 | 2,538 | N/A | |||||||
| Independent Unionist | 1 | 0 | 0 | 0 | 0 | 0.0 | 2,256 | N/A | |||||||
| New Agenda | 0 | 0 | 0 | 0 | 0.0 | 2,133 | N/A | ||||||||
| Independent Progressive Socialist | 1 | 0 | 0 | 0 | 0 | 0.0 | 1,094 | N/A | |||||||
| Islamic Party | 4 | 0 | 0 | 0 | 0 | 0.0 | 1,085 | N/A | |||||||
| Revolutionary Communist | 8 | 0 | 0 | 0 | 0 | 0.0 | 745 | N/A | |||||||
| Independent Nationalist | 1 | 0 | 0 | 0 | 0 | 0.0 | 649 | N/A | |||||||
| Communist (PCC) | 4 | 0 | 0 | 0 | 0 | 0.0 | 603 | N/A | |||||||
All parties with more than 500 votes shown. Plaid Cymru result includes votes for Green/Plaid Cymru Alliance.
| Government's new majority | 21 |
| Total votes cast[9] | 33,614,074 |
| Turnout | 77.7% |
Incumbents defeated
MPs who lost their seats
See also
- MPs elected in the United Kingdom general election, 1992
Manifestos
- The Best Future For Britain - 1992 Conservative manifesto.
- It's time to get Britain working again - 1992 Labour Party manifesto.
- Changing Britain for good - 1992 Liberal Democrats manifesto.
Notes
- ↑ "1992: Tories win again against odds". BBC News. 5 April 2005. Retrieved 22 October 2013.
- ↑ "BBC Election '92". Youtube.com.
- ↑ "Poll tracker: Interactive guide to the opinion polls". BBC News. 29 September 2009.
- ↑ Douglas, Torin (14 September 2004). "Forty years of The Sun". BBC News. Retrieved 22 October 2013.
- ↑ Westlake, Martin (2001). Kinnock: The Biography (3rd ed.). London: Little, Brown Book Group. pp. 560–564. ISBN 0-3168-4871-9.
- ↑ "1992 Personalities". BBC News. Retrieved 22 October 2013.
- ↑ Peterkin, Tom (28 April 2003). "Swinney should stop his sneering at 'second best'". Daily Telegraph (London). Retrieved 30 July 2009.
- ↑ How did Labour lose in '92?: The most authoritative study of the last general election is published tomorrow. Here, its authors present their conclusions and explode the myths about the greatest upset since 1945 - The Independent, 29 May 1994
- ↑ 9.0 9.1 9.2 "General Election Results 9 April 1992" (PDF). parliament.uk. Retrieved 14 June 2011.
- ↑ Dowell, Ben (25 April 2012). "Rupert Murdoch: 'Sun wot won it' headline was tasteless and wrong". The Guardian (London: Guardian Newspapers). Retrieved 27 April 2012.
- ↑ "1992 Results". BBC News. Retrieved 22 October 2013.
- ↑ Former Labour MP, joined SDP
- ↑ Former Labour MP, joined SNP
- ↑ 14.0 14.1 14.2 14.3 Former Labour MP, expelled from Party
- ↑ Former Labour MP, de-selected by Party
Further reading
- Butler, David E. et al. The British General Election of 1992 (1992), the standard scholarly study
External links
- Catalogue of 1992 general election ephemera at the Archives Division of the London School of Economics.
| ||||||||||||||||||||||
| ||||||||||||||||||||||||||||
| ||||||||||||||||||||||||||