United Kingdom general election, 1918
| | |||||||||||||||||||||||||||||||||||||||||||||||||||||||||||||||||||||||||||||||||||||||||||||||||||||||||||
| |||||||||||||||||||||||||||||||||||||||||||||||||||||||||||||||||||||||||||||||||||||||||||||||||||||||||||
| |||||||||||||||||||||||||||||||||||||||||||||||||||||||||||||||||||||||||||||||||||||||||||||||||||||||||||
| |||||||||||||||||||||||||||||||||||||||||||||||||||||||||||||||||||||||||||||||||||||||||||||||||||||||||||


The United Kingdom general election of 1918 was the first to be held after the Representation of the People Act 1918, which meant it was the first United Kingdom general election in which any women could vote. It was also the first in which all men over the age of 21 could vote; previously many poor men had been excluded from voting, while the new laws still excluded women under the age of 30. It was also the first election to be held on a single day.
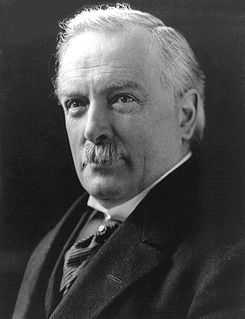
During World War I, David Lloyd George had replaced H. H. Asquith as prime minister and operated a coalition government which was supported by the majority of the Liberals and Andrew Bonar Law's Conservatives. Lloyd George called an election immediately after the signing of the Armistice with Germany. Although polling was held on Saturday 14 December 1918, the count did not take place until 28 December due to the time taken to transport votes from soldiers serving overseas.
The election saw a split in the Liberal Party between those who were aligned with Lloyd George and the government and those who were aligned with Asquith, the party's official leader. While most of the pro-coalition Liberals were re-elected, Asquith's faction was reduced to just 36 seats, with Asquith himself losing his own seat. The coalition won a landslide victory and Lloyd George remained Prime Minister, despite the fact that the Conservatives outnumbered his pro-coalition Liberals. In addition, the coalition was supported by a few independent and former Labour MPs, including the National Democratic and Labour Party. The Labour Party also greatly increased its vote share and made a net gain of seats, though two of their leading members Ramsay MacDonald and Arthur Henderson lost their seats. The election also marked the end of the Liberal dominance of Wales in UK general elections; for the first time, Labour won the most seats, a feat it has continued into the present day.
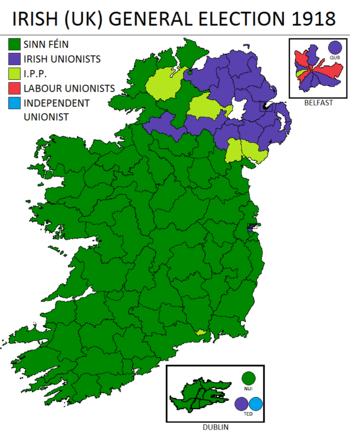
The election was also noted for the dramatic result in Ireland, which showed clear disapproval towards government policy. The Irish Parliamentary Party were almost completely wiped out by the hardline Sinn Féin republicans, who refused to take their seats in Westminster. It was the last election before the majority of Irish counties seceded from the UK to form the Irish Republic; the Irish War of Independence began soon after the election.
| Jan 1910 election • MPs |
| Dec 1910 election • MPs |
| 1918 election • MPs |
| 1922 election • MPs |
| 1923 election • MPs |
The parties
The national all-party government that had conducted the war split apart as the war was ending. Prime Minister Lloyd George was a Liberal, but he had solid backing from the Conservatives as well as some Liberals. He and Conservative leader Bonar Law identified candidates who agreed to support them with a letter of endorsement, signed by both, and known as a "coupon". This election is often called the coupon election. Coupons were issued to 159 Liberal candidates and 364 Conservatives, though in some cases they were rejected. It was also known as one of the khaki elections, due to the immediate postwar setting and the role of the demobilized soldiers.
Labour decided to fight it out independently, as did those Liberals who did not want a coupon.
The election was fought not so much on the peace issue and what to do with Germany, although those themes played a role. More important was the voters' evaluation of Lloyd George in terms of what he had accomplished so far and what he promised for the future. His supporters emphasized that he had won the Great War. Against his strong record in social legislation, he himself called for making "a country fit for heroes to live in.".[1]
Coalition victory
On 14 November it was announced that Parliament, which had been sitting since 1910 and had been extended by emergency wartime action, would dissolve on 25 November, with elections on 14 December.[2]
The coalition won the election easily, with the Conservatives the big winners. They were the largest party in the governing majority. An additional 47 Conservatives won without the coupon but did not act as a separate block or oppose the government except on the issue of Irish independence.
Labour, led by William Adamson vastly increased their share of the vote but only slightly increased their number of seats, losing some of their earlier leaders like Ramsay MacDonald and Arthur Henderson. The Labour vote surpassed the total votes of either Liberal party (although Labour's share was less than both combined and the Coalition Liberals alone had more seats). The anti-coalition Liberals under former Prime Minister H. H. Asquith, won about 36 seats but lost all their leaders from parliament including Asquith. However nine of these subsequently joined the Coalition Liberal group.
The Conservative MPs included record numbers of corporate directors, bankers and businessmen, while Labour MP's were mostly from the working class. Many young veterans reacted against the harsh tone of the campaign and became disillusioned with politics.[3]
Ireland
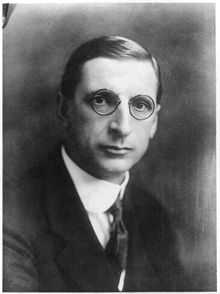
In Ireland, the Irish Parliamentary Party lost almost all their seats, most of which were won by Sinn Féin under Éamon de Valera. The 73 Sinn Féin elected members declined to take their seat in the British House of Commons, sitting instead in the Irish revolutionary assembly, Dáil Éireann. On 17 May 1918 almost the entire leadership of Sinn Féin, including de Valera and Arthur Griffith, had been arrested. In total 47 of the Sinn Féin MPs were elected from jail. The Dáil first convened on 21 January 1919, which marks the beginning of the Irish War of Independence.
Constance Markievicz became the first woman elected to Parliament. She was a Sinn Féin member elected for Dublin St Patrick's, and like the other Sinn Féin MPs, she did not take her seat.
Results
Maps

Seats by party
| 332 | 127 | 73 | 57 | 47 | 36 | 35 |
| Coalition Conservative | Coalition Liberal | Sinn Féin | Labour | C | Liberal | O |
| UK General Election 1918 | |||||||||||||||
|---|---|---|---|---|---|---|---|---|---|---|---|---|---|---|---|
| Candidates | Votes | ||||||||||||||
| Party | Standing | Elected | Gained | Unseated | Net | % of total | % | No. | Net % | ||||||
| Coalition Conservative | 362 | 332 | N/A | N/A | + 61 | 47.0 | 32.5 | 3,393,167 | |||||||
| Labour | 361 | 57 | N/A | N/A | + 15 | 8.1 | 20.8 | 2,171,230 | |||||||
| Liberal | 277 | 37 | N/A | N/A | - 235 | 5.1 | 13.0 | 1,355,398 | |||||||
| Coalition Liberal | 145 | 127 | 127 | 0 | + 127 | 18.0 | 12.6 | 1,318,844 | N/A | ||||||
| Conservative | 80 | 47 | 47 | 0 | + 47 | 6.6 | 5.9 | 610,681 | N/A | ||||||
| Sinn Féin | 102 | 73 | 73 | 0 | + 73 | 10.3 | 4.6 | 476,458 | N/A | ||||||
| Irish Parliamentary | 57 | 7 | 2 | 69 | - 67 | 1.0 | 2.2 | 226,498 | |||||||
| Coalition National Democratic | 18 | 9 | 9 | 0 | + 9 | 1.3 | 1.5 | 156,834 | N/A | ||||||
| Independent Labour | 29 | 2 | 2 | 0 | + 2 | 0.3 | 1.1 | 116,322 | |||||||
| Independent | 42 | 2 | 2 | 0 | + 2 | 0.3 | 1.0 | 105,261 | |||||||
| National Party | 26 | 2 | 2 | 0 | + 2 | 0.3 | 0.9 | 94,389 | N/A | ||||||
| Independent NFDSS | 26 | 1 | 0 | 0 | 0 | 0.1 | 0.6 | 66,451 | N/A | ||||||
| Co-operative Party | 10 | 1 | 1 | 0 | + 1 | 0.1 | 0.6 | 57,785 | N/A | ||||||
| Independent Conservative | 17 | 1 | 1 | 1 | 0 | 0.1 | 0.4 | 44,637 | |||||||
| Coalition Labour | 5 | 4 | 4 | 0 | + 4 | 0.1 | 0.4 | 40,641 | N/A | ||||||
| Labour Unionist | 3 | 3 | 3 | 0 | + 3 | 0.4 | 0.3 | 30,304 | N/A | ||||||
| Independent Liberal | 8 | 0 | 0 | 0 | 0 | 0.1 | 0.2 | 24,985 | |||||||
| Agriculturalist | 7 | 0 | 0 | 0 | 0 | 0.0 | 0.2 | 19,412 | N/A | ||||||
| National Democratic | 8 | 0 | 0 | 0 | 0 | 0.0 | 0.2 | 17,991 | N/A | ||||||
| NFDSS | 5 | 0 | 0 | 0 | 0 | 0.0 | 0.1 | 12,329 | N/A | ||||||
| Belfast Labour | 4 | 0 | 0 | 0 | 0 | 0.0 | 0.1 | 12,164 | N/A | ||||||
| National Socialist Party | 3 | 1 | 1 | 0 | + 1 | 0.1 | 0.1 | 11,013 | N/A | ||||||
| Independent Coalition | 1 | 1 | 1 | 0 | + 1 | 0.1 | 0.1 | 9,274 | N/A | ||||||
| Highland Land League | 4 | 0 | 0 | 0 | 0 | 0.0 | 0.1 | 8,710 | |||||||
| Women's Party | 1 | 0 | 0 | 0 | 0 | 0.0 | 0.1 | 8,614 | N/A | ||||||
| British Socialist Party | 3 | 0 | 0 | 0 | 0 | 0.0 | 0.1 | 8,394 | |||||||
| Independent Democratic | 4 | 0 | 0 | 0 | 0 | 0.0 | 0.1 | 8,351 | N/A | ||||||
| Independent Nationalist | 6 | 0 | 0 | 0 | 0 | 0.0 | 0.1 | 8,183 | |||||||
| Socialist Labour | 3 | 0 | 0 | 0 | 0 | 0.0 | 0.1 | 7,567 | |||||||
| Scottish Prohibition | 1 | 0 | 0 | 0 | 0 | 0.0 | 0.0 | 5,212 | |||||||
| Independent Progressive | 3 | 0 | 0 | 0 | 0 | 0.0 | 0.0 | 5,077 | |||||||
| Independent Labour and Agriculturalist | 1 | 0 | 0 | 0 | 0 | 0.0 | 0.0 | 1,927 | |||||||
| Christian Socialist | 1 | 0 | 0 | 0 | 0 | 0.0 | 0.0 | 597 | |||||||
Total votes cast: 10,434,700. Turnout 57.2%.[4] All parties shown. Coalition Conservative vote is compared with Conservative vote in previous election. In each other case, the non-coalition vote is compared with the party's previous vote. The Independent NFDSS entry includes an Independent NADSS candidate, who gained a seat with 8,287 votes.
Votes summary
Seats summary
See also
- United Kingdom general elections
- MPs elected in the United Kingdom general election, 1918
- The Parliamentary Franchise in the United Kingdom 1885-1918 gives details of the franchises replaced by the ones used in 1918
References
- Craig, F. W. S. (1989). British Electoral Facts: 1832–1987. Dartmouth: Gower. ISBN 0900178302.
- Spartacus: Political Parties and Election Results
- http://www.election.demon.co.uk/geresults.html
Further reading
- Ball, Stuart R. (1982). "Asquith's Decline and the General Election of 1918". Scottish Historical Review 61 (171): 44–61. JSTOR 25529447.
- McEwen, J. M. (1962). "The Coupon Election of 1918 and Unionist Members of Parliament". Journal of Modern History 34 (3): 294–306. JSTOR 1874358.
- Mowat, Charles Loch (1955). Britain between the wars, 1918–1940. Chicago: University of Chicago Press. pp. 2–9.
- Turner, John (1992). British Politics and the Great War: Coalition and Conflict, 1915–1918. New Haven: Yale University Press. pp. 317–333, 391–436. ISBN 0300050461. Covers the campaign as well as a statistical analysis of the vote
- Wilson, Trevor (1964). "The Coupon and the British General Election of 1918". Journal of Modern History 36 (1): 28–42. JSTOR 1874424.
External links
| Wikimedia Commons has media related to 1918 UK General Election. |
| ||||||||||||||||||||||