United Kingdom general election, 1906
United Kingdom general election, 1906
|
| 12 January – 8 February 1906 |
|
|
All 670 seats in the House of Commons
336 seats needed for a majority |
| |
First party |
Second party |
| |
 |
 |
| Leader |
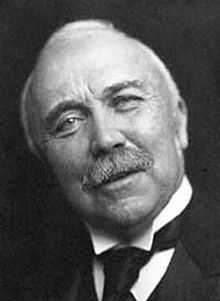
Henry Campbell-Bannerman |
Arthur Balfour |
| Party |
Liberal |
Conservative and Liberal Unionist |
| Leader since |
December 1898 |
11 June 1902 |
| Leader's seat |
Stirling Burghs |
Manchester East
(defeated) |
| Last election |
183 seats, 44.7% |
402 seats, 50.3% |
| Seats won |
397 |
156 |
| Seat change |
 214 214 |
 246 246 |
| Popular vote |
2,751,057 |
2,422,071 |
| Percentage |
48.9% |
43.4% |
| Swing |
3.9% |
6.9% |
|
| |
Third party |
Fourth party |
| |
 |
 |
| Leader |
John Redmond |
Keir Hardie |
| Party |
Irish Parliamentary |
Labour |
| Leader since |
6 February 1900 |
28 February 1900 |
| Leader's seat |
Waterford City |
Merthyr Tydfil |
| Last election |
77 seats, 1.6% |
2 seats, 1.8% |
| Seats won |
82 |
29 |
| Seat change |
5 |
27 |
| Popular vote |
35,031 |
321,663 |
| Percentage |
0.6% |
4.8% |
| Swing |
1.2% |
3.6% |
|
|
The United Kingdom general election of 1906 was held from 12 January to 8 February 1906.
The Liberals, led by sitting minority Prime Minister Henry Campbell-Bannerman, won a large majority in the election. The Conservatives under Arthur Balfour lost more than half their seats, including Balfour's own seat in Manchester East. The Labour Representation Committee was far more successful than in 1900 and after the election would be reformed as the "Labour Party" with 29 MPs and Keir Hardie as leader. The Irish Parliamentary Party, led by John Redmond, achieved its seats with a relatively low number of votes, as 73 candidates stood unopposed.
This election was a landslide defeat for the Conservative Party and their Liberal Unionist allies, with the primary reason given by historians as the party's weakness after its split over the issue of free trade (Joseph Chamberlain had resigned from government in September 1903 in order to campaign for Tariff Reform, which would allow 'preferential tariffs'). Many working-class people saw this as a threat to the price of food, hence the debate was nicknamed 'Big Loaf, Little Loaf'. The Liberals' landslide victory of 125 seats over all other parties led to the passing of social legislation known as the Liberal reforms.
This was the last election in which the Liberals won an absolute majority in the House of Commons. It was also the last election held more than five years after the previous one prior to passage of the Parliament Act 1911, which limited the duration of Parliaments in peacetime to five years.
Results
↓
| 397 |
156 |
82 |
29 |
6 |
| Liberal |
Conservative |
IP |
Labour |
O |
| United Kingdom General Election, 1906 |
|
Candidates |
Votes |
| Party |
Standing |
Elected |
Gained |
Unseated |
Net |
% of total |
% |
No. |
Net % |
| |
Liberal |
528 |
397 |
|
|
+ 214 |
59.3 |
48.9 |
2,565,644 |
+3.9 |
| |
Conservative and Liberal Unionist |
557 |
156 (131 + 25) |
|
|
− 246 |
23.3 |
43.4 |
2,278,076 |
-6.8 |
| |
Labour |
50 |
29 |
28 |
1 |
+ 27 |
4.3 |
4.8 |
254,202 |
+3.6 |
| |
Irish Parliamentary |
84 |
82 |
6 |
1 |
+ 5 |
12.2 |
0.6 |
33,231 |
-1.2 |
| |
Independent Conservative |
9 |
2 |
2 |
0 |
+ 2 |
0.3 |
0.5 |
26,183 |
|
| |
Independent Labour |
7 |
1 |
1 |
0 |
+ 1 |
0.2 |
0.4 |
18,886 |
|
| |
Social Democratic Federation |
8 |
0 |
0 |
0 |
0 |
|
0.4 |
18,446 |
|
| |
Independent Conservative |
9 |
1 |
1 |
0 |
+ 1 |
0.2 |
0.3 |
15,972 |
|
| |
Scottish Workers |
5 |
0 |
0 |
0 |
0 |
|
0.3 |
14,877 |
+0.2 |
| |
Free Trader |
5 |
0 |
0 |
0 |
0 |
|
0.2 |
8,974 |
|
| |
Independent Liberal-Labour |
1 |
1 |
1 |
0 |
+ 1 |
0.2 |
0.1 |
4,841 |
|
| |
Independent |
3 |
0 |
0 |
0 |
0 |
|
0.1 |
3,806 |
|
| |
Independent Nationalist |
3 |
1 |
0 |
0 |
0 |
0.2 |
0.0 |
1,800 |
|
| |
Independent Liberal |
3 |
0 |
0 |
1 |
− 1 |
|
0.0 |
1,581 |
|
| |
Ind. Liberal Unionist |
1 |
0 |
0 |
0 |
0 |
|
0.0 |
153 |
|

England & Wales Seat winners
Voting summary
| Popular vote |
|---|
|
|
|
|
|
| Liberal |
|
48.9% |
| Conservative and Liberal Unionist |
|
43.42% |
| Labour |
|
4.85% |
| Irish Parliamentary |
|
0.63% |
| Independent |
|
1.4% |
| Others |
|
0.81% |
Seats summary
| Parliamentary seats |
|---|
|
|
|
|
|
| Liberal |
|
59.25% |
| Conservative and Liberal Unionist |
|
23.28% |
| Labour |
|
4.18% |
| Irish Parliamentary |
|
12.24% |
| Independent |
|
0.9% |
See also
- MPs elected in the United Kingdom general election, 1906
- The Parliamentary Franchise in the United Kingdom 1885-1918
External links
References