U.S. Standard Atmosphere
Not to be confused with International Standard Atmosphere.

Comparison of the 1962 US Standard Atmosphere graph of geometric altitude against air density, pressure, the speed of sound and temperature with approximate altitudes of various objects.[1]
The U.S. Standard Atmosphere is a series of models that define values for atmospheric temperature, density, pressure and other properties over a wide range of altitudes. The first model, based on an existing international standard, was published in 1958 by the U.S. Committee on Extension to the Standard Atmosphere, and was updated in 1962, 1966, and 1976.

Visualization of composition by volume of Earth's atmosphere. Water vapour is not included as it is highly variable. Each tiny cube (such as the one representing krypton) has one millionth of the volume of the entire block. Data is from NASA Langley.
1962 version
The basic assumptions made for the 1962 version were:[2]
- air is a clean, dry, perfect gas mixture (cp/cv = 1.40)
- molecular weight to 90 km of 28.9644 (C-12 scale)
- principal sea-level constituents are assumed to be:
- assigned mean conditions at sea level are as follows :
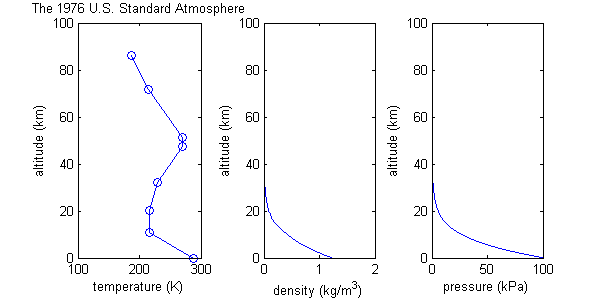
1976 version
This is the most recent version and differs from previous versions only above 32 km:
| Subscript b | Geopotential altitude above MSL[3] |
Static pressure | Standard temperature (K) |
Temperature Lapse Rate | |||
|---|---|---|---|---|---|---|---|
| (m) | (ft) | (pascals) | (inHg) | (K/m) | (K/ft) | ||
| 0 | 0 | 0 | 101325 | 29.92126 | 288.15 | -0.0065 | -0.0019812 |
| 1 | 11,000 | 36,089 | 22632.1 | 6.683245 | 216.65 | 0.0 | 0.0 |
| 2 | 20,000 | 65,617 | 5474.89 | 1.616734 | 216.65 | 0.001 | 0.0003048 |
| 3 | 32,000 | 104,987 | 868.019 | 0.2563258 | 228.65 | 0.0028 | 0.00085344 |
| 4 | 47,000 | 154,199 | 110.906 | 0.0327506 | 270.65 | 0.0 | 0.0 |
| 5 | 51,000 | 167,323 | 66.9389 | 0.01976704 | 270.65 | -0.0028 | -0.00085344 |
| 6 | 71,000 | 232,940 | 3.95642 | 0.00116833 | 214.65 | -0.002 | -0.0006096 |
See also
References
- U.S. Extension to the ICAO Standard Atmosphere, U.S. Government Printing Office, Washington, D.C., 1958.
- U.S. Standard Atmosphere, 1962, U.S. Government Printing Office, Washington, D.C., 1962.
- U.S. Standard Atmosphere Supplements, 1966, U.S. Government Printing Office, Washington, D.C., 1966.
- U.S. Standard Atmosphere, 1976, U.S. Government Printing Office, Washington, D.C., 1976 (Linked file is 17 MB).
- ↑ Geometric altitude vs. temperature, pressure, density, and the speed of sound derived from the 1962 U.S. Standard Atmosphere.
- ↑ Tuve, George Lewis; Bolz, Ray E. (1973). CRC handbook of tables for applied engineering science. Boca Raton: CRC Press. ISBN 0-8493-0252-8.
- ↑ U.S. Standard Atmosphere, 1962, U.S. Government Printing Office, Washington, D.C., 1962