Truncation (statistics)
In statistics, truncation results in values that are limited above or below, resulting in a truncated sample.[1] Truncation is similar to but distinct from the concept of statistical censoring. A truncated sample can be thought of as being equivalent to an underlying sample with all values outside the bounds entirely omitted, with not even a count of those omitted being kept. With statistical censoring, a note would be recorded documenting which bound (upper or lower) had been exceeded and the value of that bound. With truncated sampling, no note is recorded.
Applications
Usually the values that insurance adjusters receive are either left-truncated, right-censored or both. For example, if policyholders are subject to a policy limit, u, then any loss amounts that are actually above u are reported to the insurance company as being exactly u because u is the amount the insurance companies pay. The insurance company knows that the actual loss is greater than u but they don't know what it is. On the other hand, left truncation occurs when policyholders are subject to a deductible. If policyholders are subject to a deductible d, any loss amount that is less than d will not even be reported to the insurance company. If there is a claim on a policy limit of u and a deductible of d, any loss amount that is greater than u will be reported to the insurance company as a loss of u-d because that is the amount the insurance company has to pay. Therefore insurance loss data is left-truncated because the insurance company doesn't know if there are values below the deductible d because policyholders won't make a claim. The insurance loss is also right censored if the loss is greater than u because u is the most the insurance company will pay, so it only knows that your claim is greater than u, not what the claim amount is exactly.
Probability distributions
Truncation can be applied to any probability distribution and will lead to a new distribution, not usually one within the same family. Thus, if a random variable X has F(x) as its distribution function, the new random variable Y defined as having the distribution of X truncated to the semi-open interval (a,b] has the distribution function
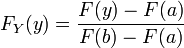
for y in the interval (a, b], and 0 or 1 otherwise. If truncation were to the closed interval [a,b], the distribution function would be
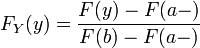
for y in the interval [a, b], and 0 or 1 otherwise.
Data analysis
The analysis of data where observations are treated as being from truncated versions of standard distributions can be undertaken using a maximum likelihood, where the likelihood would be derived from the distribution or density of the truncated distribution. This involves taking account of the factor 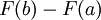 in the modified density function which will depend on the parameters of the original distribution.
In practice, if the fraction truncated is very small the effect of truncation might be ignored when analysing data. For example, it is common to use a normal distribution to model data whose values can only be positive but for which the typical range of values is well away from zero: in such cases a truncated or censored version of the normal distribution may formally be preferable (although there would be other alternatives also), but there would be very little change in results from the more complicated analysis. However, software is readily available for maximum likelihood estimation of even moderately complicated models, such as regression models, for truncated data.[2]
See also
- Censoring (statistics)
- Trimmed estimator
- Truncated distribution
- Truncated mean
- Truncated dependent variable