Torfaen (UK Parliament constituency)
Not to be confused with Torfaen (Assembly constituency).
Coordinates: 51°41′46″N 3°03′47″W / 51.696°N 3.063°W
| Torfaen | |
|---|---|
|
County constituency for the House of Commons | |
|
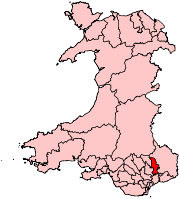
Boundary of Torfaen in Wales. | |
| Preserved county | Gwent |
| Electorate | 61,806 (December 2010)[1] |
| Major settlements | Cwmbran, Pontypool, Blaenavon |
| Current constituency | |
| Created | 1983 |
| Member of parliament | Paul Peter Murphy (Labour) |
| Number of members | One |
| Created from | Pontypool |
| Overlaps | |
| Welsh Assembly | South Wales East |
| European Parliament constituency | Wales |
Torfaen is a county constituency represented in the House of Commons of the Parliament of the United Kingdom. It returns one Member of Parliament (MP), elected by the first past the post system.
Boundaries
The area is a Labour Party stronghold with a majority of around 9,000, with the community of New Inn the only strong Conservative area. It voted Labour even amidst the huge Conservative majorities of 1983 and 1987. The area covers the new town of Cwmbran, Pontypool and its surrounding districts and stretches as far north as Blaenavon.
Members of Parliament
The seat has been represented since 1987 by Paul Murphy of the Labour Party.
| Election | Member[2] | Party | |
|---|---|---|---|
| 1983 | Leo Abse | Labour | |
| 1987 | Paul Peter Murphy | Labour | |
Elections
Elections in the 2010s
| General Election 2015: Torfaen | |||||
|---|---|---|---|---|---|
| Party | Candidate | Votes | % | ±% | |
| UKIP | Ken Beswick[3] | ||||
| Green | Matt Cooke[4] | ||||
| Socialist Labour | John Cox | ||||
| Communist | Mark Griffiths | ||||
| Plaid Cymru | Boydd Hackley-Green | ||||
| Conservative | Graham Smith | ||||
| Labour | Nicklaus Thomas-Symonds[5] | ||||
| Liberal Democrat | Alison Willott | ||||
| General Election 2010: Torfaen[6] | |||||
|---|---|---|---|---|---|
| Party | Candidate | Votes | % | ±% | |
| Labour | Paul Peter Murphy | 16,847 | 44.8 | −12.1 | |
| Conservative | Jonathan H. Burns | 7,541 | 20.0 | +4.2 | |
| Liberal Democrat | David P. Morgan | 6,264 | 16.6 | +0.9 | |
| Plaid Cymru | Rhys G. ab Elis | 2,005 | 5.3 | −0.9 | |
| BNP | Jennifer Noble | 1,657 | 4.4 | N/A | |
| Independent | Fred Wildgust | 1,419 | 3.8 | +3.8 | |
| UKIP | Gareth Dunn | 862 | 2.3 | −0.9 | |
| Independent | Richard J. Turner-Thomas | 607 | 1.6 | −0.5 | |
| Green | Owen Clarke | 438 | 1.2 | +1.2 | |
| Majority | 9,306 | 24.7 | |||
| Turnout | 37,640 | 61.5 | +2.2 | ||
| Labour hold | Swing | −8.2 | |||
Elections in the 2000s
| General Election 2005: Torfaen | |||||
|---|---|---|---|---|---|
| Party | Candidate | Votes | % | ±% | |
| Labour | Paul Peter Murphy | 20,472 | 56.9 | −5.2 | |
| Conservative | Nick Ramsay | 5,681 | 15.8 | −0.1 | |
| Liberal Democrat | Mrs. Veronica Kathleen Watkins | 5,678 | 15.8 | +4.6 | |
| Plaid Cymru | Aneurin J.M. Preece | 2,242 | 6.2 | −1.5 | |
| UKIP | David J. Rowlands | 1,145 | 3.2 | +1.3 | |
| Independent | Richard J. Turner-Thomas | 761 | 2.1 | +2.1 | |
| Majority | 14,791 | 41.1 | |||
| Turnout | 35,979 | 59.3 | +1.6 | ||
| Labour hold | Swing | −2.5 | |||
| General Election 2001: Torfaen | |||||
|---|---|---|---|---|---|
| Party | Candidate | Votes | % | ±% | |
| Labour | Paul Peter Murphy | 21,883 | 62.1 | −7.0 | |
| Conservative | Jason Philip Evans | 5,603 | 15.9 | +3.6 | |
| Liberal Democrat | Alan Masters | 3,936 | 11.2 | −1.0 | |
| Plaid Cymru | Stephen Paul Smith | 2,720 | 7.7 | +5.3 | |
| UKIP | Mrs. Brenda Muriel Vipass | 657 | 1.9 | N/A | |
| Socialist Alliance | Stephen Bell | 443 | 1.3 | N/A | |
| Majority | 16,280 | 46.2 | |||
| Turnout | 35,242 | 57.7 | −14.0 | ||
| Labour hold | Swing | ||||
Elections in the 1990s
| General Election 1997: Torfaen | |||||
|---|---|---|---|---|---|
| Party | Candidate | Votes | % | ±% | |
| Labour | Paul Peter Murphy | 29,863 | 69.1 | +5.0 | |
| Conservative | Neil Quentin Gordon Parish | 5,327 | 12.3 | −8.0 | |
| Liberal Democrat | Mrs. Jean E. Gray | 5,249 | 12.1 | −1.0 | |
| Referendum Party | Mrs. Deborah J. Holler | 1,245 | 2.9 | N/A | |
| Plaid Cymru | Robert W. Gough | 1,042 | 2.4 | −0.2 | |
| Green | Roger W. Coghill | 519 | 1.2 | N/A | |
| Majority | 24,536 | 56.7 | |||
| Turnout | 43,245 | 71.7 | |||
| Labour hold | Swing | +6.5 | |||
| General Election 1992: Torfaen[7] | |||||
|---|---|---|---|---|---|
| Party | Candidate | Votes | % | ±% | |
| Labour | Paul Peter Murphy | 30,352 | 64.1 | +5.4 | |
| Conservative | Mark C. Watkins | 9,598 | 20.3 | +1.2 | |
| Liberal Democrat | Malcolm G. Hewson | 6,178 | 13.1 | −6.9 | |
| Plaid Cymru (Green) | Dr. John I. Cox | 1,210 | 2.6 | +2.6 | |
| Majority | 20,754 | 43.8 | +5.1 | ||
| Turnout | 47,338 | 77.5 | +1.9 | ||
| Labour hold | Swing | +2.1 | |||
Elections in the 1980s
| General Election 1987: Torfaen | |||||
|---|---|---|---|---|---|
| Party | Candidate | Votes | % | ±% | |
| Labour | Paul Peter Murphy | 26,577 | 58.7 | +11.4 | |
| Liberal | Graham Robert Blackburn | 9,027 | 19.9 | −8.4 | |
| Conservative | Robert Ian Neilson Gordon | 8,632 | 19.1 | −3.2 | |
| Plaid Cymru | Jill Evans | 577 | 1.2 | −0.9 | |
| Green | Melvin John Witherden | 450 | 1.0 | N/A | |
| Majority | 17,550 | 38.8 | |||
| Turnout | 45,263 | 75.6 | +1.2 | ||
| Labour hold | Swing | +9.9 | |||
| General Election 1983: Torfaen | |||||
|---|---|---|---|---|---|
| Party | Candidate | Votes | % | ±% | |
| Labour | Leo Abse | 20,678 | 47.3 | N/A | |
| Liberal | Graham Robert Blackburn | 12,393 | 28.3 | N/A | |
| Conservative | P.J. Martin | 9,751 | 22.3 | N/A | |
| Plaid Cymru | Mrs. P.M.R. Cox | 896 | 2.1 | N/A | |
| Majority | 8,285 | 19.0 | N/A | ||
| Turnout | 43,718 | 74.4 | N/A | ||
| Labour win (new seat) | |||||
See also
Notes and references
- ↑ "Beyond 20/20 WDS - Table view". 2011 Electorate Figures. StatsWales. 1 December 2010. Retrieved 13 March 2011.
- ↑ Leigh Rayment's Historical List of MPs – Constituencies beginning with "T" (part 2)
- ↑ http://ukpollingreport.co.uk/2015guide/torfaen/
- ↑ http://www.southwalesargus.co.uk/news/11563245.Greens_announce_candidate_for_Torfaen/
- ↑ http://ukpollingreport.co.uk/2015guide/torfaen/
- ↑ BBC News Election Coverage - Torfaen
- ↑ "Politics Resources". Election 1992. Politics Resources. 9 April 1992. Retrieved 2010-12-06.
| ||||||||||||||||||||||