The Product Space
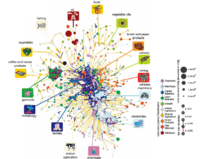
The Product Space is a network that formalizes the idea of relatedness between products traded in the global economy. The network first appeared in the July 2007 issue of Science in the article "The Product Space Conditions the Development of Nations,"[1] written by César Hidalgo, Bailey Klinger, Ricardo Hausmann, and Albert-László Barabási. The Product Space network has considerable implications for economic policy, as its structure helps elucidate why some countries undergo steady economic growth while others become stagnant and are unable to develop. The concept has been further developed and extended by the The Observatory of Economic Complexity, through visualizations such as the Product Exports Treemaps and new indexes such as the Economic Complexity Index (ECI), which have been condensed into the Atlas of Economic Complexity.[2] From the new analytic tools developed, Hausmann, Hidalgo and their team have been able to elaborate predictions of future economic growth.
Background
Conventional economic development theory has been unable to decipher the role of various product types in a country's economic performance.[3][4][5] Traditional ideals suggest that industrialization causes a “spillover” effect to new products, fostering subsequent growth. This idea, however, had not been incorporated in any formal economic models. The two prevailing approaches explaining a country’s economy focus on (a) the country’s relative proportion of capital and other productive factors[6] or (b) differences in technological capabilities and what underlies them.[7] These theories fail to capture inherent commonalities among products, which undoubtedly contribute to a country’s pattern of growth. The Product Space presents a novel approach to this problem, formalizing the intuitive idea that a country which exports bananas is more likely to next export mangoes than it is to export jet engines, for example.
The forest analogy
The idea of the Product Space can be conceptualized in the following manner: consider a product to be a tree, and the collection of all products to be a forest. A country consists of a set of firms—in this analogy, monkeys—which exploit products, or here, live in the trees. For the monkeys, the process of growth means moving from a poorer part of the forest, where the trees bear little fruit, to a better part of the forest. To do this, the monkeys must jump distances; that is, redeploy (physical, human, and institutional) capital to make new products. Traditional economic theory disregards the structure of the forest, assuming that there is always a tree within reach. However, if the forest is not homogeneous, there will be areas of dense tree growth in which the monkeys must exert little effort to reach new trees, and sparse regions in which jumping to a new tree is very difficult. In fact, if some areas are very deserted, monkeys may be unable to move through the forest at all. Therefore, the structure of the forest and a monkey’s location within it dictates the monkey’s capacity for growth; in terms of economy, the topology of this “product space” impacts a country’s ability to begin producing new goods.
Building the Product Space
There exists a number of factors that can describe the relatedness between a pair of products: the amount of capital required for production, technological sophistication, or inputs and outputs in a product’s value chain, for examples. Choosing to study one of these notions assume the others are relatively unimportant; instead, the Product Space considers an outcome-based measure built on the idea that if a pair of products are related because they require similar institutions, capital, infrastructure, technology, etc., they are likely to be produced in tandem. Dissimilar goods, on the other hand, are less likely to be co-produced. This a posteriori test of similarity is called “proximity.”
The concept of ‘proximity’
The Product Space quantifies the relatedness of products with a measure called proximity. In the above analogy, proximity would imply the closeness between a pair of trees in the forest. Proximity formalizes the intuitive idea that a country’s ability to produce a product depends on its ability to produce other products: a country which exports apples most probably has conditions suitable for exporting pears: the country would already have the soil, climate, packing equipment, refrigerated trucks, agronomists, phytosanitary laws, and working trade agreements. All of these could be easily redeployed to the pear business. These inputs would be futile, however, if the country instead chose to start producing a dissimilar product such as copper wire or home appliances. While quantifying such overlap between the set of markets associated with each product would be difficult, the measure of proximity uses an outcome-based method founded on the idea that similar products (apples and pears) are more likely to be produced in tandem than dissimilar products (apples and copper wire).
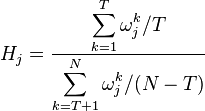
The RCA is a rigorous standard by which to consider competitive exportation in the global market. In order to exclude marginal exports, a country is said to export a product when they exhibit a Revealed Comparative Advantage (RCA) in it. Using the Balassa[8] definition of RCA, x(c,i) equals the value of exports in country c in the ith good.

If the RCA value exceeds one, the share of exports of a country in a given product is larger than the share of that product in all global trade. Under this measure, when RCA(c,i) is greater than or equal to 1, country c is said to export product i. When RCA(c,i) is less than 1, country c is not an effective exporter of i. With this convention, the proximity between a pair of goods i and j is defined in the following way:
 is the conditional probability of exporting good i given that you export good j. By considering the minimum of both conditional probabilities, we eliminate the problem that arises when a country is the sole exporter of a particular good: the conditional probability of exporting any other good given that one would be equal to one for all other goods exported by that country.
Source data
The Product Space uses international trade data from Feenstra, Lipset, Deng, Ma, and Mo’s World Trade Flows: 1962-2000 dataset,[9] cleaned and made compatible through a National Bureau of Economic Research (NBER) project. The dataset contains exports and imports both by country of origin and by destination. Products are disaggregated according to the Standardized International Trade Code at the four-digit level (SITC-4). Focusing on data from 1998-2000 yields 775 product classes and provides for each country the value exported to all other countries for each class. From this, a 775-by-775 matrix of proximities between every pair of products is created.
Matrix representation
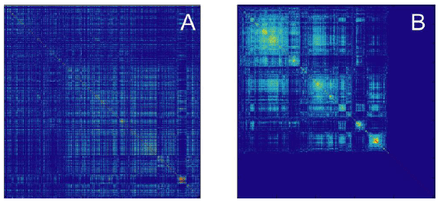
Each row and column of this matrix represents a particular good, and the off-diagonal entries in this matrix reflect the proximity between a pair of products. A visual representation of the proximity matrix reveals high modularity: some goods are highly connected and others are disconnected. Furthermore, the matrix is sparse. Five percent of its elements equal zero, 32% are less than 0.1, and 65% of the entries are below 0.2. Because of the sparseness, a network visualization is an appropriate way to represent this dataset.
The Product Space network
A network representation of the proximity matrix helps to develop intuition about its structure by establishing a visualization in which traditionally subtle trends become easily identifiable.
Maximum spanning tree
The initial step in building a network representation of product relatedness (proximities) involved first generating a network framework.
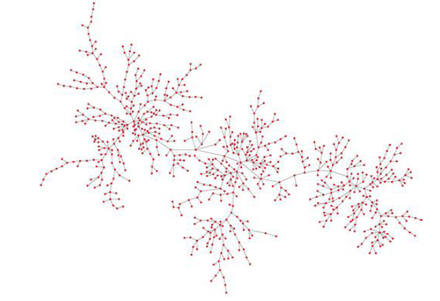
Here, the maximum spanning tree (MST) algorithm built a network of the 775 product nodes and the 774 links that would maximize the network’s total proximity value.
Network layout

The basic "skeleton" of the network is developed by imposing on it the strongest links which were not necessarily in the MST by employing a threshold on the proximity values; they chose to include all links of proximity greater than or equal to 0.55. This produced a network of 775 nodes and 1525 links. This threshold was chosen such that the network exhibited an average degree equal to 4, a common convention for effective network visualizations. With the framework complete, a force-directed spring algorithm was used to achieve a more ideal network layout. This algorithm considers each node to be a charged particle and the links are assumed to be springs; the layout is the resulting equilibrium, or relaxed, position of the system. Manual rearranging untangled dense clusters to achieve maximum aesthetic efficacy.
Node and link attributes
A system of colors and sizing allows for simultaneous assessment of the network structure with other covariates. The nodes of the Product Space are colored in terms of product classifications performed by Leamer[10] and the size of the nodes reflects the proportion of money moved by that particular industry in world trade. The color of the links reflects the strength of the proximity measurement between two products: dark red and blue indicate high proximity whereas yellow and light blue imply weaker relatedness.
Properties of the Product Space
In the final Product Space visualization, it is clear that the network exhibits heterogeneity and a core-periphery structure: the core of the network consists of metal products, machinery, and chemicals, whereas the periphery is formed by fishing, tropical, and cereal agriculture. On the left side of the network, there is a strong outlying cluster formed by garments and another belonging to textiles. At the bottom of the network, there exists a large electronics cluster, and at its right mining, forest, and paper products. The clusters of products in this space bear a striking resemblance to Leamer’s product classification system, which employed an entirely different methodology. This system groups products by the relative amount of capital, labor, land, or skills needed to export each product.
The Product Space also reveals a more explicit structure within product classes. Machinery, for example, appears to be naturally split into two clusters: heavy machinery/vehicles and electronics. Although the machinery cluster is connected to some capital-intensive metal products, it is not interwoven with similarly classified products such as textiles. In this way, the Product Space presents a new perspective on product classification.
Dynamics of the Product Space
The Product Space network can be used to study the evolution of a country’s productive structure. A country’s orientation within the space can be determined by observing where its products with RCA>1 are located. The images at right reveal patterns of specialization: the black squares indicate products exported by each region with RCA>1.
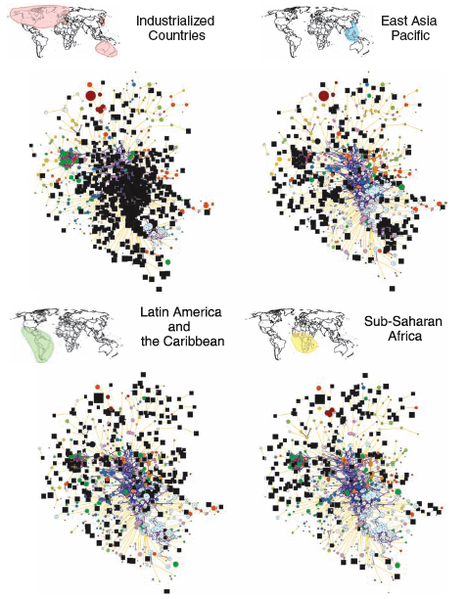
It can be seen that industrialized countries export products at the core, such as machinery, chemicals, and metal products. They also, however, occupy products at the periphery, like textiles, forest products, and animal agriculture. East Asian countries exhibit advantage in textiles, garments, and electronics. Latin America and the Caribbean have specialized in industries further towards the periphery, such as mining, agriculture, and garments. Sub-Saharan Africa demonstrates advantage in few product classes, all of which occupy the product space periphery. From these analyses, it is clear that each region displays a recognizable pattern of specialization easily discernible in the product space.
Empirical diffusion
The same methods can be used to observe a country’s development over time: how has the set of products in which it has advantage changed? By using the same conventions of visualization, it can be seen that countries move to new products by traversing the Product Space. Two measures quantify this movement through the Product Space from unoccupied products (products in which a given country has no advantage) to occupied products (products in which that country has an RCA>1). Such products are termed “transition products.”
The "density" is defined as a new product’s proximity to a given country’s current set of products:
A high density reflects that a country has many developed products surrounding the unoccupied product j. It was found that products which were not produced in 1990 but were produced by 1995 (transition products) exhibited higher density, implying that this value predicts a transition to an unoccupied product. The “discovery factor” measurement corroborates this idea:
 reflects the average density of all countries in which the jth product was a transition product and the average density of all countries in which the jth product was not developed. For 79% of products, this ratio exceeds 1, indicating that density is likely to predict a transition to a new product.
Simulated diffusion
The impact of Product Space's structure can be evaluated through simulations in which a country repeatedly moves to new products with proximities above a given threshold. At a threshold of proximity equal to 0.55, countries are able to diffuse through the core of the Product Space but the speed at which they do so is determined by the set of initial products. By raising the threshold to 0.65, some countries, whose initial products occupy periphery industries, become trapped and cannot find any near-enough products. This implies that a country’s orientation within the space can in fact dictate whether the country achieves economic growth.
Future work
Although the dynamics of a country's orientation within the network has been studied, there has been less focus on changes in the network topology itself. It is suggested that "changes in the product space represent an interesting avenue for future work."[11] Additionally, it would be interesting to explore the mechanisms governing countries' economic growth, in terms of acquisition of new capital, labor, institutions, etc., and whether the co-export proximity of the Product Space is truly an accurate reflection of similarity among such inputs.
See also
References
- ↑ C.A. Hidalgo, B. Klinger, A.-L. Barabási, R. Hausmann, Science 317 (2007).
- ↑ http://www.atlas.cid.harvard.edu/book/
- ↑ A. Hirschman, The Strategy of Economic Development (Yale University Press, New Haven, CT, 1958).
- ↑ P. Rosenstein-Rodan, Econ. J 53, 202 (1943).
- ↑ K. Matsuyama, J. Econ. Theory 58, 317 (1992).
- ↑ E. Heckscher, B. Ohlin, Heckscher-Ohlin Trade Theory, H. Flam, M. Flanders, Eds. (MIT Press, Cambridge, MA, 1991).
- ↑ P. Romer, J Polit. Econ. 94, 5 (1986).
- ↑ B. Balassa, The Review of Economics and Statistics 68, 315 (1986).
- ↑ R.R. Feenstra, H.D. Lipsey, A. Ma, H. Mo, HBER Work. Pap 11040 (2005).
- ↑ E. Leamer, Sources of Comparative Advantage: Theory and Evidence (MIT Press, Cambridge, MA, 1984).
- ↑ C.A. Hidalgo, B. Klinger, A.-L. Barabási, R. Hausmann, Science 317 485 (2007).


