Telford (UK Parliament constituency)
Coordinates: 52°40′41″N 2°26′56″W / 52.678°N 2.449°W
| Telford | |
|---|---|
|
Borough constituency for the House of Commons | |
|
Boundary of Telford in Shropshire. | |
|
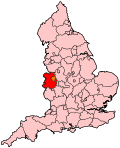
Location of Shropshire within England. | |
| County | Shropshire |
| Electorate | 65,938 (December 2010)[1] |
| Current constituency | |
| Created | 1997 |
| Member of parliament | David Wright (Labour) |
| Number of members | One |
| Created from | The Wrekin |
| Overlaps | |
| European Parliament constituency | West Midlands |
Telford is a constituency[n 1] represented in the House of Commons of the UK Parliament since 2001 by David Wright, a member of the Labour Party.[n 2]
History
Created from the more rural Wrekin constituency for the 1997 general election, Telford has been continuously held by the Labour Party, with a change in candidate in 2001. Bruce Grocott was its first-ever MP, serving for the first four years. In 2010 Wright's majority fell to a marginal figure of 981 votes, the narrowest result to date.
Boundaries
Telford is made up of several old industrial towns to the north of the River Severn and on the eastern flanks of the Wrekin (including Madeley, Dawley and the small townships in the Ironbridge Gorge) and numerous New Town developments including Woodside. However, not all of the Telford New Town developments are in the constituency; the northern parts and some western areas (including the town of Wellington) which pre-dates Telford, are in The Wrekin constituency.
All of the constituency is covered by Telford and Wrekin Borough Council.
Boundary changes to realign the constituency boundaries to fit with the borough's most recent ward revisions resulted in the addition of Ketley (from the constituency of The Wrekin) for the 2010 general election.
Constituency profile
Workless claimants, registered jobseekers, were in November 2012 lower than the national average of 3.8%, at 3.1% of the population based on a statistical compilation by The Guardian.[2]
Members of Parliament
| Election | Member[3] | Party | |
|---|---|---|---|
| 1997 | Bruce Grocott | Labour | |
| 2001 | David Wright | Labour | |
Elections
Elections in the 2010s
| General Election 2015: Telford[4] | |||||
|---|---|---|---|---|---|
| Party | Candidate | Votes | % | ±% | |
| Conservative | Lucy Allan[5] | ||||
| UKIP | Denis Allen[6] | ||||
| Liberal Democrat | Ian Croll | ||||
| Green | Peter Hawkins[7] | ||||
| Labour | David Wright | ||||
| General Election 2010: Telford[8][9] | |||||
|---|---|---|---|---|---|
| Party | Candidate | Votes | % | ±% | |
| Labour | David Wright | 15,977 | 38.7 | -9.5 | |
| Conservative | Tom Biggins | 14,996 | 36.3 | +3.2 | |
| Liberal Democrat | Phillip Bennion | 6,399 | 15.5 | +1.4 | |
| UKIP | Denis Allen | 2,428 | 5.9 | +1.2 | |
| BNP | Phil Spencer | 1,513 | 3.7 | +3.7 | |
| Majority | 981 | 2.4 | |||
| Turnout | 41,313 | 63.5 | +4.8 | ||
| Labour hold | Swing | -6.3 | |||
Elections in the 2000s
| General Election 2005: Telford | |||||
|---|---|---|---|---|---|
| Party | Candidate | Votes | % | ±% | |
| Labour | David Wright | 16,506 | 48.3 | −6.3 | |
| Conservative | Stella Kyriazis | 11,100 | 32.5 | +5.1 | |
| Liberal Democrat | Ian Jenkins | 4,941 | 14.4 | +1.5 | |
| UKIP | Tom McCartney | 1,659 | 4.9 | +1.3 | |
| Majority | 5,406 | 15.8 | |||
| Turnout | 34,206 | 57.7 | +5.7 | ||
| Labour hold | Swing | −5.7 | |||
| General Election 2001: Telford | |||||
|---|---|---|---|---|---|
| Party | Candidate | Votes | % | ±% | |
| Labour | David Wright | 16,854 | 54.6 | -3.2 | |
| Conservative | Andrew Henderson | 8,471 | 27.4 | 0.0 | |
| Liberal Democrat | Sally Wiggin | 3,983 | 12.9 | +1.1 | |
| UKIP | Nicola Brookes | 1,098 | 3.6 | N/A | |
| Socialist Alliance | Mike Jeffries | 469 | 1.5 | N/A | |
| Majority | 8,383 | 27.2 | |||
| Turnout | 30,875 | 52.0 | -13.7 | ||
| Labour hold | Swing | ||||
Elections in the 1990s
| General Election 1997: Telford | |||||
|---|---|---|---|---|---|
| Party | Candidate | Votes | % | ±% | |
| Labour | Bruce Grocott | 21,456 | 57.8 | N/A | |
| Conservative | Bernard Gentry | 10,166 | 27.4 | N/A | |
| Liberal Democrat | Nathaniel Green | 4,371 | 11.8 | N/A | |
| Referendum Party | C. Morris | 1,119 | 3.0 | N/A | |
| Majority | 11,290 | N/A | |||
| Turnout | 65.6 | N/A | |||
| Labour hold | Swing | N/A | |||
See also
Notes and references
- Notes
- References
- ↑ "Electorate Figures – Boundary Commission for England". 2011 Electorate Figures. Boundary Commission for England. 4 March 2011. Retrieved 13 March 2011.
- ↑ Unemployment claimants by constituency The Guardian
- ↑ Leigh Rayment's Historical List of MPs – Constituencies beginning with "T" (part 1)
- ↑ http://ukpollingreport.co.uk/2015guide/telford/
- ↑ http://www.lucyallan.com
- ↑ http://ukpollingreport.co.uk/2015guide/telford/
- ↑ http://telfordandwrekin.greenparty.org.uk/people.html
- ↑ http://ukpollingreport.co.uk/guide/seat-profiles/telford
- ↑ "BBC NEWS – Election 2010 – Telford". BBC News.

