Tamworth Borough Council election, 2007

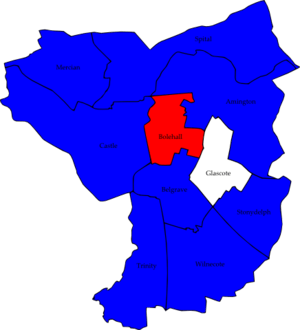
Map of the results of the 2007 Tamworth council election.
Conservatives in blue,
Labour in red and independent in white.
Elections to Tamworth Borough Council were held on 3 May 2007. One third of the council was up for election and the Conservative party stayed in overall control of the council. Overall turnout was 31.9%
After the election, the composition of the council was
Election result
| Tamworth Local Election Result 2007 |
| Party |
Seats |
Gains |
Losses |
Net gain/loss |
Seats % |
Votes % |
Votes |
+/− |
| |
Conservative |
8 |
3 |
0 |
+3 |
80.0 |
45.0 |
8,183 |
-5.9% |
| |
Labour |
1 |
0 |
3 |
-3 |
10.0 |
37.7 |
6,856 |
-3.8% |
| |
Independent |
1 |
0 |
0 |
0 |
10.0 |
8.9 |
1,624 |
+8.9% |
| |
Liberal Democrat |
0 |
0 |
0 |
0 |
0 |
6.1 |
1,109 |
-1.5% |
| |
BNP |
0 |
0 |
0 |
0 |
0 |
2.2 |
395 |
+2.2% |
Ward results
| Amington |
| Party |
Candidate |
Votes |
% |
±% |
|
Conservative |
John Wells |
841 |
43.2 |
-13.4 |
|
Labour |
Julie Holland |
757 |
38.9 |
-4.5 |
|
Independent |
James Mckay |
348 |
17.9 |
+17.9 |
| Majority |
84 |
4.3 |
-8.9 |
| Turnout |
1,946 |
32.0 |
-1.1 |
|
Conservative hold |
Swing |
|
|
| Castle |
| Party |
Candidate |
Votes |
% |
±% |
|
Conservative |
Steven Claymore |
917 |
47.6 |
-2.7 |
|
Labour |
Marion Couchman |
736 |
38.2 |
+0.7 |
|
Liberal Democrat |
Jenny Pinkett |
273 |
14.2 |
+2.0 |
| Majority |
181 |
9.4 |
-3.4 |
| Turnout |
1,926 |
34.5 |
-1.2 |
|
Conservative gain from Labour |
Swing |
|
|
| Glascote |
| Party |
Candidate |
Votes |
% |
±% |
|
Independent |
Chris Cooke |
587 |
40.9 |
+40.9 |
|
Labour |
Sheree Peaple |
467 |
32.5 |
-21.1 |
|
Conservative |
Debbie James |
381 |
26.6 |
-19.8 |
| Majority |
120 |
8.4 |
|
| Turnout |
1,435 |
25.6 |
+1.7 |
|
Independent hold |
Swing |
|
|
| Mercian |
| Party |
Candidate |
Votes |
% |
±% |
|
Conservative |
Martyn Price |
729 |
36.5 |
-5.5 |
|
Labour |
Neil Fuller |
579 |
29.0 |
-4.8 |
|
Independent |
Richard Kingstone |
444 |
22.3 |
+22.3 |
|
Liberal Democrat |
Geoff Blake |
243 |
12.2 |
-12.0 |
| Majority |
150 |
7.5 |
-0.7 |
| Turnout |
1,995 |
38.0 |
+1.0 |
|
Conservative gain from Labour |
Swing |
|
|
| Spital |
| Party |
Candidate |
Votes |
% |
±% |
|
Conservative |
Maureen Gant |
1,122 |
52.9 |
+2.2 |
|
Labour |
Karen Hirons |
682 |
32.2 |
-0.8 |
|
Liberal Democrat |
Jenny Blake |
315 |
14.9 |
-1.4 |
| Majority |
440 |
20.7 |
+3.0 |
| Turnout |
2,119 |
38.5 |
-1.0 |
|
Conservative hold |
Swing |
|
|
| Trinity |
| Party |
Candidate |
Votes |
% |
±% |
|
Conservative |
Jeremy Oates |
1,086 |
54.2 |
-0.2 |
|
Labour |
David Foster |
638 |
31.9 |
+1.8 |
|
Liberal Democrat |
Roger Jones |
278 |
13.9 |
-1.6 |
| Majority |
448 |
22.3 |
-2.0 |
| Turnout |
2,002 |
34.0 |
-0.8 |
|
Conservative hold |
Swing |
|
|
References
