Tahe County
| Tahe County 塔河县 | |
|---|---|
| County | |
.png) Tahe County (red) in Da Hinggan Ling Prefecture (yellow) and Heilongjiang | |
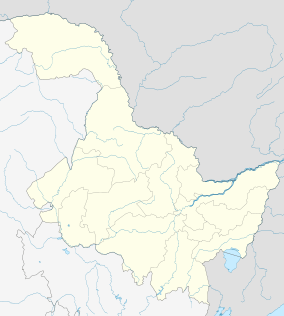 Tahe Location of the county seat in Heilongjiang | |
| Coordinates: 52°45′N 124°34′E / 52.750°N 124.567°ECoordinates: 52°45′N 124°34′E / 52.750°N 124.567°E | |
| Country | People's Republic of China |
| Province | Heilongjiang |
| Prefecture | Da Hinggan Ling |
| Time zone | China Standard (UTC+8) |
Tahe (Chinese: 塔河; pinyin: Tǎhé) is a county in the far north of Heilongjiang province, People's Republic of China. It is under the jurisdiction of Daxing'anling Prefecture.
Demographics
The population of the district was 106,732 in 1999.[1]
Climate
Tahe County has a subarctic climate (Köppen Dwc) with short, warm, wet summers and long, brutally cold and dry winters. Monsoonal influences are strong, as 75% of the annual precipitation occurs from June to September. Although snowfall is extremely light, totalling only a few centimetres during the winter, it does not melt until May. The region is in the discontinuous permafrost zone, which severely limits land use possibilities since only exposed areas thaw fully during the summer, and fishing is the most important economic activity.
| Climate data for Tahe County | |||||||||||||
|---|---|---|---|---|---|---|---|---|---|---|---|---|---|
| Month | Jan | Feb | Mar | Apr | May | Jun | Jul | Aug | Sep | Oct | Nov | Dec | Year |
| Record high °C (°F) | −0.2 (31.6) |
6.3 (43.3) |
17.9 (64.2) |
25.5 (77.9) |
35.7 (96.3) |
35.4 (95.7) |
37.0 (98.6) |
34.8 (94.6) |
31.6 (88.9) |
23.6 (74.5) |
12.5 (54.5) |
0.8 (33.4) |
37.0 (98.6) |
| Average high °C (°F) | −17.4 (0.7) |
−10.9 (12.4) |
−2.4 (27.7) |
8.1 (46.6) |
17.3 (63.1) |
23.8 (74.8) |
25.6 (78.1) |
23.1 (73.6) |
16.8 (62.2) |
6.0 (42.8) |
−7.9 (17.8) |
−17 (1) |
5.4 (41.8) |
| Daily mean °C (°F) | −25.4 (−13.7) |
−20.5 (−4.9) |
−11.0 (12.2) |
1.0 (33.8) |
9.4 (48.9) |
15.8 (60.4) |
18.5 (65.3) |
15.6 (60.1) |
8.5 (47.3) |
−1.7 (28.9) |
−15.3 (4.5) |
−23.8 (−10.8) |
−2.41 (27.67) |
| Average low °C (°F) | −31.5 (−24.7) |
−28.6 (−19.5) |
−19.3 (−2.7) |
−5.9 (21.4) |
1.1 (34) |
7.8 (46) |
12.1 (53.8) |
9.6 (49.3) |
1.8 (35.2) |
−8.1 (17.4) |
−21.8 (−7.2) |
−29.5 (−21.1) |
−9.4 (15.2) |
| Record low °C (°F) | −45.8 (−50.4) |
−42.9 (−45.2) |
−36.8 (−34.2) |
−23.7 (−10.7) |
−10.6 (12.9) |
−4.3 (24.3) |
0.4 (32.7) |
−0.7 (30.7) |
−10.5 (13.1) |
−28.7 (−19.7) |
−39.6 (−39.3) |
−45.3 (−49.5) |
−45.8 (−50.4) |
| Average precipitation mm (inches) | 5.7 (0.224) |
3.5 (0.138) |
7.1 (0.28) |
22.9 (0.902) |
38.2 (1.504) |
84.9 (3.343) |
118.5 (4.665) |
90.5 (3.563) |
54.4 (2.142) |
18.9 (0.744) |
11.1 (0.437) |
6.8 (0.268) |
462.5 (18.21) |
| Avg. precipitation days (≥ 0.1 mm) | 8.1 | 5.0 | 5.0 | 8.1 | 10.3 | 14.8 | 16.5 | 15.6 | 12.2 | 7.1 | 8.4 | 9.0 | 120.1 |
| Source #1: 塔河城市介绍 | |||||||||||||
| Source #2: 中央气象台 (daily maxima and minima) | |||||||||||||
External links
- (Chinese) Government Site - Google translation
Notes and references
- ↑ (English) National Population Statistics Materials by County and City - 1999 Period, in China County & City Population 1999, Harvard China Historical GIS
| ||||||||||||||||||||||||||