Swindon Borough Council election, 2007
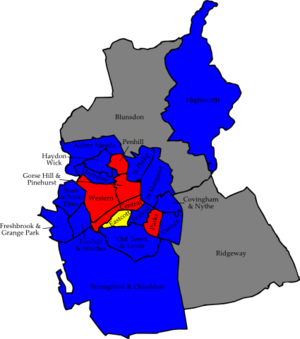
Map of the results of the 2007 Swindon council election.
Conservatives in blue,
Labour in red and Liberal Democrat in yellow. Wards in grey were not contested in 2007.
The 2007 Swindon Borough Council election took place on 4 May 2007 to elect members of Swindon Unitary Council in Wiltshire, England. One third of the council was up for election and the Conservative party stayed in overall control of the council.[1]
After the election, the composition of the council was
Campaign
92 candidates were contesting 21 seats with 2 seats available in Haydon Wick wards.[3][4] Both Conservative and Labour parties contested every seat, while the Liberal Democrats had 20 candidates.[3] Other political parties contesting the election included the Green party with 16 candidates, United Kingdom Independence Party with 7 and the British National Party with 3.[3]
Issues in the election included regeneration of the town, affordable housing, crime[5] and preserving green space.[6] The Conservative council's plans to move to fortnightly rubbish collection were also criticised by the Labour party.[7]
For the election voters were able to cast their vote at any polling station or library instead of just their polling station, as well as internet and text voting being available.[3][8] The vote count was also done electronically, however problems at a few polling stations meant some votes had to be checked manually.[9] This meant the election count was 2 hours later than expected,[10] with overall turnout in the election being 33.8%.[11]
Election result
The results saw the Conservatives stay in control of the council with 43 seats, compared to 13 for Labour and 3 Liberal Democrats.[10] Both the Conservative and Labour parties made 2 gains, with each party taking 1 seat from the other.[12] The Conservatives gained Moredon from Labour, while Labour took a seat back in Central ward.[12] Both parties also gained a seat from an independent, with the Conservatives taking Freshbrook and Grange Park, while Labour took Penhill.[12] Elsewhere Conservative candidates held on by small majorities of 36 and 45 over Labour in St Philip and Walcot wards respectively.[12]
| Swindon Local Election Result 2007[11][2] |
| Party |
Seats |
Gains |
Losses |
Net gain/loss |
Seats % |
Votes % |
Votes |
+/− |
| |
Conservative |
15 |
2 |
1 |
+1 |
71.4 |
46.8 |
23,429 |
-0.8% |
| |
Labour |
5 |
2 |
1 |
+1 |
23.8 |
28.9 |
14,458 |
-1.3% |
| |
Liberal Democrat |
1 |
0 |
0 |
0 |
4.8 |
13.2 |
6,635 |
-0.9% |
| |
Green |
0 |
0 |
0 |
0 |
0 |
5.9 |
2,946 |
+0.1% |
| |
UKIP |
0 |
0 |
0 |
0 |
0 |
3.7 |
1,875 |
+3.7% |
| |
BNP |
0 |
0 |
0 |
0 |
0 |
1.2 |
597 |
+0.5% |
| |
Independent |
0 |
0 |
2 |
-2 |
0 |
0.3 |
165 |
-0.7% |
Ward results
| Abbey Meads[11] |
| Party |
Candidate |
Votes |
% |
±% |
|
Conservative |
Peter Stoddart |
1,639 |
69.3 |
-1.1 |
|
Labour |
Ian Carroll |
375 |
15.9 |
+2.1 |
|
Liberal Democrat |
Richard Law |
204 |
8.6 |
+0.2 |
|
Green |
Richard Uzzell |
146 |
6.2 |
-1.2 |
| Majority |
1,264 |
53.5 |
-3.1 |
| Turnout |
2,364 |
26.8 |
|
|
Conservative hold |
Swing |
-1.6% |
|
| Central[11] |
| Party |
Candidate |
Votes |
% |
±% |
|
Labour |
Derique Montaut |
1,092 |
47.1 |
+0.6 |
|
Conservative |
Karen Leakey |
663 |
28.6 |
-1.1 |
|
Liberal Democrat |
Steven Pipe |
301 |
13.0 |
-1.7 |
|
Green |
Karsten Evans |
156 |
6.7 |
+0.3 |
|
Independent |
David Cox |
105 |
4.5 |
+1.9 |
| Majority |
429 |
18.5 |
+1.7 |
| Turnout |
2,317 |
30.9 |
|
|
Labour gain from Conservative |
Swing |
+0.8% |
|
| Covingham and Nythe[11] |
| Party |
Candidate |
Votes |
% |
±% |
|
Conservative |
Glenn Smith |
1,497 |
54.2 |
-3.3 |
|
Labour |
Maureen Dilley |
743 |
26.9 |
-15.6 |
|
UKIP |
Cynthia Desmond |
323 |
11.7 |
+11.7 |
|
Liberal Democrat |
David Pajak |
199 |
7.2 |
+7.2 |
| Majority |
754 |
27.3 |
+12.2 |
| Turnout |
2,762 |
40.8 |
|
|
Conservative hold |
Swing |
+6.1% |
|
| Eastcott[11] |
| Party |
Candidate |
Votes |
% |
±% |
|
Liberal Democrat |
Martin Wiltshire |
879 |
39.6 |
-9.3 |
|
Conservative |
Paul Gregory |
551 |
24.9 |
+5.2 |
|
Labour |
Sarah Bush |
526 |
23.7 |
+3.0 |
|
Green |
Bill Hughes |
261 |
11.8 |
+1.1 |
| Majority |
328 |
14.8 |
-13.4 |
| Turnout |
2,217 |
29.6 |
|
|
Liberal Democrat hold |
Swing |
-7.2% |
|
| Freshbrook and Grange Park[11] |
| Party |
Candidate |
Votes |
% |
±% |
|
Conservative |
Michael Dickinson |
1,152 |
49.0 |
+3.8 |
|
Liberal Democrat |
Judith Peppitt |
669 |
28.5 |
-5.0 |
|
Labour |
Carol Heavens |
393 |
16.7 |
+2.1 |
|
Green |
Jim Santaniello |
136 |
5.8 |
-0.9 |
| Majority |
483 |
20.6 |
+8.9 |
| Turnout |
2,350 |
31.2 |
|
|
Conservative gain from Independent |
Swing |
+4.4% |
|
| Gorse Hill and Pinehurst[11] |
| Party |
Candidate |
Votes |
% |
±% |
|
Labour |
John Ballman |
850 |
44.8 |
+3.5 |
|
Conservative |
Louise Gallavin |
485 |
25.6 |
+4.5 |
|
BNP |
Reg Bates |
212 |
11.2 |
-4.8 |
|
Liberal Democrat |
Les Wood |
154 |
8.1 |
-0.4 |
|
UKIP |
Robin Tingey |
104 |
5.5 |
+5.5 |
|
Green |
Neil Gutteridge |
91 |
4.8 |
+4.8 |
| Majority |
365 |
19.3 |
-0.9 |
| Turnout |
1,896 |
27.8 |
|
|
Labour hold |
Swing |
-1.0% |
|
| Highworth[11] |
| Party |
Candidate |
Votes |
% |
±% |
|
Conservative |
Melanie Duff |
1,492 |
56.8 |
+2.0 |
|
Labour |
Gerald Edwards |
696 |
26.5 |
-0.1 |
|
Green |
Andy Day |
257 |
9.8 |
-1.1 |
|
Liberal Democrat |
Hannah Pajak |
184 |
7.0 |
-0.8 |
| Majority |
796 |
30.3 |
+2.1 |
| Turnout |
2,629 |
40.5 |
|
|
Conservative hold |
Swing |
+1.0% |
|
| Moredon[11] |
| Party |
Candidate |
Votes |
% |
±% |
|
Conservative |
Stephanie Exell |
1,187 |
47.7 |
+2.7 |
|
Labour |
Maureen Caton |
885 |
35.6 |
-7.8 |
|
UKIP |
Kathleen Webb |
218 |
8.8 |
+8.8 |
|
Liberal Democrat |
Heidi Teague |
197 |
7.9 |
-3.7 |
| Majority |
302 |
12.1 |
+10.5 |
| Turnout |
2,487 |
33.7 |
|
|
Conservative gain from Labour |
Swing |
+5.2% |
|
| Old Town and Lawn[11] |
| Party |
Candidate |
Votes |
% |
±% |
|
Conservative |
Fionuala Foley |
2,044 |
58.7 |
+0.1 |
|
Liberal Democrat |
Mark Wheaver |
543 |
15.6 |
-1.4 |
|
Labour |
Cindy Matthews |
468 |
13.4 |
-0.9 |
|
Green |
Christine Smith |
245 |
7.0 |
-3.1 |
|
UKIP |
Terrence Hayward |
180 |
5.2 |
+5.2 |
| Majority |
1,501 |
43.1 |
+1.5 |
| Turnout |
3,480 |
43.8 |
|
|
Conservative hold |
Swing |
+0.8% |
|
| Parks[11] |
| Party |
Candidate |
Votes |
% |
±% |
|
Labour |
Fay Howard |
775 |
40.9 |
-1.7 |
|
Conservative |
Graham Cherry |
603 |
31.8 |
-3.8 |
|
BNP |
Chris Southgate |
223 |
11.8 |
+11.8 |
|
Liberal Democrat |
Helen Thompson |
213 |
11.2 |
+11.2 |
|
Green |
David Miles |
81 |
4.3 |
-17.5 |
| Majority |
172 |
9.1 |
+2.1 |
| Turnout |
1,895 |
27.7 |
|
|
Labour hold |
Swing |
+1.0% |
|
| Penhill[11] |
| Party |
Candidate |
Votes |
% |
±% |
|
Labour |
Paul Baker |
519 |
41.7 |
-3.5 |
|
Liberal Democrat |
Tel Hudson |
314 |
25.2 |
-5.7 |
|
Conservative |
Halina Tomlinson |
249 |
20.0 |
-3.9 |
|
BNP |
Ken Waters |
162 |
13.0 |
+13.0 |
| Majority |
205 |
16.5 |
+2.2 |
| Turnout |
1,244 |
27.8 |
|
|
Labour gain from Independent |
Swing |
+1.1% |
|
| Shaw and Nine Elms[11] |
| Party |
Candidate |
Votes |
% |
±% |
|
Conservative |
Garry Perkins |
1,244 |
56.1 |
-4.1 |
|
Liberal Democrat |
James Farr |
392 |
17.7 |
+4.8 |
|
Labour |
Mary Gladman |
375 |
16.9 |
-1.2 |
|
Green |
Jennifer Miles |
207 |
9.3 |
+0.5 |
| Majority |
852 |
38.4 |
-3.7 |
| Turnout |
2,218 |
31.7 |
|
|
Conservative hold |
Swing |
-4.4% |
|
| St Margaret[11] |
| Party |
Candidate |
Votes |
% |
±% |
|
Conservative |
Russell Holland |
1,325 |
51.8 |
-11.6 |
|
Labour |
Michael Spry |
728 |
28.5 |
-8.1 |
|
Liberal Democrat |
Peter Wood |
264 |
10.3 |
+10.3 |
|
UKIP |
Robert Feal-Martinez |
239 |
9.4 |
+9.4 |
| Majority |
597 |
23.4 |
-3.5 |
| Turnout |
2,556 |
32.3 |
|
|
Conservative hold |
Swing |
-1.7% |
|
| St Philip[11] |
| Party |
Candidate |
Votes |
% |
±% |
|
Conservative |
Paul Findlow |
1,254 |
41.9 |
+0.1 |
|
Labour |
Teresa Page |
1,218 |
40.7 |
-0.3 |
|
UKIP |
Peter Thompson-Watt |
212 |
7.1 |
+7.1 |
|
Liberal Democrat |
Ann Richards |
186 |
6.2 |
-2.4 |
|
Green |
Raymond Smith |
125 |
4.2 |
-4.4 |
| Majority |
36 |
1.2 |
+0.3 |
| Turnout |
2,995 |
41.7 |
|
|
Conservative hold |
Swing |
+0.2% |
|
| Toothill & Westlea[11] |
| Party |
Candidate |
Votes |
% |
±% |
|
Conservative |
Steve Wakefield |
979 |
52.3 |
+4.1 |
|
Labour |
Junab Ali |
411 |
21.9 |
-3.5 |
|
Liberal Democrat |
Christopher Shepherd |
297 |
15.9 |
+1.0 |
|
Green |
Marilyn Harrison |
186 |
9.9 |
-1.6 |
| Majority |
568 |
30.3 |
+7.5 |
| Turnout |
1,873 |
32.3 |
|
|
Conservative hold |
Swing |
+3.8% |
|
| Walcot[11] |
| Party |
Candidate |
Votes |
% |
±% |
|
Conservative |
Peter Mallinson |
756 |
39.0 |
+5.3 |
|
Labour |
Neil Heavens |
711 |
36.7 |
-5.1 |
|
Liberal Democrat |
Kathy McCarthy |
249 |
12.9 |
-4.3 |
|
UKIP |
Stephen Halden |
141 |
7.3 |
+7.3 |
|
Green |
Ray Burcham |
80 |
4.1 |
-3.1 |
| Majority |
45 |
2.3 |
|
| Turnout |
1,937 |
34.7 |
|
|
Conservative hold |
Swing |
+5.2% |
|
| Western[11] |
| Party |
Candidate |
Votes |
% |
±% |
|
Labour |
Des Moffatt |
1,268 |
49.4 |
+3.1 |
|
Conservative |
Jon Watton |
656 |
25.5 |
-7.4 |
|
Liberal Democrat |
Mark Cousens |
243 |
9.5 |
-6.2 |
|
UKIP |
Greg Heathcliffe |
188 |
7.3 |
+7.3 |
|
Green |
Deborah Schofield |
153 |
6.0 |
+6.0 |
|
Independent |
Michael Morton |
60 |
2.3 |
+2.3 |
| Majority |
612 |
23.8 |
+10.4 |
| Turnout |
2,568 |
31.6 |
|
|
Labour hold |
Swing |
+5.2% |
|
| Wroughton and Chiseldon[11] |
| Party |
Candidate |
Votes |
% |
±% |
|
Conservative |
Bill Morton |
1,650 |
55.3 |
+0.2 |
|
Liberal Democrat |
Victor Godman |
668 |
22.4 |
+7.6 |
|
Labour |
Ruairi Tobin |
442 |
14.8 |
+0.3 |
|
Green |
Bob Heritage |
223 |
7.5 |
+0.4 |
| Majority |
982 |
32.9 |
-7.4 |
| Turnout |
2,983 |
37.6 |
|
|
Conservative hold |
Swing |
-3.7% |
|
References