Swindon Borough Council election, 2004
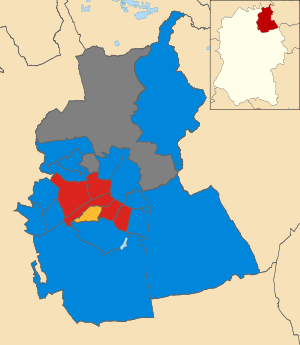
Map of the results of the 2004 Swindon council election.
Conservatives in blue,
Labour in red and Liberal Democrats in yellow. Wards in grey were not contested in 2004.
The 2004 Swindon Borough Council election took place on 10 June 2004 to elect members of Swindon Unitary Council in Wiltshire, England. One third of the council was up for election and the Conservative party gained overall control of the council from no overall control.[1]
After the election, the composition of the council was
Election result
| Swindon Local Election Result 2004[3][4] |
| Party |
Seats |
Gains |
Losses |
Net gain/loss |
Seats % |
Votes % |
Votes |
+/− |
| |
Conservative |
14 |
|
|
+4 |
70.0 |
45.1 |
19,466 |
+3.3% |
| |
Labour |
5 |
|
|
-3 |
25.0 |
27.8 |
11,971 |
-2.9% |
| |
Liberal Democrat |
1 |
|
|
-1 |
5.0 |
20.3 |
8,749 |
-5.0% |
| |
Green |
0 |
|
|
0 |
0 |
4.9 |
2,101 |
+4.3% |
| |
UKIP |
0 |
|
|
0 |
0 |
0.7 |
311 |
+0.0% |
| |
Socialist Alliance |
0 |
|
|
0 |
0 |
0.6 |
249 |
-0.1% |
| |
Independent |
0 |
|
|
0 |
0 |
0.4 |
166 |
+0.4% |
| |
Socialist Alternative |
0 |
|
|
0 |
0 |
0.2 |
105 |
+0.2% |
Ward results
| Abbey Meads[3] |
| Party |
Candidate |
Votes |
% |
±% |
|
Conservative |
Charles Lister |
641 |
58.2 |
-6.7 |
|
Labour |
James Grant |
232 |
21.1 |
+4.2 |
|
Liberal Democrat |
Richard Law |
228 |
20.7 |
+2.6 |
| Majority |
409 |
37.1 |
-9.7 |
| Turnout |
1,101 |
|
|
| Central[3] |
| Party |
Candidate |
Votes |
% |
±% |
|
Labour |
Maire Darker |
796 |
42.6 |
+5.0 |
|
Conservative |
Matthew McCue |
479 |
25.6 |
+8.1 |
|
Liberal Democrat |
Tel Hudson |
363 |
19.4 |
-19.2 |
|
Green |
Karsten Evans |
161 |
8.6 |
+8.6 |
|
Socialist Alliance |
Andrew Newman |
69 |
3.7 |
+3.7 |
| Majority |
317 |
17.0 |
|
| Turnout |
1,868 |
|
|
| Covingham and Nythe[3] |
| Party |
Candidate |
Votes |
% |
±% |
|
Conservative |
Dale Heenan |
1,327 |
52.1 |
-1.3 |
|
Labour |
Patricia Spry |
834 |
32.7 |
+1.8 |
|
Liberal Democrat |
Ellen Aylett |
386 |
15.2 |
-0.5 |
| Majority |
493 |
19.4 |
-3.1 |
| Turnout |
2,547 |
|
|
| Dorcan[3] |
| Party |
Candidate |
Votes |
% |
±% |
|
Conservative |
Roderick Bluh |
1,232 |
50.6 |
+6.6 |
|
Labour |
David Cox |
792 |
32.5 |
-9.7 |
|
Liberal Democrat |
Kathleen McCarthy |
411 |
16.9 |
+3.1 |
| Majority |
440 |
18.1 |
+16.3 |
| Turnout |
2,435 |
|
|
| Eastcott[3] |
| Party |
Candidate |
Votes |
% |
±% |
|
Liberal Democrat |
Stanley Pajak |
978 |
46.2 |
-7.5 |
|
Conservative |
Brenda Craven |
452 |
21.3 |
+1.0 |
|
Labour |
Richard Young |
443 |
20.9 |
-5.1 |
|
Green |
Christine Smith |
245 |
11.6 |
+11.6 |
| Majority |
526 |
24.8 |
-3.0 |
| Turnout |
2,118 |
|
|
| Freshbrook and Grange Park[3] |
| Party |
Candidate |
Votes |
% |
±% |
|
Conservative |
Peter Greenhalgh |
1,013 |
42.7 |
+8.2 |
|
Liberal Democrat |
Tracy Fisher |
942 |
39.7 |
-7.2 |
|
Labour |
Sarah Bush |
418 |
17.6 |
-1.0 |
| Majority |
71 |
3.0 |
|
| Turnout |
2,373 |
|
|
| Gorse Hill and Pinehurst[3] |
| Party |
Candidate |
Votes |
% |
±% |
|
Labour |
Ericqua Ballman |
701 |
44.2 |
+3.8 |
|
Conservative |
Halina Roberts |
429 |
27.1 |
+3.8 |
|
Liberal Democrat |
Jacob Pajak |
275 |
17.4 |
-6.2 |
|
Socialist Alliance |
Roy North |
180 |
11.4 |
-1.3 |
| Majority |
272 |
17.2 |
+0.4 |
| Turnout |
1,585 |
|
|
| Haydon Wick[3] |
| Party |
Candidate |
Votes |
% |
±% |
|
Conservative |
Wayne Lawley |
1,271 |
54.7 |
+2.2 |
|
Labour |
John Keepin |
576 |
24.8 |
-2.5 |
|
Liberal Democrat |
Derek Richards |
475 |
20.5 |
+0.3 |
| Majority |
695 |
29.9 |
+4.7 |
| Turnout |
2,322 |
|
|
| Highworth[3] |
| Party |
Candidate |
Votes |
% |
±% |
|
Conservative |
Anthony Peake |
1,260 |
51.1 |
+3.9 |
|
Labour |
Lynn Vardy |
633 |
25.7 |
-9.0 |
|
Liberal Democrat |
Jennifer Shorten |
371 |
15.1 |
-3.0 |
|
Green |
Andrew Day |
200 |
8.1 |
+8.1 |
| Majority |
627 |
25.4 |
+13.0 |
| Turnout |
2,464 |
|
|
| Old Town and Lawn[3] |
| Party |
Candidate |
Votes |
% |
±% |
|
Conservative |
Michael Bawden |
1,954 |
56.0 |
+1.2 |
|
Liberal Democrat |
Mark Wheaver |
883 |
25.3 |
-6.5 |
|
Green |
John Hughes |
342 |
9.8 |
+3.4 |
|
Labour |
Michael Szymanski |
308 |
8.8 |
+1.7 |
| Majority |
1,071 |
30.7 |
+7.7 |
| Turnout |
3,487 |
|
|
| Parks[3] |
| Party |
Candidate |
Votes |
% |
±% |
|
Labour |
Stephen Allsopp |
686 |
43.7 |
-10.0 |
|
Conservative |
Natasha Young |
371 |
23.6 |
-0.7 |
|
Liberal Democrat |
Helen Thompson |
340 |
21.6 |
-0.4 |
|
Green |
Melvin Collins |
174 |
11.1 |
+11.1 |
| Majority |
315 |
20.1 |
-9.4 |
| Turnout |
1,571 |
|
|
| Ridgeway[3] |
| Party |
Candidate |
Votes |
% |
±% |
|
Conservative |
Andrew Bennett |
600 |
54.7 |
|
|
Liberal Democrat |
Adelaide Dudman |
393 |
35.9 |
|
|
Labour |
Ruairi Tobin |
103 |
9.4 |
|
| Majority |
207 |
18.9 |
|
| Turnout |
1,096 |
|
|
| Shaw and Nine Elms[3] |
| Party |
Candidate |
Votes |
% |
±% |
|
Conservative |
Nicholas Martin |
1,213 |
54.9 |
+5.7 |
|
Labour |
Neil Heavens |
353 |
16.0 |
-8.9 |
|
Liberal Democrat |
Amber Johnson |
307 |
13.9 |
-12.0 |
|
Green |
Linda Lee |
170 |
7.7 |
+7.7 |
|
Independent |
James Withey |
166 |
7.5 |
+7.5 |
| Majority |
860 |
38.9 |
+15.7 |
| Turnout |
2,209 |
|
|
| St Margaret[3] |
| Party |
Candidate |
Votes |
% |
±% |
|
Conservative |
Raymond Fisher |
1,302 |
54.4 |
+0.0 |
|
Labour |
Michael Spry |
647 |
27.0 |
-2.0 |
|
Liberal Democrat |
David Payne |
445 |
18.6 |
+1.9 |
| Majority |
655 |
27.4 |
+2.0 |
| Turnout |
2,394 |
|
|
| St Philip[3] |
| Party |
Candidate |
Votes |
% |
±% |
|
Conservative |
Philip Sharp |
1,182 |
43.9 |
-1.7 |
|
Labour |
Teresa Page |
1,091 |
40.6 |
+2.4 |
|
Liberal Democrat |
Jose Tocha |
240 |
8.9 |
-7.3 |
|
Green |
Raymond Smith |
177 |
6.6 |
+6.6 |
| Majority |
91 |
3.4 |
-4.1 |
| Turnout |
2,690 |
|
|
| Toothill and Westlea[3] |
| Party |
Candidate |
Votes |
% |
±% |
|
Conservative |
Dwynwen Martin |
841 |
48.2 |
-2.2 |
|
Labour |
Norman Butler |
443 |
25.4 |
-3.5 |
|
Liberal Democrat |
Judith Peppitt |
259 |
14.9 |
-5.8 |
|
Green |
Marilyn Harrison |
201 |
11.5 |
+11.5 |
| Majority |
398 |
22.8 |
+1.2 |
| Turnout |
1,744 |
|
|
| Walcot[3] |
| Party |
Candidate |
Votes |
% |
±% |
|
Labour |
Mavis Childs |
745 |
41.8 |
+6.4 |
|
Conservative |
Russell Holland |
601 |
33.7 |
-7.2 |
|
Liberal Democrat |
David Pajak |
307 |
17.2 |
-6.5 |
|
Green |
Simon Smith |
128 |
7.2 |
+7.2 |
| Majority |
144 |
8.1 |
|
| Turnout |
1,781 |
|
|
| Western[3] |
| Party |
Candidate |
Votes |
% |
±% |
|
Labour |
Michael Barnes |
928 |
38.4 |
-4.9 |
|
Conservative |
Mark Edwards |
805 |
33.3 |
+7.3 |
|
UKIP |
Michael Morton |
311 |
12.9 |
+4.5 |
|
Liberal Democrat |
Rebecca Poole |
251 |
10.4 |
-11.9 |
|
Green |
Raymond Burcham |
121 |
5.0 |
+5.0 |
| Majority |
123 |
5.1 |
-12.2 |
| Turnout |
2416 |
|
|
| Wroughton and Chiseldon[3] |
| Party |
Candidate |
Votes |
% |
±% |
|
Conservative |
Brian Ford |
1,539 |
55.9 |
+9.7 |
|
Liberal Democrat |
Victor Godman |
621 |
22.5 |
-11.7 |
|
Labour |
Sandra Parsons |
412 |
15.0 |
-4.6 |
|
Green |
Robert Heritage |
182 |
6.6 |
+6.6 |
| Majority |
918 |
33.3 |
+21.3 |
| Turnout |
2,754 |
|
|
References