Swindon Borough Council election, 2002
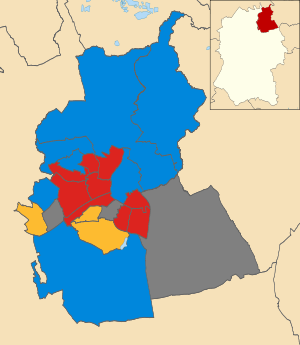
Map of the results of the 2002 Swindon council election.
Labour in red,
Conservatives in blue and Liberal Democrats in yellow. Wards in grey were not contested in 2002.
The 2002 Swindon Borough Council election took place on 2 May 2002 to elect members of Swindon Unitary Council in Wiltshire, England. One third of the council was up for election and the council stayed under no overall control.[1]
After the election, the composition of the council was
Voting pilot
The election in Swindon was one of thirty that trialed different methods of voting or counting in the 2002 local elections, with Swindon having a trial of voting via the internet.[3] The trial results had 5% of voters using the phone to cast a vote and over 10% voting via the internet.[4] A survery in Swindon found that those who voted via the internet were more likely to be younger and male than those who voted at a polling station.[5] Overall turnout in the election was 31.33%.[6]
Election result
| Swindon Local Election Result 2002[6][7] |
| Party |
Seats |
Gains |
Losses |
Net gain/loss |
Seats % |
Votes % |
Votes |
+/− |
| |
Labour |
9 |
1 |
1 |
0 |
47.4 |
34.2 |
13,539 |
|
| |
Conservative |
7 |
1 |
1 |
0 |
36.8 |
38.6 |
15,250 |
|
| |
Liberal Democrat |
3 |
0 |
0 |
0 |
15.8 |
24.3 |
9,609 |
|
| |
Green |
0 |
0 |
0 |
0 |
0 |
1.8 |
703 |
|
| |
Socialist Alliance |
0 |
0 |
0 |
0 |
0 |
0.4 |
170 |
|
| |
Rock 'n' Roll Loony |
0 |
0 |
0 |
0 |
0 |
0.3 |
138 |
|
| |
Independent |
0 |
0 |
0 |
0 |
0 |
0.3 |
128 |
|
Ward results
| Covingham and Nythe[6] |
| Party |
Candidate |
Votes |
% |
±% |
|
Labour |
Maureen Dilley |
1,188 |
47.8 |
|
|
Conservative |
Angela Watts |
984 |
39.6 |
|
|
Liberal Democrat |
Adelaide Dudman |
313 |
12.6 |
|
| Majority |
204 |
8.2 |
|
| Turnout |
2,485 |
35.7 |
|
|
Labour hold |
Swing |
|
|
| Eastcott[6] |
| Party |
Candidate |
Votes |
% |
±% |
|
Liberal Democrat |
Michael Evemy |
1,030 |
47.8 |
|
|
Labour |
Richard Young |
571 |
26.5 |
|
|
Conservative |
Russell Holland |
352 |
16.3 |
|
|
Green |
Christine Smith |
155 |
7.2 |
|
|
Rock 'n' Roll Loony |
Roland Gillard |
46 |
2.1 |
|
| Majority |
459 |
21.3 |
|
| Turnout |
2,154 |
28.1 |
|
|
Liberal Democrat hold |
Swing |
|
|
| Freshbrook and Grange Park[6] |
| Party |
Candidate |
Votes |
% |
±% |
|
Liberal Democrat |
Christopher Shepherd |
879 |
40.9 |
|
|
Conservative |
Michael Bray |
746 |
34.7 |
|
|
Labour |
Phil Rashid |
526 |
24.5 |
|
| Majority |
133 |
6.2 |
|
| Turnout |
2,151 |
28.1 |
|
|
Liberal Democrat hold |
Swing |
|
|
| Moredon[6] |
| Party |
Candidate |
Votes |
% |
±% |
|
Labour |
Derique Montaut |
843 |
46.4 |
|
|
Conservative |
Kirt Wakefield |
646 |
35.5 |
|
|
Liberal Democrat |
Nigel Bass |
329 |
18.1 |
|
| Majority |
197 |
10.8 |
|
| Turnout |
1,818 |
24.7 |
|
|
Labour hold |
Swing |
|
|
| Old Town and Lawn[6] |
| Party |
Candidate |
Votes |
% |
±% |
|
Liberal Democrat |
Wendy Johnson |
1,933 |
48.9 |
|
|
Conservative |
Colin Lovell |
1,603 |
40.5 |
|
|
Labour |
John Newman |
273 |
6.9 |
|
|
Green |
John Hughes |
147 |
3.7 |
|
| Majority |
330 |
8.3 |
|
| Turnout |
3,956 |
52.7 |
|
|
Liberal Democrat hold |
Swing |
|
|
| Parks[6] |
| Party |
Candidate |
Votes |
% |
±% |
|
Labour |
Barrie Thompson |
973 |
64.4 |
|
|
Conservative |
Natasha Young |
293 |
19.4 |
|
|
Liberal Democrat |
Ellen Aylett |
245 |
16.2 |
|
| Majority |
680 |
45.0 |
|
| Turnout |
1,511 |
21.8 |
|
|
Labour hold |
Swing |
|
|
| Penhill[6] |
| Party |
Candidate |
Votes |
% |
±% |
|
Labour |
David Glaholm |
687 |
59.5 |
|
|
Liberal Democrat |
Clive Fitchett |
253 |
21.9 |
|
|
Conservative |
Donald Day |
215 |
18.6 |
|
| Majority |
434 |
37.6 |
|
| Turnout |
1,155 |
25.7 |
|
|
Labour hold |
Swing |
|
|
| St Philip[6] |
| Party |
Candidate |
Votes |
% |
±% |
|
Labour |
Philip Steele |
1,006 |
45.4 |
|
|
Conservative |
Raymond Fisher |
882 |
39.8 |
|
|
Liberal Democrat |
Martin Wiltshire |
214 |
9.7 |
|
|
Green |
Raymond Smith |
113 |
5.1 |
|
| Majority |
124 |
5.6 |
|
| Turnout |
2,215 |
31.2 |
|
|
Labour hold |
Swing |
|
|
| Western[6] |
| Party |
Candidate |
Votes |
% |
±% |
|
Labour |
Kevin Small |
1,068 |
50.2 |
|
|
Conservative |
Paul Saunders |
535 |
25.2 |
|
|
Liberal Democrat |
Elizabeth Clifton-Page |
301 |
14.2 |
|
|
Independent |
Michael Morton |
128 |
6.0 |
|
|
Green |
Robert Heritage |
94 |
4.4 |
|
| Majority |
533 |
25.1 |
|
| Turnout |
2,126 |
28.5 |
|
|
Labour hold |
Swing |
|
|
References