Swansea West (Assembly constituency)
| Welsh Assembly borough constituency | |
|---|---|
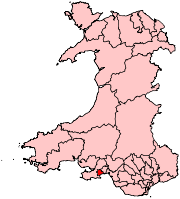 | |
| Swansea West shown as one of the 40 Welsh Assembly constituencies | |
| Created: | 1999 |
| Electoral region: | South Wales West |
| AM: | Julie James |
| Party: | Labour |
| Preserved county: | West Glamorgan |
Swansea West is a constituency of the National Assembly for Wales. It elects one Assembly Member by the first past the post method of election. Also, however, it is one of seven constituencies in the South Wales West electoral region, which elects four additional members, in addition to seven constituency members, to produce a degree of proportional representation for the region as a whole.
Boundaries
The constituency was created for the first election to the Assembly, in 1999, with the name and boundaries of the Swansea West Westminster constituency. It is entirely within the preserved county of West Glamorgan.
The other six constituencies of the region are Aberavon, Bridgend, Gower, Neath, Ogmore and Swansea East.
Voting
In general elections for the National Assembly for Wales, each voter has two votes. The first vote may be used to vote for a candidate to become the Assembly Member for the voter's constituency, elected by the first past the post system. The second vote may be used to vote for a regional closed party list of candidates. Additional member seats are allocated from the lists by the d'Hondt method, with constituency results being taken into account in the allocation.
Election results
| Election | Political result | Candidate | Party | Votes | % | ±% | ||
|---|---|---|---|---|---|---|---|---|
| Assembly Election 2011 Electorate: 62,345 Turnout: 21,805 (35.1%) −2.1 | Labour hold Majority: 4,654 (21.3%) +17.7 Swing: 4.1% from Conservative to Labour | Julie James | Labour | 9,885 | 45.3 | +13.0 | ||
| Steve Jenkins | Conservative | 5,231 | 24.0 | +4.8 | ||||
| Rob Speht | Liberal Democrats | 3,654 | 16.8 | −9.0 | ||||
| Carl Harris | Plaid Cymru | 3,035 | 13.9 | −1.7 | ||||
| Assembly Election 2007 Electorate: 61,469 Turnout: 22,879 (37.2%) +4.2 | Labour hold Majority: 1,511 (6.6%) −6.6 Swing: 3.5% from Labour to Conservative | Andrew Davies | Labour | 7,393 | 32.3 | −3.9 | ||
| Peter May | Liberal Democrats | 5,882 | 25.7 | +7.6 | ||||
| Harri James Lloyd Davies | Conservative | 4,379 | 19.1 | +3.1 | ||||
| Ian Richard Titherington | Plaid Cymru | 3,583 | 15.7 | −7.3 | ||||
| Richard David Lewis | UKIP | 1,642 | 7.2 | N/A | ||||
| Assembly Election 2003 Electorate: 58,749 Turnout: 19,412 (33.0%) −7.0 | Labour hold Majority: 2,562 (13.2%) +5.1 Swing: 0.5%% from Conservative to Labour | Andrew Davies | Labour | 7,023 | 36.2 | +1.5 | ||
| Dr Dai Lloyd | Plaid Cymru | 4,461 | 23.0 | −3.5 | ||||
| Mike Day | Liberal Democrats | 3,510 | 18.1 | +3.1 | ||||
| Gerald Rowbottom | Conservative | 3,106 | 16.0 | +0.6 | ||||
| David C. Evans | UKIP | 1,040 | 5.3 | +1.2 | ||||
| Leigh Richards | Socialist Alliance | 272 | 1.4 | +0.3 | ||||
| Assembly Election 1999 Electorate: 59,369 Turnout: 23,727 (40.0%) N/A | Labour win Majority: 1,926 (8.1%) | Andrew Davies | Labour | 8,217 | 34.6 | N/A | ||
| Dr Dai Lloyd | Plaid Cymru | 6,291 | 26.5 | N/A | ||||
| Paul H. Valerio | Conservative | 3,643 | 15.4 | N/A | ||||
| John Newbury | Liberal Democrats | 3,543 | 14.9 | N/A | ||||
| David C. Evans | Independent | 996 | 4.2 | N/A | ||||
| John R. Harris | People's Representative | 774 | 3.3 | N/A | ||||
| Alec Thraves | Socialist Alliance | 263 | 1.1 | N/A | ||||
| ||||||||||||||||||||||