Swale Borough Council election, 2007
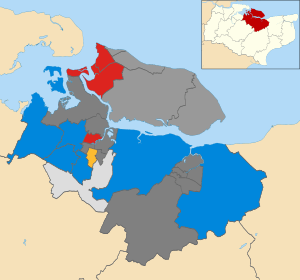
Map of the results of the 2007 Swale Borough Council election.
Conservatives in blue, Sheppey First in grey,
Labour in red,
Liberal Democrats in yellow and independent in light grey.
Wards in dark grey were not contested in 2007.
The 2007 Swale Borough Council election took place on 3 May 2007 to elect members of Swale Borough Council in Kent, England. One third of the council was up for election and the Conservative party stayed in overall control of the council.[1]
After the election, the composition of the council was
Election result
The new Sheppey First party won four of the six seats they contested, taking Leysdown and Warden, Minster Cliffs, Sheppey Central and Sheerness East wards.[2] However the Conservatives remained in control of the council with 26 of the 47 councillors, despite also losing a seat in Queenborough and Halfway to Labour.[2] This gain meant Labour remained on 10 seats, while the Liberal Democrats lost 2 seats to have 6 councillors and 1 independent candidate was elected.[2][3][4]
| Swale local election result 2007[3][4] |
| Party |
Seats |
Gains |
Losses |
Net gain/loss |
Seats % |
Votes % |
Votes |
+/− |
| |
Conservative |
6 |
2 |
4 |
-2 |
40.0 |
41.0 |
8,421 |
-4.1% |
| |
Sheppey First |
4 |
3 |
0 |
+3 |
26.7 |
18.2 |
3,741 |
+18.2% |
| |
Labour |
3 |
1 |
1 |
0 |
20.0 |
22.8 |
4,673 |
-4.8% |
| |
Liberal Democrat |
1 |
0 |
2 |
-2 |
6.7 |
12.9 |
2,637 |
-7.1% |
| |
Independent |
1 |
1 |
0 |
+1 |
6.7 |
2.8 |
566 |
+2.8% |
| |
Green |
0 |
0 |
0 |
0 |
0 |
1.1 |
225 |
+1.1% |
| |
Against Kent Science Park's Residential Expansion |
0 |
0 |
0 |
0 |
0 |
0.6 |
124 |
+0.6% |
| |
Rock 'n' Roll Loony |
0 |
0 |
0 |
0 |
0 |
0.5 |
94 |
0.5% |
| |
Money Reform Party |
0 |
0 |
0 |
0 |
0 |
0.2 |
38 |
+0.1% |
Ward results
| Boughton and Courtenay[4] |
| Party |
Candidate |
Votes |
% |
±% |
|
Conservative |
George Bobbin |
1,023 |
66.7 |
-0.3 |
|
Labour |
Ash Rehal |
247 |
16.1 |
+0.6 |
|
Green |
Timothy Valentine |
225 |
14.7 |
+14.7 |
|
Money Reform Party |
Anne Belsey |
38 |
2.5 |
+2.5 |
| Majority |
776 |
50.6 |
+1.0 |
| Turnout |
1,533 |
36.1 |
-6.9 |
|
Conservative hold |
Swing |
|
|
| Leysdown and Warden[4] |
| Party |
Candidate |
Votes |
% |
±% |
|
Sheppey First |
Pat Sandle |
434 |
59.0 |
+59.0 |
|
Conservative |
Andy Booth |
213 |
28.9 |
-29.7 |
|
Labour |
Matt Wheatcroft |
89 |
12.1 |
-13.2 |
| Majority |
221 |
30.0 |
|
| Turnout |
736 |
33.3 |
+7.1 |
|
Sheppey First hold |
Swing |
|
|
| Queenborough and Halfway[4] |
| Party |
Candidate |
Votes |
% |
±% |
|
Labour |
Mike Constable |
780 |
40.6 |
-2.3 |
|
Conservative |
Peter Marchington |
635 |
33.0 |
-10.8 |
|
Sheppey First |
Raymond Adams |
507 |
26.4 |
+26.4 |
| Majority |
145 |
7.5 |
|
| Turnout |
1,922 |
34.7 |
-1.3 |
|
Labour gain from Conservative |
Swing |
|
|
| Sheerness East[4] |
| Party |
Candidate |
Votes |
% |
±% |
|
Sheppey First |
Gemma Wray |
332 |
35.1 |
+35.1 |
|
Labour |
Jennie Ronan |
301 |
31.8 |
-5.0 |
|
Conservative |
Kelly Carruthers |
210 |
22.2 |
-9.3 |
|
Liberal Democrat |
Malcolm Howe |
103 |
10.9 |
-10.1 |
| Majority |
31 |
3.3 |
|
| Turnout |
946 |
26.9 |
-0.4 |
|
Sheppey First gain from Labour |
Swing |
|
|
| Sheerness West[4] |
| Party |
Candidate |
Votes |
% |
±% |
|
Labour |
Steve Worrall |
603 |
49.5 |
-9.6 |
|
Sheppey First |
David Cassidy |
408 |
33.5 |
+33.5 |
|
Conservative |
Jane Morris |
207 |
17.0 |
-7.7 |
| Majority |
195 |
16.0 |
-18.4 |
| Turnout |
1,218 |
30.2 |
+1.4 |
|
Labour hold |
Swing |
|
|
| West Downs[4] |
| Party |
Candidate |
Votes |
% |
±% |
|
Independent |
Monique Bonney |
501 |
57.7 |
+57.7 |
|
Conservative |
Donald Jordan |
368 |
42.3 |
-33.8 |
| Majority |
133 |
15.3 |
|
| Turnout |
869 |
44.0 |
+6.2 |
|
Independent gain from Conservative |
Swing |
|
|
| Woodstock[4] |
| Party |
Candidate |
Votes |
% |
±% |
|
Conservative |
Jean Willicombe |
1,011 |
55.6 |
+9.4 |
|
Labour |
Christine Truelove |
366 |
20.1 |
+5.6 |
|
Liberal Democrat |
Anne Jenkins |
316 |
17.4 |
-17.1 |
|
Against Kent Science Park's Residential Expansion |
Joe Brown |
124 |
6.8 |
+6.8 |
| Majority |
645 |
35.5 |
+23.8 |
| Turnout |
1,817 |
44.8 |
-6.9 |
|
Conservative hold |
Swing |
|
|
References