Sunderland City Council election, 2011
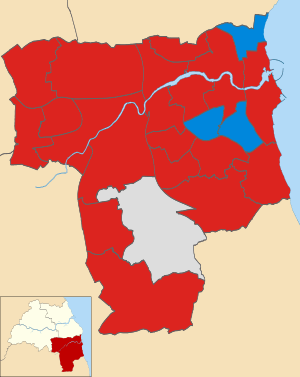
Map of the results of the 2011 Sunderland council election.
Labour in red,
Conservatives in blue and independent in grey.
The 2011 Sunderland Council election took place on 5 May 2011 to elect members of Sunderland Metropolitan Borough Council in Tyne and Wear, England. One third of the council was up for election and the Labour party stayed in overall control of the council.[1]
After the election, the composition of the council was
Campaign
Before the election Labour ran the council with 52 seats, compared to 18 Conservatives, 1 Liberal Democrat and 4 independents, with 1 of the 4 independents being described as an "Independent Conservative".[3] 26 seats were being contested in the election with 2 seats being available in Sandhill ward, after councillor Jim Scott stood down from the council.[3]
Labour were hopeful of making gains due to a backlash against the national Conservative led government and rising unemployment.[3] However the Conservatives hoped the national council tax freeze and pension increases would help the party do well and blamed the previous Labour government for the economic situation.[3] Meanwhile the Liberal Democrats said they would focus on local issues and targeted Millfield ward.[3]
Other candidates included 7 from the Green Party and 3 from the United Kingdom Independence Party.[3] However the British National Party did not put up any candidates, after contesting every seat in some previous elections.[3]
Election result
The results saw Labour increase their majority on the council after gaining 4 seats from the Conservatives to have 56 councillors.[4][5] The gains came in the wards of St Chad's, St Peter's, Washington East and Washington South and left the Conservatives with 14 seats.[4][5] The Liberal Democrats had a bad election, coming fourth in many seats, after a drop in their share of the vote.[5] Meanwhile independent Colin Wakefield held his seat in Copt Hill by 428 votes over Labour.[5] Neither the Green Party or the United Kingdom Independence Party won any seats, but the Greens came third in 6 of the 7 seats they had contested and the United Kingdom Independence Party came second in Hetton.[6] Overall turnout in the election was 35.1%.[4]
Sunderland kept up its position as a quick counter of results, with the first result in Pallion being declared at 10.53pm, after the polls had closed at 10pm.[5] The council was also the first to finish counting with the final results being declared at 1am.[7] The Labour leader of the council Paul Watson held the seat in Pallion and put Labour's success down to the cuts being made by the national government[5] and as an endorsement of the city council.[6] The Conservative group leader Paul Morrissey meanwhile said his party had suffered due to being in government nationally.[6]
| Sunderland Local Election Result 2011[8] |
| Party |
Seats |
Gains |
Losses |
Net gain/loss |
Seats % |
Votes % |
Votes |
+/− |
| |
Labour |
22 |
4 |
0 |
+4 |
84.6 |
60.3 |
49,898 |
+11.3% |
| |
Conservative |
3 |
0 |
4 |
-4 |
11.5 |
25.7 |
21,303 |
+0.5% |
| |
Independent |
1 |
0 |
0 |
0 |
3.8 |
4.6 |
3,782 |
+0.6% |
| |
Liberal Democrat |
0 |
0 |
0 |
0 |
0 |
5.1 |
4,185 |
-13.2% |
| |
Green |
0 |
0 |
0 |
0 |
0 |
2.4 |
1,979 |
+2.1% |
| |
UKIP |
0 |
0 |
0 |
0 |
0 |
2.0 |
1,654 |
+2.0% |
Ward results
| Barnes[8] |
| Party |
Candidate |
Votes |
% |
±% |
|
Conservative |
Lee Martin |
1,989 |
49.1 |
+13.1 |
|
Labour |
Rebecca Atkinson |
1,896 |
46.8 |
+5.6 |
|
Liberal Democrat |
Anthony Usher |
170 |
4.2 |
-13.9 |
| Majority |
93 |
2.3 |
|
| Turnout |
4,055 |
45.7 |
-16.9 |
|
Conservative hold |
Swing |
|
|
| Castle[8] |
| Party |
Candidate |
Votes |
% |
±% |
|
Labour |
Stephen Foster |
2,202 |
84.6 |
+33.3 |
|
Conservative |
Geoff Scott |
294 |
11.3 |
+0.7 |
|
Liberal Democrat |
Paul Hillman |
108 |
4.1 |
-7.8 |
| Majority |
1,908 |
73.3 |
+40.3 |
| Turnout |
2,604 |
30.4 |
-19.6 |
|
Labour hold |
Swing |
|
|
| Copt Hill[8] |
| Party |
Candidate |
Votes |
% |
±% |
|
Independent |
Colin Wakefield |
1,961 |
56.1 |
+14.3 |
|
Labour |
Juliana Heron |
1,533 |
43.9 |
-1.1 |
| Majority |
428 |
12.2 |
|
| Turnout |
3,494 |
39.6 |
-15.6 |
|
Independent hold |
Swing |
|
|
| Doxford[8] |
| Party |
Candidate |
Votes |
% |
±% |
|
Labour |
David Errington |
1,906 |
59.7 |
+7.7 |
|
Conservative |
Hilary Johnson |
946 |
29.6 |
-0.2 |
|
Green |
Caroline Robinson |
296 |
9.3 |
+9.3 |
|
Liberal Democrat |
Matt MacDonald |
46 |
1.4 |
-16.9 |
| Majority |
960 |
30.1 |
+7.9 |
| Turnout |
3,194 |
40.5 |
-20.2 |
|
Labour hold |
Swing |
|
|
| Fulwell[8] |
| Party |
Candidate |
Votes |
% |
±% |
|
Conservative |
John Wiper |
1,992 |
47.3 |
+2.1 |
|
Labour |
Paul Middleton |
1,799 |
42.7 |
+7.0 |
|
Liberal Democrat |
Geoffrey Pryke |
423 |
10.0 |
-9.2 |
| Majority |
193 |
4.6 |
-4.9 |
| Turnout |
4,214 |
46.5 |
-21.9 |
|
Conservative hold |
Swing |
|
|
| Hetton[8] |
| Party |
Candidate |
Votes |
% |
±% |
|
Labour |
Florence Anderson |
1,940 |
58.8 |
+2.7 |
|
UKIP |
John Defty |
956 |
29.0 |
+29.0 |
|
Conservative |
Pat Francis |
239 |
7.2 |
-5.9 |
|
Liberal Democrat |
Philip Dowell |
167 |
5.1 |
-16.9 |
| Majority |
984 |
29.8 |
-4.3 |
| Turnout |
3,302 |
37.6 |
-12.8 |
|
Labour hold |
Swing |
|
|
| Houghton[8] |
| Party |
Candidate |
Votes |
% |
±% |
|
Labour |
Kath Rolph |
1,820 |
52.3 |
+5.2 |
|
Independent |
John Ellis |
1,660 |
47.7 |
+11.8 |
| Majority |
160 |
4.6 |
-6.7 |
| Turnout |
3,480 |
38.6 |
-16.1 |
|
Labour hold |
Swing |
|
|
| Millfield[8] |
| Party |
Candidate |
Votes |
% |
±% |
|
Labour |
Lynda Scanlan |
1,363 |
53.8 |
+15.2 |
|
Liberal Democrat |
Paul Edgeworth |
585 |
23.1 |
-12.0 |
|
Conservative |
Vijaya Das |
289 |
11.4 |
-5.0 |
|
Independent |
Rod MacPherson |
161 |
6.4 |
+2.6 |
|
Green |
Jack McGlen |
134 |
5.3 |
+5.3 |
| Majority |
778 |
30.7 |
+27.2 |
| Turnout |
2,532 |
33.1 |
-14.9 |
|
Labour hold |
Swing |
|
|
| Pallion[8] |
| Party |
Candidate |
Votes |
% |
±% |
|
Labour |
Paul Watson |
1,688 |
63.8 |
+12.4 |
|
Conservative |
Peter O'Connor |
506 |
19.1 |
-1.2 |
|
Green |
David Campbell |
451 |
17.1 |
+17.1 |
| Majority |
1,182 |
44.7 |
+13.7 |
| Turnout |
2,645 |
35.1 |
-13.6 |
|
Labour hold |
Swing |
|
|
| St Annes[8] |
| Party |
Candidate |
Votes |
% |
±% |
|
Labour |
Lisa Smiles |
1,908 |
71.4 |
+12.6 |
|
Conservative |
Paula Wilkinson |
436 |
16.3 |
-0.7 |
|
Green |
Emily Blyth |
238 |
8.9 |
+5.0 |
|
Liberal Democrat |
Kathy Walker |
90 |
3.4 |
-16.9 |
| Majority |
1,472 |
55.1 |
+16.6 |
| Turnout |
2,672 |
31.2 |
-15.1 |
|
Labour hold |
Swing |
|
|
| St Michaels[8] |
| Party |
Candidate |
Votes |
% |
±% |
|
Conservative |
Peter Wood |
1,962 |
50.8 |
+8.4 |
|
Labour |
David Owens |
1,364 |
35.3 |
+3.0 |
|
Green |
John Appleton |
285 |
7.4 |
+4.2 |
|
Liberal Democrat |
Andrew Wood |
248 |
6.4 |
-12.0 |
| Majority |
598 |
15.5 |
+5.4 |
| Turnout |
3,859 |
42.8 |
-21.4 |
|
Conservative hold |
Swing |
|
|
| Shiney Row[8] |
| Party |
Candidate |
Votes |
% |
±% |
|
Labour |
John Scott |
2,423 |
64.9 |
+10.6 |
|
Conservative |
Malcolm Vardy |
1,035 |
27.7 |
+1.8 |
|
Liberal Democrat |
Carol Attewell |
278 |
7.4 |
-12.4 |
| Majority |
1,388 |
37.2 |
+8.8 |
| Turnout |
3,736 |
37.5 |
-18.6 |
|
Labour hold |
Swing |
|
|
| Silksworth[8] |
| Party |
Candidate |
Votes |
% |
±% |
|
Labour |
Peter Gibson |
2,227 |
66.7 |
+9.0 |
|
Conservative |
Dominic McDonough |
709 |
21.2 |
-2.5 |
|
Green |
Joella Lynch |
274 |
8.2 |
+8.2 |
|
Liberal Democrat |
Andy Bex |
130 |
3.9 |
-14.7 |
| Majority |
1,518 |
45.4 |
+11.4 |
| Turnout |
3,340 |
39.6 |
-17.1 |
|
Labour hold |
Swing |
|
|
| Southwick[8] |
| Party |
Candidate |
Votes |
% |
±% |
|
Labour |
Christine Shattock |
1,930 |
69.7 |
+15.6 |
|
Conservative |
Terence Docherty |
691 |
24.9 |
+3.3 |
|
Liberal Democrat |
Anne Griffin |
149 |
5.4 |
-10.1 |
| Majority |
1,239 |
44.7 |
+12.3 |
| Turnout |
2,770 |
33.8 |
-14.9 |
|
Labour hold |
Swing |
|
|
| Washington Central[8] |
| Party |
Candidate |
Votes |
% |
±% |
|
Labour |
Len Lauchlan |
2,240 |
61.9 |
+8.8 |
|
Conservative |
Tracy Young |
706 |
19.5 |
-4.3 |
|
UKIP |
Erland Polden |
443 |
12.2 |
+12.2 |
|
Liberal Democrat |
John McLelland |
230 |
6.4 |
-16.7 |
| Majority |
1,534 |
42.4 |
+13.1 |
| Turnout |
3,619 |
40.5 |
-19.7 |
|
Labour hold |
Swing |
|
|
| Washington East[8] |
| Party |
Candidate |
Votes |
% |
±% |
|
Labour |
Fiona Miller |
1,935 |
53.9 |
+8.9 |
|
Conservative |
Ian Cuthbert |
1,201 |
33.4 |
+1.6 |
|
UKIP |
Linda Hudson |
255 |
7.1 |
+7.1 |
|
Liberal Democrat |
Malcolm Bannister |
201 |
5.6 |
-13.1 |
| Majority |
734 |
20.4 |
+7.2 |
| Turnout |
3,592 |
40.9 |
-19.8 |
|
Labour gain from Conservative |
Swing |
|
|
| Washington North[8] |
| Party |
Candidate |
Votes |
% |
±% |
|
Labour |
Peter Walker |
2,253 |
76.3 |
+19.1 |
|
Conservative |
Joyce Wake |
469 |
15.9 |
+1.8 |
|
Liberal Democrat |
Kevin Morris |
232 |
7.9 |
-11.8 |
| Majority |
1,784 |
60.4 |
+22.9 |
| Turnout |
2,954 |
34.0 |
-17.2 |
|
Labour hold |
Swing |
|
|
| Washington South[8] |
| Party |
Candidate |
Votes |
% |
±% |
|
Labour |
George Thompson |
2,126 |
60.5 |
+19.1 |
|
Conservative |
Martin Talbot |
1,102 |
31.3 |
-0.5 |
|
Liberal Democrat |
David Griffin |
288 |
8.2 |
-18.6 |
| Majority |
1,024 |
29.1 |
+19.5 |
| Turnout |
3,516 |
43.0 |
-17.7 |
|
Labour gain from Conservative |
Swing |
|
|
| Washington West[8] |
| Party |
Candidate |
Votes |
% |
±% |
|
Labour |
Harry Trueman |
2,412 |
69.7 |
+20.3 |
|
Conservative |
Olwyn Bird |
710 |
20.5 |
+1.0 |
|
Liberal Democrat |
Irene Bannister |
340 |
9.8 |
-15.2 |
| Majority |
1,702 |
49.2 |
+24.9 |
| Turnout |
3,462 |
38.3 |
-20.1 |
|
Labour hold |
Swing |
|
|
References
Preceded by
Sunderland Council election, 2010 |
Sunderland local elections |
Succeeded by
Sunderland Council election, 2012 |
|
|---|
| | Metropolitan boroughs |
- Barnsley
- Birmingham
- Bolton
- Bradford
- Bury
- Calderdale
- Coventry
- Doncaster
- Dudley
- Gateshead
- Kirklees
- Knowsley
- Leeds
- Liverpool
- Manchester
- Newcastle upon Tyne
- North Tyneside
- Oldham
- Rochdale
- Rotherham
- Salford
- Sandwell
- Sefton
- Sheffield
- Solihull
- South Tyneside
- St Helens
- Stockport
- Sunderland
- Tameside
- Trafford
- Wakefield
- Walsall
- Wigan
- Wirral
- Wolverhampton
|
|---|
| | Unitary authorities | |
|---|
| | District councils (England) | |
|---|
| | District councils (Northern Ireland) |
- Antrim
- Ards
- Armagh
- Ballymena
- Ballymoney
- Banbridge
- Belfast
- Carrickfergus
- Castlereagh
- Coleraine
- Cookstown
- Craigavon
- Derry
- Down
- Dungannon and South Tyrone
- Fermanagh
- Larne
- Limavady
- Lisburn
- Magherafelt
- Moyle
- Newry and Mourne
- Newtownabbey
- North Down
- Omagh
- Strabane
|
|---|
| | Mayoral elections | |
|---|
| | National Assembly elections | |
|---|
| | Referendums | |
|---|
|