Stratford-on-Avon District Council election, 2010
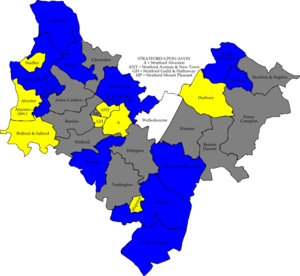
Map of the results of the 2010 Stratford-on-Avon council election.
Conservatives in blue, Liberal Democrats in yellow and independent in white. Wards in grey were not contested in 2010.
The 2010 Stratford-on-Avon District Council election took place on 6 May 2010 to elect members of Stratford-on-Avon District Council in Warwickshire, England. One third of the council was up for election and the Conservative party stayed in overall control of the council.[1]
After the election, the composition of the council was
Background
Before the election the Conservatives controlled the council with 29 seats, compared to 19 Liberal Democrats and 3 independents, with a further 2 seats being vacant.[3] 20 seats were contested in the election by a total of 58 candidates.[3]
Election result
The results saw the Conservatives hold control of the council after winning 11 of the 20 seats contested, compared to 8 seats for the Liberal Democrats and 1 independent.[4] The Conservatives gained a seat in Kinwarton from the Liberal Democrats, but lost another seat back to the Liberal Democrats in Stratford Alveston to leave the political balance unchanged.[4]
| Stratford-on-Avon Local Election Result 2010[5][2] |
| Party |
Seats |
Gains |
Losses |
Net gain/loss |
Seats % |
Votes % |
Votes |
+/− |
| |
Conservative |
11 |
1 |
1 |
0 |
55.0 |
47.8 |
24,712 |
-3.2% |
| |
Liberal Democrat |
8 |
1 |
1 |
0 |
40.0 |
36.6 |
18,891 |
-3.3% |
| |
Independent |
1 |
0 |
0 |
0 |
5.0 |
7.6 |
3,931 |
+4.2% |
| |
Labour |
0 |
0 |
0 |
0 |
0 |
6.6 |
3,396 |
+2.9% |
| |
Green |
0 |
0 |
0 |
0 |
0 |
1.4 |
715 |
+0.8% |
Ward results
| Alcester[5][4] |
| Party |
Candidate |
Votes |
% |
±% |
|
Liberal Democrat |
Susan Juned |
1,651 |
49.6 |
+8.2 |
|
Conservative |
Yvonne Hine |
1,438 |
43.2 |
-11.9 |
|
Labour |
Barry Doherty |
241 |
7.2 |
+3.7 |
| Majority |
213 |
6.4 |
|
| Turnout |
3,330 |
68.8 |
+24.9 |
|
Liberal Democrat hold |
Swing |
|
|
| Bidford and Salford[5][4] |
| Party |
Candidate |
Votes |
% |
±% |
|
Liberal Democrat |
Daren Pemberton |
1,448 |
38.3 |
-3.0 |
|
Conservative |
Maurice Howse |
1,354 |
35.8 |
+35.8 |
|
Independent |
Michael Atkins |
551 |
14.6 |
-37.4 |
|
Labour |
Matthew Stephens |
316 |
8.4 |
+1.7 |
|
Green |
Karen Varga |
109 |
2.9 |
+2.9 |
| Majority |
94 |
2.5 |
|
| Turnout |
3,778 |
69.5 |
+36.6 |
|
Liberal Democrat hold |
Swing |
|
|
| Harbury[5][4] |
| Party |
Candidate |
Votes |
% |
±% |
|
Liberal Democrat |
Richard Tonge |
1,461 |
52.2 |
+1.9 |
|
Conservative |
Richard Hamburger |
1,340 |
47.8 |
-1.9 |
| Majority |
121 |
4.3 |
+3.7 |
| Turnout |
2,801 |
73.8 |
+28.3 |
|
Liberal Democrat hold |
Swing |
|
|
| Kinwarton[5][4] |
| Party |
Candidate |
Votes |
% |
±% |
|
Conservative |
Michael Gittus |
675 |
52.2 |
+5.5 |
|
Liberal Democrat |
Nina Knapman |
565 |
43.7 |
-9.6 |
|
Labour |
Jeffrey Kenner |
54 |
4.2 |
+4.2 |
| Majority |
110 |
8.5 |
|
| Turnout |
1,294 |
74.8 |
+29.0 |
|
Conservative gain from Liberal Democrat |
Swing |
|
|
| Shipston[5][4] |
| Party |
Candidate |
Votes |
% |
±% |
|
Liberal Democrat |
Philip Vial |
1,376 |
48.0 |
-0.7 |
|
Conservative |
Clive Smithard |
1,108 |
38.6 |
-9.4 |
|
Labour |
Christopher Aston |
315 |
11.0 |
+7.7 |
|
Green |
Robert Ballantyne |
70 |
2.4 |
+2.4 |
| Majority |
268 |
9.3 |
+8.6 |
| Turnout |
2,869 |
71.0 |
+22.4 |
|
Liberal Democrat hold |
Swing |
|
|
| Stratford Alveston[5][4] |
| Party |
Candidate |
Votes |
% |
±% |
|
Liberal Democrat |
Ian Fradgley |
1,938 |
45.2 |
-3.9 |
|
Conservative |
Stuart Beese |
1,682 |
39.2 |
-3.1 |
|
Independent |
Michael Crutchley |
378 |
8.8 |
+8.8 |
|
Labour |
Samuel Hargreaves |
288 |
6.7 |
+6.7 |
| Majority |
256 |
6.0 |
-0.8 |
| Turnout |
4,286 |
74.8 |
+26.5 |
|
Liberal Democrat gain from Conservative |
Swing |
|
|
| Stratford Avenue and New Town[5][4] |
| Party |
Candidate |
Votes |
% |
±% |
|
Liberal Democrat |
Clive Thomas |
1,531 |
39.0 |
-8.6 |
|
Conservative |
Ian Hurst |
1,423 |
36.2 |
-9.8 |
|
Independent |
Juliet Short |
620 |
15.8 |
+15.8 |
|
Labour |
Stephen Troup |
352 |
9.0 |
+2.7 |
| Majority |
108 |
2.8 |
+1.2 |
| Turnout |
3,926 |
65.6 |
+28.1 |
|
Liberal Democrat hold |
Swing |
|
|
| Stratford Guild and Hathaway[5][4] |
| Party |
Candidate |
Votes |
% |
±% |
|
Liberal Democrat |
Jenny Fradgley |
1,876 |
45.0 |
-2.3 |
|
Conservative |
Irving David |
1,473 |
35.3 |
-4.3 |
|
Independent |
William Lowe |
364 |
8.7 |
+8.7 |
|
Labour |
David Talbot |
315 |
7.6 |
+2.0 |
|
Green |
Hugh Chatwin |
144 |
3.5 |
-4.1 |
| Majority |
403 |
9.7 |
+2.0 |
| Turnout |
4,172 |
70.7 |
+28.7 |
|
Liberal Democrat hold |
Swing |
|
|
| Studley[5][4] |
| Party |
Candidate |
Votes |
% |
±% |
|
Liberal Democrat |
Hazel Wright |
1,755 |
55.4 |
-3.6 |
|
Conservative |
William McCarthy |
1,085 |
34.2 |
-1.3 |
|
Labour |
Jacqueline Abbott |
330 |
10.4 |
+5.0 |
| Majority |
670 |
21.1 |
-2.4 |
| Turnout |
3,170 |
69.1 |
+28.5 |
|
Liberal Democrat hold |
Swing |
|
|
| Vale of the Red Horse[5][4] |
| Party |
Candidate |
Votes |
% |
±% |
|
Conservative |
Gillian Roache |
1,048 |
70.7 |
-9.4 |
|
Liberal Democrat |
Kenneth Osborne |
435 |
29.3 |
+9.4 |
| Majority |
613 |
41.3 |
-18.8 |
| Turnout |
1,483 |
77.9 |
+28.3 |
|
Conservative hold |
Swing |
|
|
| Wellesbourne[5][4] |
| Party |
Candidate |
Votes |
% |
±% |
|
Independent |
Roger Wright |
2,018 |
48.7 |
+48.7 |
|
Conservative |
Daniel Kendall |
1,737 |
41.9 |
-8.2 |
|
Green |
Jessica Pinson |
392 |
9.5 |
+9.5 |
| Majority |
281 |
6.8 |
|
| Turnout |
4,147 |
75.4 |
+30.4 |
|
Independent hold |
Swing |
|
|
References