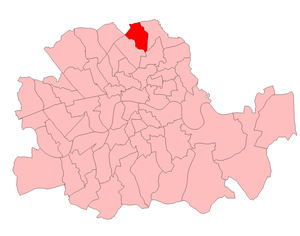
Stoke Newington (UK Parliament constituency)
| Stoke Newington | |
|---|---|
|
Former Borough constituency for the House of Commons | |
| 1918–1950 | |
| Number of members | one |
| Replaced by | Stoke Newington and Hackney North |
| Created from | Hackney North |
Stoke Newington was a borough constituency in the parliamentary county of London from 1918 – 1950. It returned one Member of Parliament to the House of Commons of the Parliament of the United Kingdom.
Boundaries
The constituency was identical in area to the Metropolitan Borough of Stoke Newington.

History
The seat was created under the Representation of the People Act 1918 for the 1918 general election, and abolished under the Representation of the People Act 1948 for the 1950 general election, and largely replaced by the newly created Hackney North & Stoke Newington constituency.
Members of Parliament
| Election | Member | Party | |
|---|---|---|---|
| 1918 | George Jones | Conservative | |
| 1923 | Ernest Spero | Liberal | |
| 1924 | George Jones (knighted in 1928) | Conservative | |
| 1945 | David Weitzman | Labour | |
| 1950 | constituency abolished: see Hackney North & Stoke Newington | ||
Elections
Elections in the 1910s
| General Election 1918: Stoke Newington[1]
Electorate 20,090 | |||||
|---|---|---|---|---|---|
| Party | Candidate | Votes | % | ±% | |
| Unionist | 5,918 | 54.1 | n/a | ||
| Independent | H J Ormond | 2,829 | 25.9 | n/a | |
| Liberal | Percy Holt Heffer | 2,181 | 20.0 | n/a | |
| Majority | 3,089 | 28.2 | n/a | ||
| Turnout | 54.4 | n/a | |||
| Unionist win | |||||
- denotes candidate who was endorsed by the Coalition Government.
Elections in the 1920s
| General Election 1922: Stoke Newington[2] | |||||
|---|---|---|---|---|---|
| Party | Candidate | Votes | % | ±% | |
| Unionist | George William Henry Jones | 9,753 | 63.0 | +8.9 | |
| Liberal | Percy Holt Heffer | 5,737 | 37.0 | +17.0 | |
| Majority | 4,016 | 26.0 | -2.2 | ||
| Turnout | 65.0 | +10.6 | |||
| Unionist hold | Swing | -4.0 | |||

| General Election 1923: Stoke Newington[3] | |||||
|---|---|---|---|---|---|
| Party | Candidate | Votes | % | ±% | |
| Liberal | Dr George Ernest Spero | 8,365 | 53.5 | +16.5 | |
| Unionist | George William Henry Jones | 7,264 | 46.5 | -16.5 | |
| Majority | 1,101 | 7.0 | 33.0 | ||
| Turnout | 63.5 | -1.5 | |||
| Liberal gain from Unionist | Swing | +16.5 | |||
| General Election 1924: Stoke Newington[4] | |||||
|---|---|---|---|---|---|
| Party | Candidate | Votes | % | ±% | |
| Unionist | George William Henry Jones | 10,688 | 56.7 | ||
| Liberal | Dr George Ernest Spero | 4,758 | 25.2 | ||
| Labour | Lewis Silkin | 3,420 | 18.1 | ||
| Majority | 5,930 | 31.5 | |||
| Turnout | 78.0 | ||||
| Unionist gain from Liberal | Swing | ||||
| General Election 1929: Stoke Newington[5] | |||||
|---|---|---|---|---|---|
| Party | Candidate | Votes | % | ±% | |
| Unionist | Sir George William Henry Jones | 9,030 | 38.0 | -18.7 | |
| Liberal | Rev. F. W. Norwood | 7,958 | 33.6 | ||
| Labour | F. L. Kerran | 6,723 | 28.4 | ||
| Majority | 1,072 | 4.4 | |||
| Turnout | 70.0 | -6.0 | |||
| Unionist hold | Swing | ||||
Elections in the 1930s
| General Election 1931: Stoke Newington[6]
Electorate 34,591 | |||||
|---|---|---|---|---|---|
| Party | Candidate | Votes | % | ±% | |
| Conservative | Sir George William Henry Jones | 16,035 | 73.3 | ||
| Labour | F L Kerran | 5,837 | 26.7 | ||
| Majority | |||||
| Turnout | 63.2 | ||||
| Conservative hold | Swing | ||||
| General Election 1935: Stoke Newington[7]
Electorate 34,208 | |||||
|---|---|---|---|---|---|
| Party | Candidate | Votes | % | ±% | |
| Conservative | Sir George William Henry Jones | 11,213 | 53.3 | ||
| Labour | David Weitzman | 7,448 | 35.4 | ||
| Liberal | John Howard Whitehouse | 2,364 | 11.2 | ||
| Majority | 3,765 | 17.9 | |||
| Turnout | 21,025 | 61.5 | |||
| Conservative hold | Swing | ||||
Elections in the 1940s
General Election 1939/40: Another General Election was required to take place before the end of 1940. The political parties had been making preparations for an election to take place from 1939 and by the end of this year, the following candidates had been selected;
- Conservative: Sir George Jones
- Labour: David Weitzman
- Liberal: Cllr Harold Gordon[8]
- British Union: Edward Whinfield
| General Election 1945: Stoke Newington[9]
Electorate 26,987 | |||||
|---|---|---|---|---|---|
| Party | Candidate | Votes | % | ±% | |
| Labour | David Weitzman | 9,356 | 51.5 | ||
| Conservative | Sir George William Henry Jones | 5,155 | 28.4 | ||
| Liberal | Hubert HC Blake | 3,651 | 20.1 | ||
| Majority | 4,201 | 23.1 | |||
| Turnout | 67.3 | ||||
| Labour gain from Conservative | Swing | ||||
References
- ↑ British parliamentary election results, 1918-1949
- ↑ British parliamentary election results, 1918-1949
- ↑ British parliamentary election results, 1918-1949
- ↑ British parliamentary election results, 1918-1949
- ↑ British parliamentary election results, 1918-1949
- ↑ British parliamentary election results, 1918-1949
- ↑ http://www.politicsresources.net
- ↑ The Liberal Magazine, 1939
- ↑ British parliamentary election results, 1918-1949