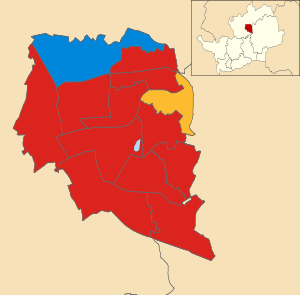
Stevenage Borough Council election, 2012
Elections to Stevenage Borough Council were held on 3 May 2012.
One third of the council were elected.
The composition of the council after the election was:
Election result
| Stevenage Local Election Result 2012 |
| Party |
Seats |
Gains |
Losses |
Net gain/loss |
Seats % |
Votes % |
Votes |
+/− |
| |
Labour |
11 |
3 |
0 |
+3 |
84.6 |
52.6 |
10498 |
+5.8% |
| |
Conservative |
1 |
0 |
3 |
-3 |
7.7 |
28.8 |
5740 |
-2.4% |
| |
Liberal Democrat |
1 |
0 |
0 |
±0 |
7.7 |
11.6 |
2309 |
+1.3% |
| |
UKIP |
0 |
0 |
0 |
±0 |
0 |
2.9 |
587 |
-7.1% |
| |
TUSC |
0 |
0 |
0 |
±0 |
0 |
2.2 |
438 |
+1.0% |
| |
Green |
0 |
0 |
0 |
±0 |
0 |
1.9 |
377 |
+1.5% |
Ward Results
| Bandley Hill |
| Party |
Candidate |
Votes |
% |
±% |
|
Labour |
Michelle Gardner |
814 |
53.8 |
+6.5 |
|
Conservative |
Sharon Hearn |
492 |
32.5 |
-0.5 |
|
Liberal Democrat |
Barbara Segadelli |
105 |
6.9 |
+0.8 |
|
TUSC |
Amanda Dilley |
101 |
6.7 |
+3.6 |
| Majority |
322 |
21.3 |
+7.0 |
| Turnout |
1512 |
30.7 |
-9.2 |
|
Labour hold |
Swing |
|
|
| Bedwell |
| Party |
Candidate |
Votes |
% |
±% |
|
Labour |
David Cullen |
897 |
56.8 |
+0.1 |
|
Conservative |
Ellin Joseph |
258 |
16.3 |
-5.3 |
|
UKIP |
Sean Howlett |
218 |
13.8 |
+0.6 |
|
Green |
Ian Cropton |
88 |
5.6 |
-0.2 |
|
Liberal Democrat |
Debra Betts |
78 |
4.9 |
+4.9 |
|
TUSC |
Steve Glennon |
39 |
2.5 |
-0.2 |
| Majority |
639 |
40.5 |
+5.4 |
| Turnout |
1578 |
31.1 |
-8.7 |
|
Labour hold |
Swing |
|
|
| Chells |
| Party |
Candidate |
Votes |
% |
±% |
|
Labour |
Vickie Warwick |
875 |
56.2 |
+8.2 |
|
Conservative |
Matthew Wyatt |
382 |
24.5 |
-0.6 |
|
Liberal Democrat |
Gareth Steiner |
201 |
12.9 |
-1.6 |
|
TUSC |
Mark Pickersgill |
100 |
6.4 |
+6.4 |
| Majority |
493 |
31.6 |
+8.8 |
| Turnout |
1558 |
31.1 |
-10.8 |
|
Labour hold |
Swing |
|
|
| Longmeadow |
| Party |
Candidate |
Votes |
% |
±% |
|
Labour |
Lorraine Bell |
778 |
47.0 |
+5.1 |
|
Conservative |
Matthew Hurst |
596 |
36.0 |
-0.3 |
|
Liberal Democrat |
Ralph Baskerville |
172 |
10.4 |
+0.6 |
|
TUSC |
Helen Kerr |
109 |
6.6 |
+3.5 |
| Majority |
182 |
11.0 |
+5.4 |
| Turnout |
1655 |
36.4 |
-8.1 |
|
Labour gain from Conservative |
Swing |
|
|
| Manor |
| Party |
Candidate |
Votes |
% |
±% |
|
Liberal Democrat |
Graham Snell |
837 |
45.6 |
+4.3 |
|
Labour |
Amanda King |
566 |
30.8 |
+4.9 |
|
Conservative |
Susan Smith |
432 |
23.5 |
-2.2 |
| Majority |
271 |
14.8 |
-0.6 |
| Turnout |
1835 |
36.6 |
-11.0 |
|
Liberal Democrat hold |
Swing |
|
|
| Martins Wood |
| Party |
Candidate |
Votes |
% |
±% |
|
Labour |
Maureen McKay |
835 |
60.1 |
+12.2 |
|
Conservative |
Dilys Clark |
425 |
30.6 |
-5.0 |
|
Liberal Democrat |
Kevin Aylward |
130 |
9.4 |
+2.6 |
| Majority |
410 |
29.5 |
+17.2 |
| Turnout |
1390 |
29.7 |
-12.1 |
|
Labour gain from Conservative |
Swing |
|
|
| Old Town |
| Party |
Candidate |
Votes |
% |
±% |
|
Labour |
Jim Brown |
1020 |
49.5 |
+1.8 |
|
Conservative |
James Fraser |
783 |
38.0 |
+1.0 |
|
Green |
Elizabeth Sturges |
159 |
7.7 |
+7.7 |
|
Liberal Democrat |
Matthew Snell |
99 |
4.8 |
-2.9 |
| Majority |
237 |
11.5 |
+0.8 |
| Turnout |
2061 |
33.8 |
-9.3 |
|
Labour gain from Conservative |
Swing |
|
|
| Pin Green |
| Party |
Candidate |
Votes |
% |
±% |
|
Labour |
Simon Speller |
861 |
58.1 |
+7.3 |
|
Conservative |
Bill Whelan |
336 |
22.7 |
-9.2 |
|
UKIP |
Michael Kumar |
188 |
12.7 |
+2.1 |
|
Liberal Democrat |
Amanda Piroth |
97 |
6.5 |
-0.2 |
| Majority |
525 |
35.4 |
+16.4 |
| Turnout |
1482 |
31.9 |
-9.3 |
|
Labour hold |
Swing |
|
|
| Roebuck |
| Party |
Candidate |
Votes |
% |
±% |
|
Labour |
John Lloyd |
758 |
52.8 |
+3.9 |
|
Conservative |
Adam Mitchell |
424 |
29.5 |
-3.6 |
|
Green |
Graham White |
130 |
9.1 |
+9.1 |
|
Liberal Democrat |
Denise Baskerville |
83 |
5.8 |
+5.8 |
|
TUSC |
Bryan Clare |
41 |
2.9 |
-0.4 |
| Majority |
334 |
23.2 |
+7.3 |
| Turnout |
1436 |
30.3 |
-9.8 |
|
Labour hold |
Swing |
|
|
| St Nicholas |
| Party |
Candidate |
Votes |
% |
±% |
|
Labour |
Richard Henry |
860 |
62.6 |
+9.8 |
|
Conservative |
Gillian Mould |
352 |
25.6 |
-2.0 |
|
Liberal Democrat |
Heather Snell |
162 |
11.8 |
+1.8 |
| Majority |
508 |
37.0 |
+11.8 |
| Turnout |
1374 |
28.9 |
-11.9 |
|
Labour hold |
Swing |
|
|
| Shephall |
| Party |
Candidate |
Votes |
% |
±% |
|
Labour |
Jack Pickersgill |
760 |
58.7 |
+4.3 |
|
Conservative |
Michelle Calcutt |
215 |
16.6 |
-5.8 |
|
UKIP |
Andrea Taylor |
181 |
14.0 |
+4.5 |
|
Liberal Democrat |
Nicholas Baskerville |
91 |
7.0 |
-2.1 |
|
TUSC |
Barbara Clare |
48 |
3.7 |
-0.9 |
| Majority |
545 |
42.1 |
+10.2 |
| Turnout |
1295 |
28.6 |
-8.4 |
|
Labour hold |
Swing |
|
|
| Symonds Green |
| Party |
Candidate |
Votes |
% |
±% |
|
Labour |
Laurie Chester |
953 |
63.2 |
+4.8 |
|
Conservative |
Paul Mould |
431 |
28.6 |
+0.5 |
|
Liberal Democrat |
Clive Hearmon |
123 |
8.2 |
+2.2 |
| Majority |
522 |
34.6 |
+4.3 |
| Turnout |
1507 |
33.6 |
-9.5 |
|
Labour hold |
Swing |
|
|
| Woodfield |
| Party |
Candidate |
Votes |
% |
±% |
|
Conservative |
Margaret Notley |
614 |
48.5 |
+0.5 |
|
Labour |
Jim Callaghan |
521 |
41.2 |
+8.5 |
|
Liberal Democrat |
Katherine Lloyd-Manning |
131 |
10.3 |
+1.4 |
| Majority |
93 |
7.3 |
-2.3 |
| Turnout |
1266 |
30.3 |
-12.2 |
|
Conservative hold |
Swing |
|
|
References