Stevenage (UK Parliament constituency)
| Stevenage | |
|---|---|
|
County constituency for the House of Commons | |
|
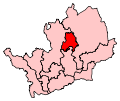
Boundary of Stevenage in Hertfordshire. | |
|
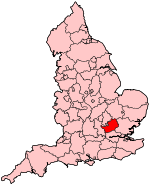
Location of Hertfordshire within England. | |
| County | Hertfordshire |
| Electorate | 69,357 (December 2010)[1] |
| Major settlements | Stevenage |
| Current constituency | |
| Created | 1983 |
| Member of parliament | Stephen McPartland (Conservative) |
| Number of members | One |
| Created from | Hertford & Stevenage, Hitchin, and East Hertfordshire |
| Overlaps | |
| European Parliament constituency | East of England |
Stevenage is a constituency[n 1] represented in the House of Commons of the UK Parliament since 2010 by Stephen McPartland, a Conservative.[n 2]
History
The constituency was created in 1983 from parts of the seats of Hertford and Stevenage, Hitchin, and East Hertfordshire. A Southern England new town seat with volatile voting patterns, it was Conservative held between 1983 and 1997 until Labour easily gained it, but their winning margin in 2005 was small and the Conservatives gained the seat at the 2010 election.
Its main predecessor, named first, was also a bellwether of the national result. Shirley Williams has been the most prominent member, in fact the second frontbencher since 1974. She held it when she was a Secretary of State in government from 1974 until 1979, Secretary of State for Prices and Consumer Protection and then Paymaster General. Barbara Follett achieved two ministerial roles from 2007 until 2010.
Boundaries
The constituency covers the Borough of Stevenage, as well as the villages of Codicote and Knebworth to the south and Aston and Datchworth to the east.[2]
Before the Fifth Periodic Review of Westminster constituencies for the 2010 election, the constituency included Benington and Walkern. These villages are now in North East Hertfordshire.[3]
Constituency profile
The main town is known for its fast rail links to London and proximity to Luton Airport which accompanies a few headquarters of global businesses based in the seat. Workless claimants, registered jobseekers, were in November 2012 higher than the national average of 3.8%, and eastern regional average of 3.2%, at 4.0% of the population based on a statistical compilation by The Guardian.[4]
Members of Parliament
| Election | Member[5] | Party | |
|---|---|---|---|
| 1983 | Timothy Wood | Conservative | |
| 1997 | Barbara Follett | Labour | |
| 2010 | Stephen McPartland | Conservative | |
Elections
Elections in the 2010s
| General Election 2015: Stevenage [6] | |||||
|---|---|---|---|---|---|
| Party | Candidate | Votes | % | ±% | |
| UKIP | David Collins[7] | ||||
| Independent | David Cox[7] | ||||
| English Democrats | Charles Vickers | ||||
| Conservative | Stephen McPartland | ||||
| TUSC | Trevor Palmer [8] | ||||
| Labour | Sharon Taylor | ||||
| Liberal Democrat | Susan Van De Ven[9] | ||||
| Green | Graham White[10] | ||||
UKIP originally selected Christopher Vickers, who stood down after being charged with GBH.[11]
| General Election 2010: Stevenage[12] | |||||
|---|---|---|---|---|---|
| Party | Candidate | Votes | % | ±% | |
| Conservative | Stephen McPartland | 18,491 | 41.4 | +6.0 | |
| Labour Co-op | Sharon Taylor | 14,913 | 33.4 | −9.7 | |
| Liberal Democrat | Julia Davies | 7,432 | 16.6 | −1.7 | |
| UKIP | Marion Mason | 2,004 | 4.5 | +1.4 | |
| BNP | Michael Green | 1,007 | 2.3 | N/A | |
| English Democrats | Charles Vickers | 366 | 0.8 | N/A | |
| NCDMV! | Stephen Phillips | 327 | 0.7 | N/A | |
| Independent | David Cox | 80 | 0.2 | N/A | |
| Your Right To Democracy Party Ltd. | Andrew Ralph | 31 | 0.1 | N/A | |
| Majority | 3,578 | 8.0 | |||
| Turnout | 44,651 | 64.8 | +2.1 | ||
| Conservative gain from Labour | Swing | +8.0 | |||
Elections in the 2000s
| General Election 2005: Stevenage | |||||
|---|---|---|---|---|---|
| Party | Candidate | Votes | % | ±% | |
| Labour | Barbara Follett | 18,003 | 42.9 | −9.0 | |
| Conservative | George Freeman | 14,864 | 35.4 | +3.7 | |
| Liberal Democrat | Julia Davies | 7,610 | 18.1 | +3.9 | |
| UKIP | Victoria Peebles | 1,305 | 3.1 | N/A | |
| Independent | Antal Losonczi | 152 | 0.4 | −0.4 | |
| Majority | 3,139 | 7.5 | |||
| Turnout | 41,934 | 62.7 | +2.0 | ||
| Labour hold | Swing | −6.4 | |||
| General Election 2001: Stevenage | |||||
|---|---|---|---|---|---|
| Party | Candidate | Votes | % | ±% | |
| Labour | Barbara Follett | 22,025 | 51.9 | −3.5 | |
| Conservative | Graeme Quar | 13,459 | 31.7 | −1.1 | |
| Liberal Democrat | Harry Davies | 6,027 | 14.2 | +5.3 | |
| Socialist Alliance | Steve Glennon | 449 | 1.1 | N/A | |
| Independent | Antal Losonczi | 320 | 0.8 | N/A | |
| ProLife Alliance | Sarah Bell | 173 | 0.4 | N/A | |
| Majority | 8,566 | 20.2 | |||
| Turnout | 42,453 | 60.7 | −15.9 | ||
| Labour hold | Swing | ||||
Elections in the 1990s
| General Election 1997: Stevenage | |||||
|---|---|---|---|---|---|
| Party | Candidate | Votes | % | ±% | |
| Labour | Barbara Follett | 28,440 | 55.4 | +16.8 | |
| Conservative | Timothy Wood | 16,858 | 32.8 | −11.1 | |
| Liberal Democrat | Alex Wilcock | 4,588 | 8.9 | −8.2 | |
| Referendum Party | Jeffery Michael Coburn | 1,194 | 2.3 | N/A | |
| ProLife Alliance | David Bundy | 196 | 0.4 | N/A | |
| Natural Law | Andrew Calcraft | 110 | 0.2 | −0.2 | |
| Majority | 11,582 | 22.6 | |||
| Turnout | 51,386 | 76.6 | |||
| Labour gain from Conservative | Swing | 14.0 | |||
| General Election 1992: Stevenage[13] | |||||
|---|---|---|---|---|---|
| Party | Candidate | Votes | % | ±% | |
| Conservative | Timothy Wood | 26,652 | 45.7 | +3.6 | |
| Labour | Judith Church | 21,764 | 37.3 | +11.9 | |
| Liberal Democrat | Andrew A. Reilly | 9,668 | 16.6 | −15.9 | |
| Natural Law | Andrew Calcraft | 233 | 0.4 | N/A | |
| Majority | 4,888 | 8.4 | −1.2 | ||
| Turnout | 58,317 | 83.0 | +2.5 | ||
| Conservative hold | Swing | −4.1 | |||
Elections in the 1980s
| General Election 1987: Stevenage | |||||
|---|---|---|---|---|---|
| Party | Candidate | Votes | % | ±% | |
| Conservative | Timothy Wood | 23,541 | 42.1 | +2.7 | |
| Social Democratic | Ben Stoneham | 18,201 | 32.5 | −3.6 | |
| Labour | Malcolm Robert Crawford Withers | 14,229 | 25.4 | +1.4 | |
| Majority | 5,340 | 9.5 | |||
| Turnout | 80.5 | ||||
| Conservative hold | Swing | ||||
| General Election 1983: Stevenage | |||||
|---|---|---|---|---|---|
| Party | Candidate | Votes | % | ±% | |
| Conservative | Timothy Wood | 20,787 | 39.4 | N/A | |
| Social Democratic | Ben Stoneham | 19,032 | 36.1 | N/A | |
| Labour | S. Reeves | 12,673 | 24.0 | N/A | |
| BNP | D.R. Bowmaker | 236 | 0.5 | N/A | |
| Majority | 1,755 | 3.3 | N/A | ||
| Turnout | 52,728 | 77.9 | N/A | ||
| Conservative win (new seat) | |||||
See also
- List of Parliamentary constituencies in Hertfordshire
Notes and references
- Notes
- References
- ↑ "Electorate Figures - Boundary Commission for England". 2011 Electorate Figures. Boundary Commission for England. 4 March 2011. Retrieved 13 March 2011.
- ↑ 2010 post-revision map non-metropolitan areas and unitary authorities of England
- ↑ "The Parliamentary Constituencies (England) Order 2007 No. 1681". Office of Public Sector Information. Retrieved 2010-05-14.
- ↑ Unemployment claimants by constituency The Guardian
- ↑ Leigh Rayment's Historical List of MPs – Constituencies beginning with "S" (part 5)
- ↑ http://ukpollingreport.co.uk/2015guide/stevenage/
- ↑ 7.0 7.1 "Member of Parliament for Stevenage". YourNextMP. Retrieved 1 March 2015.
- ↑ http://www.tusc.org.uk/txt/320.pdf
- ↑ "List of selected candidates". Liberal Democrats. 4 March 2015. Retrieved 17 March 2015.
- ↑ http://northherts.greenparty.org.uk/candidates.html
- ↑ "Former Stevenage Ukip candidate Christopher Vickers to appear in court on GBH charge". Hertfordshire Mercury. 11 March 2015. Retrieved 19 March 2015.
- ↑ "Stevenage". BBC Online (BBC). 7 May 2010. Retrieved 7 May 2010.
- ↑ "UK General Election results April 1992". Richard Kimber's Political Science Resources. Politics Resources. 9 April 1992. Retrieved 2010-12-06.