Stellar classification

In astronomy, stellar classification is the classification of stars based on their spectral characteristics. Light from the star is analyzed by splitting it with a prism or diffraction grating into a spectrum exhibiting the rainbow of colors interspersed with absorption lines. Each line indicates an ion of a certain chemical element, with the line strength indicating the abundance of that ion. The relative abundance of the different ions varies with the temperature of the photosphere. The spectral class of a star is a short code summarizing the ionization state, giving an objective measure of the photosphere's temperature and density.
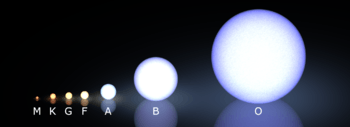
Most stars are currently classified under the Morgan–Keenan (MK) system using the letters O, B, A, F, G, K, and M, a sequence from the hottest (O type) to the coolest (M type). Each letter class is then subdivided using a numeric digit with 0 being hottest and 9 being coolest (e.g. A8, A9, F0, F1 form a sequence from hotter to cooler). The sequence has been expanded with classes for other stars and star-like objects that do not fit in the classical system, such class D for white dwarfs and class C for carbon stars.
In the MK system a luminosity class is added to the spectral class using Roman numerals. This is based on the width of certain absorption lines in the star's spectrum which vary with the density of the atmosphere and so distinguish giant stars from dwarfs. Luminosity class 0 or Ia+ stars for hypergiants, class I stars for supergiants, class II for bright giants, class III for regular giants, class IV for sub-giants, class V for main-sequence stars, class sd for sub-dwarfs, and class D for white dwarfs. The full spectral class for the Sun is then G2V, indicating a main-sequence star with a temperature around 5,800K.
Modern classification
The modern classification system is known as the Morgan–Keenan (MK) classification. Each star is assigned a spectral class from the older Harvard spectral classification and a luminosity class using Roman numerals as explained below, forming the star's spectral type.
Harvard spectral classification
The Harvard classification system is a one-dimensional classification scheme using single letters of the alphabet, optionally with numeric subdivisions, to group stars according to their spectral characteristics. Main-sequence stars vary in surface temperature from approximately 2,000 to 50,000 K, whereas more-evolved stars can have temperatures above 100,000 K. Physically, the classes indicate the temperature of the star's atmosphere and are normally listed from hottest to coldest.
| Class | Effective temperature[1][2][3] | Conventional color description[nb 1] | Actual apparent color[4][5][6] | Main-sequence mass[1][7] (solar masses) |
Main-sequence radius[1][7] (solar radii) |
Main-sequence luminosity[1][7] (bolometric) |
Hydrogen lines |
Fraction of all main-sequence stars[8] |
|---|---|---|---|---|---|---|---|---|
| O | ≥ 30,000 K | blue | blue | ≥ 16 M☉ | ≥ 6.6 R☉ | ≥ 30,000 L☉ | Weak | ~0.00003% |
| B | 10,000–30,000 K | blue white | deep blue white | 2.1–16 M☉ | 1.8–6.6 R☉ | 25–30,000 L☉ | Medium | 0.13% |
| A | 7,500–10,000 K | white | blue white | 1.4–2.1 M☉ | 1.4–1.8 R☉ | 5–25 L☉ | Strong | 0.6% |
| F | 6,000–7,500 K | yellow white | white | 1.04–1.4 M☉ | 1.15–1.4 R☉ | 1.5–5 L☉ | Medium | 3% |
| G | 5,200–6,000 K | yellow | yellowish white | 0.8–1.04 M☉ | 0.96–1.15 R☉ | 0.6–1.5 L☉ | Weak | 7.6% |
| K | 3,700–5,200 K | orange | pale yellow orange | 0.45–0.8 M☉ | 0.7–0.96 R☉ | 0.08–0.6 L☉ | Very weak | 12.1% |
| M | 2,400–3,700 K | red | light orange red | 0.08–0.45 M☉ | ≤ 0.7 R☉ | ≤ 0.08 L☉ | Very weak | 76.45% |

The spectral classes O through M, as well as other more specialized classes discussed later, are subdivided by Arabic numerals (0–9), which can be further divided into half-subtypes. For example, A0 denotes the hottest stars in the A class and A9 denotes the coolest ones. The Sun is classified as G2.
O, B, and A stars are sometimes called "early type", whereas K and M stars are said to be "late type″. This stems from an early 20th-century model of stellar evolution in which stars were powered by gravitational contraction via the Kelvin–Helmholtz mechanism whereby stars start their lives as very hot "early-type" stars, and then gradually cool down, evolving into "late-type″ stars. This mechanism provided ages of the Sun that were much smaller than what is observed, and was rendered obsolete by the discovery that stars are powered by nuclear fusion.
Yerkes spectral classification
The Yerkes spectral classification, also called the MKK system from the authors' initials, is a system of stellar spectral classification introduced in 1943 by William Wilson Morgan, Philip C. Keenan, and Edith Kellman from Yerkes Observatory.[9] This two-dimensional (temperature and luminosity) classification scheme is based on spectral lines sensitive to stellar temperature and surface gravity which is related to luminosity (whilst the Harvard classification is based on surface temperature only). Later, in 1953, after some revisions of list of standard stars and classification criteria, the scheme was named the Morgan–Keenan classification, or MK (by William Wilson Morgan and Philip C. Keenan's initials),[10] and this system remains the system in modern use today.
Denser stars with higher surface gravity exhibit greater pressure broadening of spectral lines. The gravity, and hence the pressure, on the surface of a giant star is much lower than for a dwarf star because the radius of the giant is much greater than a dwarf of similar mass. Therefore differences in the spectrum can be interpreted as luminosity effects and a luminosity class can be assigned purely from examination of the spectrum.
A number of different luminosity classes are distinguished[11]
- 0 or Ia+ (hypergiants or extremely luminous supergiants). Example: Cygnus OB2#12 (B3-4Ia+)[12]
- Ia (luminous supergiants). Example: Eta Canis Majoris (B5Ia)[13]
- Iab (intermediate luminous supergiants). Example: Gamma Cygni (F8Iab)[14]
- Ib (less luminous supergiants). Example: Zeta Persei (B1Ib)[15]
- II bright giants. Example: Beta Leporis (G0II)[16]
- III normal giants. Example: Arcturus (K0III)[17]
- IV subgiants. Example: Gamma Cassiopeiae (B0.5IVpe)[18]
- V main-sequence stars (dwarfs), Example: Achernar (B6Vep)[15]
- sd (prefix) subdwarfs. Example: HD 149382 (sdB5)[19]
- D (prefix) white dwarfs.[nb 2] Example: van Maanen 2 (DZ8)[20]
Marginal cases are allowed; for example, a star may be either a supergiant or a bright giant, or may be in between the subgiant and main-sequence classifications. In these cases, two special symbols are used: a slash (/) means that a star is either one class or the other, and a dash (-) means that the star is in between the two classes. For example, a star classified as A3-4III/IV would be in between spectral types A3 and A4, while being either a giant star or a subgiant.
Spectral peculiarities
Additional nomenclature, in the form of lower-case letters, can follow the spectral type to indicate peculiar features of the spectrum.[21]
| Code | Spectral peculiarities for stars |
|---|---|
| : | uncertain spectral value[11] |
| ... | Undescribed spectral peculiarities exist |
| ! | Special peculiarity |
| comp | Composite spectrum[22] |
| e | Emission lines present[22] |
| [e] | "Forbidden" emission lines present |
| er | "Reversed" center of emission lines weaker than edges |
| eq | Emission lines with P Cygni profile |
| f | N III and He II emission[11] |
| f* | NIV λ4058Å is stronger than the NIII λ4634Å, λ4640Å, & λ4642Å lines[23] |
| f+ | SiIV λ4089Å & λ4116Å are emission in addition to the NIII line[23] |
| (f) | N III emission, absence or weak absorption of He II |
| (f+) | [24] |
| ((f)) | Displays strong HeII absorption accompanied by weak NIII emissions[25] |
| ((f*)) | [24] |
| h | WR stars with emission lines due to hydrogen.[26] |
| ha | WR stars with hydrogen emissions seen on both absorption and emission.[26] |
| He wk | Weak He lines |
| k | Spectra with interstellar absorption features |
| m | Enhanced metal features[22] |
| n | Broad ("nebulous") absorption due to spinning[22] |
| nn | Very broad absorption features[11] |
| neb | A nebula's spectrum mixed in[22] |
| p | Unspecified peculiarity, peculiar star.[nb 3][22] |
| pq | Peculiar spectrum, similar to the spectra of novae |
| q | Red & blue shifts line present |
| s | Narrowly "sharp" absorption lines[22] |
| ss | Very narrow lines |
| sh | Shell star features[22] |
| var | Variable spectral feature[22] (sometimes abbreviated to "v") |
| wl | Weak lines[22] (also "w" & "wk") |
| Element symbol |
Abnormally strong spectral lines of the specified element(s)[22] |
| P | Magnetic white dwarf with detectable polarization (white dwarf only) |
| E | Emission lines present (white dwarf only) |
| H | Magnetic white dwarf without detectable polarization (white dwarf only) |
| V | Variable (white dwarf only) |
| PEC | Spectral peculiarities exist (white dwarf only) |
For example, 59 Cygni is listed as spectral type B1.5Vnne,[27] indicating a spectrum with the general classification B1.5V, as well as very broad absorption lines and certain emission lines.
Conventional and apparent colors

The conventional color descriptions are traditional in astronomy, and represent colors relative to the mean color of an A-class star which is considered to be white. The apparent color[4] descriptions are what the observer would see if trying to describe the stars under a dark sky without aid to the eye, or with binoculars. The table colors used are D65 standard colors calculated for the midpoint of each spectral class (e.g. G5 or A5) and for main-sequence stars.[6] These are accurate representations of the actual color of the disk of a star. Most stars in the sky, except the brightest ones, appear white or bluish white to the unaided eye because they are too dim for color vision to work. Red supergiants are cooler and redder than dwarfs of the same spectral type, and stars with particular spectral features such as carbon stars may be far redder than any black body.
The Sun itself appears white and approximates a black body of 5780 K (see color temperature). It is sometimes called a yellow star (spectroscopically relative to Vega), although it may appear yellow or red when viewed through the atmosphere, or appear white if viewed when too bright for the eye to see any color.[28]
History
The reason for the odd arrangement of letters in the Harvard classification is historical, having evolved from the earlier Secchi classes and been progressively modified as understanding improved.
Secchi classes
During the 1860s and 1870s, pioneering stellar spectroscopist Father Angelo Secchi created the Secchi classes in order to classify observed spectra. By 1866, he had developed three classes of stellar spectra:[29][30][31]
- Class I: white and blue stars with broad heavy hydrogen lines, such as Vega and Altair. This includes the modern class A and early class F.
- Class I, Orion subtype: a subtype of class I with narrow lines in place of wide bands, such as Rigel and Bellatrix. In modern terms, this corresponds to early B-type stars
- Class II: yellow stars—hydrogen less strong, but evident metallic lines, such as the Sun, Arcturus, and Capella. This includes the modern classes G and K as well as late class F.
- Class III: orange to red stars with complex band spectra, such as Betelgeuse and Antares. This corresponds to the modern class M.
In 1868, he discovered carbon stars, which he put into a distinct group:[32]
- Class IV: red stars with significant carbon bands and lines (carbon stars.)
In 1877, he added a fifth class:[33]
- Class V: emission-line stars, such as γ Cassiopeiae and Sheliak.
In the late 1890s, this classification began to be superseded by the Harvard classification, which is discussed in the remainder of this article.[34][35][36]
Draper system
| Secchi | Draper | Comment |
|---|---|---|
| I | A, B, C, D | Hydrogen lines dominant. |
| II | E, F, G, H, I, K, L | |
| III | M | |
| IV | N | Did not appear in the catalogue. |
| O | Wolf–Rayet spectra with bright lines. | |
| P | Planetary nebulae. | |
| Q | Other spectra. |
In the 1880s, the astronomer Edward C. Pickering began to make a survey of stellar spectra at the Harvard College Observatory, using the objective-prism method. A first result of this work was the Draper Catalogue of Stellar Spectra, published in 1890. Williamina Fleming classified most of the spectra in this catalogue. It used a scheme in which the previously used Secchi classes (I to IV) were divided into more specific classes, given letters from A to N. Also, the letters O, P and Q were used, O for stars whose spectra consisted mainly of bright lines, P for planetary nebulae, and Q for stars not fitting into any other class.[37][38]
Harvard system
In 1897, another worker at Harvard, Antonia Maury, placed the Orion subtype of Secchi class I ahead of the remainder of Secchi class I, thus placing the modern type B ahead of the modern type A. She was the first to do so, although she did not use lettered spectral types, but rather a series of twenty-two types numbered from I to XXII.[39][40]
In 1901, Annie Jump Cannon returned to the lettered types, but dropped all letters except O, B, A, F, G, K, and M, used in that order, as well as P for planetary nebulae and Q for some peculiar spectra. She also used types such as B5A for stars halfway between types B and A, F2G for stars one-fifth of the way from F to G, and so forth.[41][42] Finally, by 1912, Cannon had changed the types B, A, B5A, F2G, etc. to B0, A0, B5, F2, etc.[43][44] This is essentially the modern form of the Harvard classification system. A common mnemonic for remembering the spectral type letters is "Oh, Be A Fine Guy/Girl, Kiss Me".
Modern interpretation

The fact that the Harvard classification of a star indicated its surface or photospheric temperature (or more precisely, its effective temperature) was not fully understood until after its development, though by the time the first Hertzsprung–Russell diagram was formulated (by 1914), this was generally suspected to be true.[45] In the 1920s, the Indian physicist Meghnad Saha derived a theory of ionization by extending well-known ideas in physical chemistry pertaining to the dissociation of molecules to the ionization of atoms. First he applied it to the solar chromosphere, then to stellar spectra.[46] The Harvard astronomer Cecilia Helena Payne (later to become Cecilia Payne-Gaposchkin) then demonstrated that the OBAFGKM spectral sequence is actually a sequence in temperature.[47] Because the classification sequence predates our understanding that it is a temperature sequence, the placement of a spectrum into a given subtype, such as B3 or A7, depends upon (largely subjective) estimates of the strengths of absorption features in stellar spectra. As a result, these subtypes are not evenly divided into any sort of mathematically representable intervals.
Spectral types
Class O

Class O stars are very hot and extremely luminous, with most of their radiated output in the ultraviolet range. These are the rarest of all main-sequence stars. About 1 in 3,000,000 (0.00003%) of the main-sequence stars in the solar neighborhood are class O stars.[nb 4][8] Some of the most massive stars lie within this spectral class. Class O stars frequently have complicated surroundings which make measurement of their spectra difficult.
O stars have dominant lines of absorption and sometimes emission for He II lines, prominent ionized (Si IV, O III, N III, and C III) and neutral helium lines, strengthening from O5 to O9, and prominent hydrogen Balmer lines, although not as strong as in later types. Because they are so massive, class O stars have very hot cores and burn through their hydrogen fuel very quickly, so they are the first stars to leave the main sequence.
When the MKK classification scheme was first described in 1943, the only subtypes of class O used were O5 to O9.5.[48] The MKK scheme was extended to O9.7 in 1971[49] and O4 in 1978,[50] and new classification schemes have subsequently been introduced which add types O2, O3 and O3.5.[51]
- Spectral standards:[52]
- O7V: S Monocerotis
- O9V: 10 Lacertae
Class B

Class B stars are very luminous and blue. Their spectra have neutral helium, which are most prominent at the B2 subclass, and moderate hydrogen lines. Ionized metal lines include Mg II and Si II. As O and B stars are so energetic, they only live for a relatively short time. Thus, due to the low probability of kinematic interaction during their lifetime, they do not, and are unable to, stray far from the area in which they were formed.
These stars tend to be found in their originating OB associations, which are associated with giant molecular clouds. The Orion OB1 association occupies a large portion of a spiral arm of the Milky Way and contains many of the brighter stars of the constellation Orion. About 1 in 800 (0.125%) of the main-sequence stars in the solar neighborhood are class B stars.[nb 4][8]
- Spectral standards:[52]
- B0V: Upsilon Orionis
- B0Ia: Alnilam
- B2Ia: Chi2 Orionis
- B2Ib: 9 Cephei
- B3V: Eta Ursae Majoris
- B3V: Eta Aurigae
- B3Ia: Omicron2 Canis Majoris
- B5Ia: Eta Canis Majoris
- B8Ia: Rigel
Class A
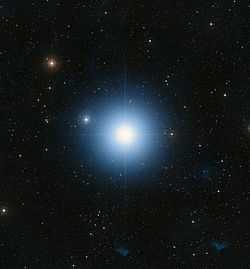
Class A stars are among the more common naked eye stars, and are white or bluish-white. They have strong hydrogen lines, at a maximum by A0, and also lines of ionized metals (Fe II, Mg II, Si II) at a maximum at A5. The presence of Ca II lines is notably strengthening by this point. About 1 in 160 (0.625%) of the main-sequence stars in the solar neighborhood are class A stars.[nb 4][8][53]
- Spectral standards:[52]
- A0Van: Gamma Ursae Majoris
- A0Va: Vega
- A0Ib: Eta Leonis
- A0Ia: HD 21389
- A2Ia: Deneb
- A3Va: Fomalhaut
Class F
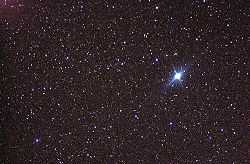
Class F stars have strengthening H and K lines of Ca II. Neutral metals (Fe I, Cr I) beginning to gain on ionized metal lines by late F. Their spectra are characterized by the weaker hydrogen lines and ionized metals. Their color is white. About 1 in 33 (3.03%) of the main-sequence stars in the solar neighborhood are class F stars.[nb 4][8]
- Spectral standards:[52]
- F0IIIa: Zeta Leonis
- F0Ib: Alpha Leporis
- F2V: 78 Ursae Majoris
Class G

Class G stars are probably the best known, if only for the reason that the Sun is of this class. They make up about 7.5%, nearly one in thirteen, of the main-sequence stars in the solar neighborhood.[nb 4][8]
Most notable are the H and K lines of Ca II, which are most prominent at G2. They have even weaker hydrogen lines than F, but along with the ionized metals, they have neutral metals. There is a prominent spike in the G band of CH molecules. G is host to the "Yellow Evolutionary Void".[54] Supergiant stars often swing between O or B (blue) and K or M (red). While they do this, they do not stay for long in the yellow supergiant G classification as this is an extremely unstable place for a supergiant to be.
- Spectral standards:[52]
- G0V: Beta Canum Venaticorum
- G0IV: Eta Boötis
- G0Ib: Beta Aquarii
- G2V: Sun
- G5V: Kappa Ceti
- G5IV: Mu Herculis
- G5Ib: 9 Pegasi
- G8V: 61 Ursae Majoris
- G8IV: Beta Aquilae
- G8IIIa: Kappa Geminorum
- G8IIIab: Epsilon Virginis
- G8Ib: Epsilon Geminorum
Class K
- "K STAR" redirects here. For the Korean nuclear fusion project, see KSTAR.
.png)
Class K stars are orangish stars that are slightly cooler than the Sun. They make up about 12%, nearly one in eight, of the main-sequence stars in the solar neighborhood.[nb 4][8] There are also giant K-type stars, which range from hypergiants like RW Cephei, to giants and supergiants, such as Arcturus, whereas orange dwarfs, like Alpha Centauri B, are main-sequence stars.
They have extremely weak hydrogen lines, if they are present at all, and mostly neutral metals (Mn I, Fe I, Si I). By late K, molecular bands of titanium oxide become present. There is a suggestion that K Spectrum stars may potentially increase the chances of life developing on orbiting planets that are within the habitable zone.[55]
- Spectral standards:[52]
- K0V: Sigma Draconis
- K0III: Pollux
- K0III: Epsilon Cygni
- K2V: Epsilon Eridani
- K2III: Kappa Ophiuchi
- K3III: Rho Boötis
- K5V: 61 Cygni A
- K5III: Gamma Draconis
Class M

Class M stars are by far the most common. About 76% of the main-sequence stars in the Solar neighborhood are class M stars.[nb 4][nb 5][8] However, because main-sequence stars of spectral class M have such low luminosities, none are bright enough to be visible to see with the unaided eye. The brightest known M-class main-sequence star is M0V Lacaille 8760 at magnitude 6.6 (the fractionally brighter Groombridge 1618 was once considered to be class M0 but is now considered to be as K5) and it is extremely unlikely that any brighter examples will be found.
Although most class M stars are red dwarfs, the class also hosts most giants and some supergiants such as VY Canis Majoris, Antares and Betelgeuse. Furthermore, the late-M group holds hotter brown dwarfs that are above the L spectrum. This is usually in the range of M6.5 to M9.5. The spectrum of a class M star shows lines belonging to oxide molecules, TiO in particular, in the visible and all neutral metals, but absorption lines of hydrogen are usually absent. TiO bands can be strong in class M stars, usually dominating their visible spectrum by about M5. Vanadium monoxide bands become present by late M.
- Spectral standards:[52]
- M0IIIa: Beta Andromedae
- M2III: Chi Pegasi
- M1-M2Ia-Iab: Betelgeuse
- M2Ia: Mu Cephei
Extended spectral types
A number of new spectral types have been taken into use from newly discovered types of stars.[56]
Hot blue emission star classes

Spectra of some very hot and bluish stars exhibit marked emission lines from carbon or nitrogen, or sometimes oxygen.
Class W: Wolf–Rayet

Class W or WR represents the Wolf–Rayet stars, notable for spectra lacking hydrogen lines. Instead their spectra are dominated by broad emission lines of highly ionised helium, nitrogen, carbon and sometimes oxygen. They are thought to mostly be dying supergiants with their hydrogen layers blown away by stellar winds, thereby directly exposing their hot helium shells. Class W is further divided into subclasses according to the relative strength of nitrogen and carbon emission lines in their spectra (and outer layers).[26]
WR spectra range is listed below:[58][59]
- WN,[26] spectrum dominated by NitrogenIII-V and HeliumI-II lines
- WNE (WN2 to WN5 with some WN6), hotter or "early"
- WNL (WN7 to WN9 with some WN6), cooler or "late"
- Extended WN classes WN10 and WN11 sometimes used for the Ofpe/WN9 stars[26]
- h tag used (e.g. WN9h) for WR with hydrogen emission and ha (e.g. WN6ha) for both hydrogen emission and absorption
- WN/C, WN stars plus strong CarbonIV lines, intermediate between WN and WC stars[26]
- WC,[26] spectrum with strong CarbonII-IV lines
- WCE (WC4 to WC6), hotter or "early"
- WCL (WC7 to WC9), cooler or "late"
- WO (WO1 to WO4), strong OxygenVI lines, extremely rare
Although the central stars of most planetary nebulae (CSPNe) show O-type spectra,[60] around 10% are hydrogen-deficient and show WR spectra.[61] These are low mass stars and to distinguish them from the massive Wolf Rayet stars, their spectra are enclosed in square brackets: e.g. [WC]. Most of these show [WC] spectra, some [WO], and very rarely [WN].
Wolf–Rayet examples:
- Example: R136a1 (WN5h)
- Example: Gamma2 Velorum A (WC8)
- Example: WR93B (WO3)
The "Slash" stars
The slash stars are stars with O-type spectra and WN sequence in their spectra. The name slash comes from their spectra having a slash.
- Example spectra: Of/WNL[62]
There is a secondary group found with this spectra, a cooler, "intermediate" group with designation of Ofpe/WN9.[62] These stars have also been referred to as WN10 or WN11, but that has become less popular with the realisation of the evolutionary difference to other Wolf–Rayet stars. Recent discoveries of even rarer stars have extended the range of slash stars as far as O2-3.5If*/WN5-7, which are even hotter than the original slash stars.[63]
Cool red and brown dwarf classes
The new spectral types L, T and Y were created to classify infrared spectra of cool stars. This includes both red dwarfs and brown dwarfs that are very faint in the visual spectrum.[64]
Brown dwarfs, whose energy comes from gravitational attraction alone, cool as they age and so progress to later spectral types. Brown dwarfs start their lives with M-type spectra and will cool through the L, T, and Y spectral classes; faster the less massive they are—the highest-mass brown dwarfs cannot have cooled to Y or even T dwarfs within the age of the universe. Because this leads to a degeneracy between mass and age for a given effective temperature and luminosity, no unique values can be assigned to a given spectral type.[7]
Class L

Class L dwarfs get their designation because they are cooler than M stars and L is the remaining letter alphabetically closest to M. L does not mean lithium dwarf; a large fraction of these stars do not have lithium in their spectra. Some of these objects have masses large enough to support hydrogen fusion, but some are of substellar mass and do not, so collectively these objects should be referred to as L dwarfs, not L stars. They are a very dark red in color and brightest in infrared. Their atmosphere is cool enough to allow metal hydrides and alkali metals to be prominent in their spectra.[65][66][67] Due to low gravities in giant stars, TiO- and VO-bearing condensates never form. Thus, larger L-type stars can never form in an isolated environment. It may be possible for these L-type supergiants to form through stellar collisions, however, an example of which is V838 Monocerotis.
- L: 1,300–2,400 K, dwarfs (some stellar, some substellar) with metal hydrides and alkali metals prominent in their spectra.
- Example: VW Hyi
- Example: 2MASSW J0746425+2000321 binary[68]
- Component A is an L dwarf star
- Component B is an L brown dwarf
- Example: LSR 1610-0040 (subdwarf)[69]
- Example: V838 Monocerotis (supergiants)
Class T: methane dwarfs

Class T dwarfs are cool brown dwarfs with surface temperatures between approximately 700 and 1,300 K. Their emission peaks in the infrared. Methane is prominent in their spectra.[65][66]
- T: ~500–1,300 K, cooler brown dwarfs with methane in the spectrum
- Examples: SIMP 0136 (the brightest T dwarf discovered in northern hemisphere)[70]
- Examples: Epsilon Indi Ba & Epsilon Indi Bb
- Examples: CFBDS 1448 a T dwarf with an exoplanet orbiting it
Class T and L could be more common than all the other classes combined if recent research is accurate. Study of the number of proplyds (protoplanetary discs, clumps of gas in nebulae from which stars and planetary systems are formed) indicates that the number of stars in the galaxy should be several orders of magnitude higher than what we know about. It is theorized that these proplyds are in a race with each other. The first one to form will become a proto-star, which are very violent objects and will disrupt other proplyds in the vicinity, stripping them of their gas. The victim proplyds will then probably go on to become main-sequence stars or brown dwarfs of the L and T classes, which are quite invisible to us. Because brown dwarfs can live so long, these smaller bodies accumulate over time.
Class Y

Brown dwarfs of spectral class Y are cooler than those of spectral class T and have qualitatively different spectra from them. A total of 17 objects have been placed in class Y as of August 2013.[71] Although such dwarfs have been modelled[72] and detected within forty light years by the Wide-field Infrared Survey Explorer (WISE)[56][73][74][75][76] there is no well-defined spectral sequence yet with prototypes. Nevertheless, several objects have been assigned spectral classes Y0, Y1, and Y2.[77] The spectra of these objects display absorption around 1.55 micrometers.[78] Delorme et al. has suggested that this feature is due to absorption from ammonia and that this should be taken as indicating the T–Y transition, making these objects of type Y0.[78][79] In fact, this ammonia-absorption feature is the main criterion that has been adopted to define this class.[77] However, this feature is difficult to distinguish from absorption by water and methane,[78] and other authors have stated that the assignment of class Y0 is premature.[80]
- Y: < 600 K, ultra-cool brown dwarfs
- Example: WISE 0410+1502, class Y0
- Example: WISE 0350-5658, class Y1
- Example: WISE 1405+5534, class Y1
The brown dwarf with the latest assigned spectral type, WISE 1828+2650, is a >Y2 dwarf with an effective temperature originally estimated around 300 K, the temperature of the human body.[73][74][81] Parallax measurements have however since shown that its luminosity is inconsistent with it being colder than ~400 K; the likely coolest Y dwarf currently known is WD 0806−661B with approximately 350 K.[2]
The mass range for Y dwarfs is 9–25 Jupiter masses, but for young objects might reach below one Jupiter mass, which means that Y class objects straddle the 13 Jupiter mass deuterium-fusion limit that marks the division between brown dwarfs and planets.[77]
Carbon-related late giant star classes
Carbon-related stars are stars whose spectra indicate production of carbon by helium triple-alpha fusion. With increased carbon abundance, and some parallel s-process heavy element production, the spectra of these stars become increasingly deviant from the usual late spectral classes G, K and M. The giants among those stars are presumed to produce this carbon themselves, but not too few of this class of stars are believed to be double stars whose odd atmosphere once was transferred from a former carbon star companion that is now a white dwarf.
Class C: carbon stars
.jpg)
Originally classified as R and N stars, these are also known as 'carbon stars'. These are red giants, near the end of their lives, in which there is an excess of carbon in the atmosphere. The old R and N classes ran parallel to the normal classification system from roughly mid G to late M. These have more recently been remapped into a unified carbon classifier C, with N0 starting at roughly C6. Another subset of cool carbon stars are the J-type stars, which are characterized by the strong presence of molecules of 13CN in addition to those of 12CN.[82] A few dwarf (that is, main-sequence) carbon stars are known, but the overwhelming majority of known carbon stars are giants or supergiants.
- C: Carbon stars, e.g. R CMi
- C-R: Formerly a class on its own representing the carbon star equivalent of late G to early K stars. Example: S Camelopardalis
- C-N: Formerly a class on its own representing the carbon star equivalent of late K to M stars. Example: R Leporis
- C-J: A subtype of cool C stars with a high content of 13C. Example: Y Canum Venaticorum
- C-H: Population II analogues of the C-R stars. Examples: V Ari, TT CVn[83]
- C-Hd: Hydrogen-Deficient Carbon Stars, similar to late G supergiants with CH and C2 bands added. Examples: HD 137613, R Coronae Borealis
Class S
Class S stars have zirconium monoxide lines in addition to (or, rarely, instead of) those of titanium monoxide, and are in between the class M stars and the carbon stars.[84] S stars have excess amounts of zirconium and other elements produced by the s-process, and have their carbon and oxygen abundances closer to equal than is the case for M stars. The latter condition results in both carbon and oxygen being locked up almost entirely in carbon monoxide molecules. For stars cool enough for carbon monoxide to form that molecule tends to "eat up" all of whichever element is less abundant, resulting in "leftover oxygen" (which becomes available to form titanium oxide) in stars of normal composition, "leftover carbon" (which becomes available to form the diatomic carbon molecules) in carbon stars, and "leftover nothing" in the S stars. The relation between these stars and the ordinary M stars indicates a continuum of carbon abundance. Like carbon stars, nearly all known S stars are giants or supergiants.
- Examples: S Ursae Majoris, BD Camelopardalis
Classes MS and SC: intermediary carbon-related classes
In between the M class and the S class, border cases are named MS stars. In a similar way border cases between the S class and the C-N class are named SC or CS. The sequence M → MS → S → SC → C-N is believed to be a sequence of increased carbon abundance with age for carbon stars in the asymptotic giant branch.
- Examples: R Serpentis, ST Monocerotis (MS)
- Examples: CY Cygni, BH Crucis (SC)
White dwarf classifications
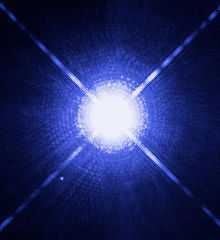
The class D (for Degenerate) is the modern classification used for white dwarfs – low-mass stars that are no longer undergoing nuclear fusion and have shrunk to planetary size, slowly cooling down. Class D is further divided into spectral types DA, DB, DC, DO, DQ, DX, and DZ. The letters are not related to the letters used in the classification of other stars, but instead indicate the composition of the white dwarf's visible outer layer or atmosphere.
- Examples: Sirius B (DA2), Procyon B (DA4), Van Maanen's star (DZ7)[85], Table 1
The white dwarf types are as follows:[86][87]
- DA: a hydrogen-rich atmosphere or outer layer, indicated by strong Balmer hydrogen spectral lines.
- DB: a helium-rich atmosphere, indicated by neutral helium, He I, spectral lines.
- DO: a helium-rich atmosphere, indicated by ionized helium, He II, spectral lines.
- DQ: a carbon-rich atmosphere, indicated by atomic or molecular carbon lines.
- DZ: a metal-rich atmosphere, indicated by metal spectral lines (a merger of the obsolete white dwarf spectral types, DG, DK and DM).
- DC: no strong spectral lines indicating one of the above categories.
- DX: spectral lines are insufficiently clear to classify into one of the above categories.
The type is followed by a number giving the white dwarf's surface temperature. This number is a rounded form of 50400/Teff, where Teff is the effective surface temperature, measured in kelvins. Originally, this number was rounded to one of the digits 1 through 9, but more recently fractional values have started to be used, as well as values below 1 and above 9.[86][88]
Two or more of the type letters may be used to indicate a white dwarf which displays more than one of the spectral features above. Also, the letter V is used to indicate a variable white dwarf.[86]
Extended white dwarf spectral types:[86]
- DAB: a hydrogen- and helium-rich white dwarf displaying neutral helium lines.
- DAO: a hydrogen- and helium-rich white dwarf displaying ionized helium lines.
- DAZ: a hydrogen-rich metallic white dwarf.
- DBZ: a helium-rich metallic white dwarf.
Variable star designations:
- DAV or ZZ Ceti: a hydrogen-rich pulsating white dwarf.[89], pp. 891, 895
- DBV or V777 Her: a helium-rich pulsating white dwarf.[90], p. 3525
- GW Vir, sometimes divided into DOV and PNNV: a hot helium-rich pulsating white dwarf (or pre-white dwarf.)[91], §1.1, 1.2;[92][93] These stars are generally PG 1159 stars, although some authors also include non-PG 1159 stars in this class.[91][94]
- DCV or Gliese 86 B: a cool helium-rich white dwarf.
Non-stellar spectral types: Classes P and Q
Finally, the classes P and Q are occasionally used for certain non-stellar objects. Type P objects are planetary nebulae and type Q objects are novae.
Degenerate and exotic stars
These objects are not stars but are stellar remnants. They are much dimmer and if placed on the HR diagram, would be placed further to the lower left-hand corner.[95]
Stellar classification, habitability, and the search for life
Stability, luminosity, and lifespan are all factors in stellar habitability. We only know of one star that hosts life, the Sun, a G-class star with an abundance of heavy elements and low variability in brightness. It is also unlike many stellar systems in that there is only one star in its system (see Planetary habitability, under the binary systems section).
Working from these constraints and the problems of having an empirical sample set of only one, the range of stars that are predicted to be able to support life as we know it is limited by a few factors. Of the main-sequence star types, stars more massive than 1.5 times that of the Sun (spectral types O, B, and A) age too quickly for advanced life to develop (using Earth as a guideline). On the other extreme, dwarfs of less than half the mass of the Sun (spectral type M) are likely to tidally lock planets within their habitable zone, along with other problems (see Habitability of red dwarf systems).[96] Although there are many problems facing life on red dwarfs, due to their sheer numbers and longevity many astronomers continue to model these systems.
For these reasons NASA's Kepler Mission has been searching for habitable planets mainly at main-sequence stars that are less massive than spectral type A but more massive than type M—i.e. main-sequence stars of types F, G, and K, the most probable stars to host life.[96]
Variable star classification
Stars that exhibit change in luminosity are variable stars. There is a variable star classification scheme that encompasses existing stars that are classified in the spectra classification.
Photometric classification
Stars can also be classified using photometric data from any photometric system. For example, we can calibrate color index diagrams of U−B and B−V in the UBV system according to spectral and luminosity classes. Nevertheless, this calibration is not straightforward, because many effects are superimposed in such diagrams: interstellar reddening, color changes due to metallicity, and the blending of light from binary and multiple stars.
Photometric systems with more colors and narrower passbands allow a star's class, and hence physical parameters, to be determined more precisely. The most accurate determination comes of course from spectral measurements, but there is not always enough time to get qualitative spectra with high signal-to-noise ratio.
See also
- Astrograph
- Guest star
- Spectral signature
- Stellar evolution
- Star count, survey of stars
- UBV photometric system
Notes
- ↑ The conventional color description takes into account only the peak of the stellar spectrum. However, in actuality stars radiate in all parts of the spectrum, and because all spectral colors combined appear white, the actual apparent colors the human eye would observe are lighter than the conventional color descriptions. See Conventional and apparent colors.
- ↑ Use a different set of spectral types from element-burning stars
- ↑ When used with A-type stars, this instead refers to abnormally strong metallic spectral lines
- ↑ 4.0 4.1 4.2 4.3 4.4 4.5 4.6 These proportions are fractions of stars brighter than absolute magnitude 16; lowering this limit will render earlier types even rarer, whereas generally adding only to the M class.
- ↑ This rises to 78.6% if we include all stars. (See the above note.)
References
- ↑ 1.0 1.1 1.2 1.3 Tables VII, VIII, Empirical bolometric corrections for the main-sequence, G. M. H. J. Habets and J. R. W. Heinze, Astronomy and Astrophysics Supplement Series 46 (November 1981), pp. 193–237, Bibcode: 1981A&AS...46..193H. Luminosities are derived from Mbol figures, using Mbol(☉)=4.75.
- ↑ 2.0 2.1 T. J. Dupuy & A. L. Kraus (2013). "Distances, Luminosities, and Temperatures of the Coldest Known Substellar Objects". Science. published online 5 September 2013 (6153): 1492–1495. arXiv:1309.1422. Bibcode:2013Sci...341.1492D. doi:10.1126/science.1241917.
- ↑ Carsten Weidner; Jorick Vink (2010). "The masses, and the mass discrepancy of O-type stars". arXiv:1010.2204v1 [astro-ph.SR].
- ↑ 4.0 4.1 The Guinness book of astronomy facts & feats, Patrick Moore, 1992, 0-900424-76-1
- ↑ "The Colour of Stars". Australia Telescope Outreach and Education. 2004-12-21. Retrieved 2007-09-26. — Explains the reason for the difference in color perception.
- ↑ 6.0 6.1 Charity, Mitchell. "What color are the stars?". Retrieved 2006-05-13.
- ↑ 7.0 7.1 7.2 7.3 Baraffe; Chabrier; Barman; Allard & Hauschildt (2003). "Evolutionary models for cool brown dwarfs and extrasolar giant planets. The case of HD 209458". Astronomy and Astrophysics 402 (2): 701. arXiv:astro-ph/0302293. Bibcode:2003A&A...402..701B. doi:10.1051/0004-6361:20030252.
- ↑ 8.0 8.1 8.2 8.3 8.4 8.5 8.6 8.7 LeDrew, G.; The Real Starry Sky, Journal of the Royal Astronomical Society of Canada, Vol. 95, No. 1 (whole No. 686, February 2001), pp. 32–33. Note: Table 2 has an error and so this article will use 824 as the assumed correct total of main-sequence stars
- ↑ Morgan, William Wilson; Keenan, Philip Childs; Kellman, Edith (1943), "An atlas of stellar spectra, with an outline of spectral classification", Chicago, Ill., The University of Chicago press
- ↑ Philip C. Keenan, William Wilson Morgan; Keenan, P C (1973). "Spectral Classification". Annual Reviews of Astronomy and Astrophysics (Annual Reviews) 11 (1): 29–50. Bibcode:1973ARA&A..11...29M. doi:10.1146/annurev.aa.11.090173.000333.
- ↑ 11.0 11.1 11.2 11.3 "A note on the spectral atlas and spectral classification". Centre de données astronomiques de Strasbourg. Retrieved 2 January 2015.
- ↑ Caballero-Nieves, S. M.; Nelan, E. P.; Gies, D. R.; Wallace, D. J.; Degioia-Eastwood, K.; Herrero, A.; Jao, W. -C.; Mason, B. D.; Massey, P.; Moffat, A. F. J.; Walborn, N. R. (2014). "A High Angular Resolution Survey of Massive Stars in Cygnus Ob2: Results from Thehubble Space Telescopefine Guidance Sensors". The Astronomical Journal 147 (2): 40. doi:10.1088/0004-6256/147/2/40.
- ↑ Prinja, R. K.; Massa, D. L. (2010). "Signature of wide-spread clumping in B supergiant winds". Astronomy and Astrophysics 521: L55. doi:10.1051/0004-6361/201015252.
- ↑ Gray, D. F. (2010). "PHOTOSPHERIC VARIATIONS OF THE SUPERGIANT γ Cyg". The Astronomical Journal 140 (5): 1329. doi:10.1088/0004-6256/140/5/1329.
- ↑ 15.0 15.1 Nazé, Y. (2009). "Hot stars observed by XMM-Newton". Astronomy and Astrophysics 506 (2): 1055. doi:10.1051/0004-6361/200912659.
- ↑ Lyubimkov, L. S. et al. (2010). "Accurate fundamental parameters for A-, F- and G-type Supergiants in the solar neighbourhood". Monthly Notices of the Royal Astronomical Society 402 (2): 1369–1379. arXiv:0911.1335. Bibcode:2010MNRAS.402.1369L. doi:10.1111/j.1365-2966.2009.15979.x.
- ↑ Gray, R. O.; Corbally, C. J.; Garrison, R. F.; McFadden, M. T.; Robinson, P. E. (2003). "Contributions to the Nearby Stars (NStars) Project: Spectroscopy of Stars Earlier than M0 within 40 Parsecs: The Northern Sample. I". The Astronomical Journal 126 (4): 2048. doi:10.1086/378365.
- ↑ Cenarro, A. J.; Peletier, R. F.; Sanchez-Blazquez, P.; Selam, S. O.; Toloba, E.; Cardiel, N.; Falcon-Barroso, J.; Gorgas, J.; Jimenez-Vicente, J.; Vazdekis, A. (2007). "Medium-resolution Isaac Newton Telescope library of empirical spectra - II. The stellar atmospheric parameters". Monthly Notices of the Royal Astronomical Society 374 (2): 664. doi:10.1111/j.1365-2966.2006.11196.x.
- ↑ Sion, Edward M.; Holberg, J. B.; Oswalt, Terry D.; McCook, George P.; Wasatonic, Richard (2009). "The White Dwarfs Within 20 Parsecs of the Sun: Kinematics and Statistics". The Astronomical Journal 138 (6): 1681–1689. arXiv:0910.1288. Bibcode:2009AJ....138.1681S. doi:10.1088/0004-6256/138/6/1681.
- ↑ SkyTonight: The Spectral Types of Stars
- ↑ 22.0 22.1 22.2 22.3 22.4 22.5 22.6 22.7 22.8 22.9 22.10 Allen, J. S. "The Classification of Stellar Spectra". UCL Department of Physics and Astronomy: Astrophysics Group. Retrieved 1 January 2014.
- ↑ 23.0 23.1 Pismis 24-1: The Stellar Upper Mass Limit Preserved, J. Maíz Apellániz et al. 2006
- ↑ 24.0 24.1 Spectroscopic study of the N159/N160 complex in the Large Magellanic Cloud, Cecilia Fariña et al. 2009
- ↑ Early-type stars in the core of the young open cluster Westerlund2, G.Rauw et al. 2006
- ↑ 26.0 26.1 26.2 26.3 26.4 26.5 26.6 Physical Properties of Wolf–Rayet Stars, Crowther, Paul A., 2007
- ↑ Rountree Lesh, J. (1968). "The Kinematics of the Gould Belt: An Expanding Group?". The Astrophysical Journal Supplement Series 17: 371. doi:10.1086/190179.
- ↑ Andrew Hamilton. "What color is the sun?". Retrieved 2012-11-15.
- ↑ Analyse spectrale de la lumière de quelques étoiles, et nouvelles observations sur les taches solaires, P. Secchi, Comptes Rendus des Séances de l'Académie des Sciences 63 (July–December 1866), pp. 364–368.
- ↑ Nouvelles recherches sur l'analyse spectrale de la lumière des étoiles, P. Secchi, Comptes Rendus des Séances de l'Académie des Sciences 63 (July–December 1866), pp. 621–628.
- ↑ pp. 60, 134, The Analysis of Starlight: One Hundred and Fifty Years of Astronomical Spectroscopy, J. B. Hearnshaw, Cambridge, UK: Cambridge University Press, 1986, ISBN 0-521-25548-1.
- ↑ pp. 62–63, Hearnshaw 1986.
- ↑ p. 60, Hearnshaw 1986.
- ↑ Classification of Stellar Spectra: Some History
- ↑ pp. 62–63, Stars and Their Spectra: An Introduction to the Spectral Sequence, James B. Kaler, Cambridge: Cambridge University Press, 1997, ISBN 0-521-58570-8.
- ↑ p. 60–63, Hearnshaw 1986; pp. 623–625, Secchi 1866.
- ↑ 37.0 37.1 The Draper Catalogue of stellar spectra photographed with the 8-inch Bache telescope as a part of the Henry Draper memorial, Edward C. Pickering, Annals of Harvard College Observatory 27 (1890), Bibcode: 1890AnHar..27....1P. See in particular pp. 1–4.
- ↑ 38.0 38.1 pp. 106–108, Hearnshaw 1986.
- ↑ pp. 111–112, Hearnshaw 1986.
- ↑ Spectra of bright stars photographed with the 11-inch Draper Telescope as part of the Henry Draper Memorial, Antonia C. Maury and Edward C. Pickering, Annals of Harvard College Observatory 28, part 1 (1897), pp. 1–128, Bibcode: 1897AnHar..28....1M; see in particular Table I.
- ↑ Spectra of bright southern stars photographed with the 13-inch Boyden telescope as part of the Henry Draper Memorial, Annie J. Cannon and Edward C. Pickering, Annals of Harvard College Observatory 28, part 2 (1901), pp. 129–263, Bibcode: 1901AnHar..28..129C; see in particular pp. 139–143.
- ↑ pp. 117–119, Hearnshaw 1986.
- ↑ Classification of 1,688 southern stars by means of their spectra, Annie Jump Cannon and Edward C. Pickering, Annals of Harvard College Observatory 56, #5 (1912), pp. 115–164, Bibcode: 1912AnHar..56..115C.
- ↑ pp. 121–122, Hearnshaw 1986.
- ↑ Relations Between the Spectra and Other Characteristics of the Stars, Henry Norris Russell, Popular Astronomy 22, no. 5, (May 1914), pp. 275–294, Bibcode: 1914PA.....22..275R, in particular p.277
- ↑ Saha, M. N.; On a Physical Theory of Stellar Spectra, Proceedings of the Royal Society of London, Series A, Volume 99, Issue 697 (May 1921), pp. 135–153
- ↑ Payne, C. H.; Stellar Atmospheres; A Contribution to the Observational Study of High Temperature in the Reversing Layers of Stars, Ph. D. Thesis, Radcliffe College, 1925
- ↑ An atlas of stellar spectra, with an outline of spectral classification, W. W. Morgan, P. C. Keenan and E. Kellman, Chicago: The University of Chicago Press, 1943.
- ↑ Walborn, N. R. (1971). "Some Spectroscopic Characteristics of the OB Stars: An Investigation of the Space Distribution of Certain OB Stars and the Reference Frame of the Classification". The Astrophysical Journal Supplement Series 23: 257. doi:10.1086/190239.
- ↑ Revised MK Spectral Atlas for Stars Earlier than the Sun, W. W. Morgan, H. A. Abt, and J. W. Tapscott, Yerkes Observatory, University of Chicago and Kitt Peak National Observatory, 1978.
- ↑ A New Spectral Classification System for the Earliest O Stars: Definition of Type O2, Nolan R. Walborn et al., The Astronomical Journal 123, #5 (May 2002), pp. 2754–2771, doi:10.1086/339831, Bibcode: 2002AJ....123.2754W.
- ↑ 52.0 52.1 52.2 52.3 52.4 52.5 52.6 Garrison, R. F. (1994). "A Hierarchy of Standards for the MK Process". Astronomical Society of the Pacific. Bibcode:1994ASPC...60....3G.
- ↑ "SIMBAD Object query : CCDM J02319+8915". Centre de Données astronomiques de Strasbourg. Retrieved 2010-06-10.
- ↑ Checking the yellow evolutionary void. Three evolutionary critical Hypergiants: HD 33579, HR 8752 & IRC +10420
- ↑ "On a cosmological timescale, The Earth's period of habitability is nearly over | International Space Fellowship". Spacefellowship.com. Retrieved 2012-05-22.
- ↑ 56.0 56.1 Stars as Cool as the Human Body
- ↑ "Galactic refurbishment". www.spacetelescope.org. ESA/Hubble. Retrieved 29 April 2015.
- ↑ Figer, Donald F.; McLean, Ian S.; Najarro, Francisco (1997). "AK‐Band Spectral Atlas of Wolf‐Rayet Stars". The Astrophysical Journal 486: 420. doi:10.1086/304488.
- ↑ Bibcode: 1995A&A...295...75K
- ↑ Tinkler, C. M.; Lamers, H. J. G. L. M. (2002). "Mass-loss rates of H-rich central stars of planetary nebulae as distance indicators?". Astronomy and Astrophysics 384 (3): 987. doi:10.1051/0004-6361:20020061.
- ↑ Miszalski, B.; Crowther, P. A.; De Marco, O.; Köppen, J.; Moffat, A. F. J.; Acker, A.; Hillwig, T. C. (2012). "IC 4663: The first unambiguous \WN] Wolf-Rayet central star of a planetary nebula★". Monthly Notices of the Royal Astronomical Society 423: 934. doi:10.1111/j.1365-2966.2012.20929.x.
- ↑ 62.0 62.1 Multiwavelength Systematics of OB Spectra, Walborn, N. R., 2008
- ↑ Crowther, P. A.; Walborn, N. R. (2011). "Spectral classification of O2-3.5 If*/WN5-7 stars". Monthly Notices of the Royal Astronomical Society 416 (2): 1311. arXiv:1105.4757. Bibcode:2011MNRAS.416.1311C. doi:10.1111/j.1365-2966.2011.19129.x.
- ↑ Outstanding Issues in Our Understanding of L, T, and Y Dwarfs, J. D. Kirkpatrick, April 2007, arXiv:0704.1522. Accessed on line September 18, 2007.
- ↑ 65.0 65.1 Kirkpatrick, J. Davy; Reid, I. Neill; Liebert, James; Cutri, Roc M.; Nelson, Brant; Beichman, Charles A.; Dahn, Conard C.; Monet, David G.; Gizis, John E.; Skrutskie, Michael F. (July 10, 1999). "Dwarfs Cooler than M: the Definition of Spectral Type L Using Discovery from the 2-µ ALL-SKY Survey (2MASS)". The Astrophysical Journal (The University of Chicago Press) 519 (2): 802–833. Bibcode:1999ApJ...519..802K. doi:10.1086/307414.
- ↑ 66.0 66.1 Kirkpatrick, J. Davy (2005). "New Spectral Types L and T". Annual Reviews of Astronomy and Astrophysics (Annual Reviews) 43 (1): 195–246. Bibcode:2005ARA&A..43..195K. doi:10.1146/annurev.astro.42.053102.134017.
- ↑ Kirkpatrick, J. Davy; Barman, Travis S.; Burgasser, Adam J.; McGovern, Mark R.; McLean, Ian S.; Tinney, Christopher G.; Lowrance, Patrick J. (2006). "Discovery of a Very Young Field L Dwarf, 2MASS J01415823−4633574". The Astrophysical Journal 639 (2): 1120. doi:10.1086/499622.
- ↑ Ultra-cool Diminutive Star Weighs In
- ↑ LSR 1610-0040: The First Early-Type L Subdwarf, Lépine et al. 2003c
- ↑ Discovery of the brightest T dwarf in the northern hemisphere, 2007
- ↑ Discovery of the Y1 Dwarf WISE J064723.23-623235.5, J. Davy Kirkpatrick, Michael C. Cushing, Christopher R. Gelino, Charles A. Beichman, C. G. Tinney, Jacqueline K. Faherty, Adam Schneider, Gregory N. Mace, The Astrophysical Journal preprint (submitted 25 Aug 2013)
- ↑ Y-Spectral class for Ultra-Cool Dwarfs, N.R.Deacon and N.C.Hambly, 2006
- ↑ 73.0 73.1 Wehner, Mike (2011-08-24). "NASA spots chilled-out stars cooler than the human body | Technology News Blog – Yahoo! News Canada". Ca.news.yahoo.com. Retrieved 2012-05-22.
- ↑ 74.0 74.1 NASA spots chilled-out stars cooler than the human body
- ↑ NASA'S Wise Mission Discovers Coolest Class of Stars
- ↑ The minimum Jeans mass, brown dwarf companion IMF, and predictions for detection of Y-type dwarfs, B. Zuckerman and I. Song, Astronomy and Astrophysics 493, #3 (January 2009), pp. 1149–1154, doi:10.1051/0004-6361:200810038, Bibcode: 2009A&A...493.1149Z.
- ↑ 77.0 77.1 77.2 Distances, Luminosities, and Temperatures of the Coldest Known Substellar Objects, Trent J. Dupuy and Adam L. Kraus, Science Online (Sept 2013), doi:10.1126/science.1241917
- ↑ 78.0 78.1 78.2 The Physical Properties of Four ~600 K T Dwarfs, S. K. Leggett et al., The Astrophysical Journal 695, #2 (April 2009), pp. 1517–1526, doi:10.1088/0004-637X/695/2/1517, Bibcode: 2009ApJ...695.1517L.
- ↑ CFBDS J005910.90-011401.3: reaching the T-Y brown dwarf transition?, P. Delorme et al., Astronomy and Astrophysics 482, #3 (May 2008), pp. 961–971, doi:10.1051/0004-6361:20079317, Bibcode: 2008A&A...482..961D.
- ↑ Exploring the substellar temperature regime down to ~550K, Ben Burningham et al., Monthly Notices of the Royal Astronomical Society 391, #1 (November 2008), pp. 320–333, doi:10.1111/j.1365-2966.2008.13885.x, Bibcode: 2008MNRAS.391..320B; see the abstract.
- ↑ European Southern Observatory. "A Very Cool Pair of Brown Dwarfs", 23 March 2011
- ↑ Bouigue, R. 1954, Annales d'Astrophysique, Vol. 17, p.104
- ↑ Spectral Atlas of Carbon Stars (Barnbaum+ 1996)
- ↑ Keenan, P. C. 1954 Astrophysical Journal, vol. 120, p.484
- ↑ A Determination of the Local Density of White Dwarf Stars, J. B. Holberg, Terry D. Oswalt and E. M. Sion, The Astrophysical Journal 571, #1 (May 2002), pp. 512–518.
- ↑ 86.0 86.1 86.2 86.3 A proposed new white dwarf spectral classification system, E. M. Sion, J. L. Greenstein, J. D. Landstreet, J. Liebert, H. L. Shipman, and G. A. Wegner, The Astrophysical Journal 269, #1 (June 1, 1983), pp. 253–257.
- ↑ C?rsico, A. H.; Althaus, L. G. (2004). "The rate of period change in pulsating DB-white dwarf stars". Astronomy and Astrophysics 428: 159. doi:10.1051/0004-6361:20041372.
- ↑ A Catalog of Spectroscopically Identified White Dwarfs, George P. McCook and Edward M. Sion, The Astrophysical Journal Supplement Series 121, #1 (March 1999), pp. 1–130.
- ↑ Physics of white dwarf stars, D. Koester and G. Chanmugam, Reports on Progress in Physics 53 (1990), pp. 837–915.
- ↑ White dwarfs, Gilles Fontaine and François Wesemael, in Encyclopedia of Astronomy and Astrophysics, ed. Paul Murdin, Bristol and Philadelphia: Institute of Physics Publishing and London, New York and Tokyo: Nature Publishing Group, 2001. ISBN 0-333-75088-8.
- ↑ 91.0 91.1 Mapping the Instability Domains of GW Vir Stars in the Effective Temperature-Surface Gravity Diagram, Quirion, P.-O., Fontaine, G., Brassard, P., Astrophysical Journal Supplement Series 171 (2007), pp. 219–248.
- ↑ §1, Detection of non-radial g-mode pulsations in the newly discovered PG 1159 star HE 1429–1209, T. Nagel and K. Werner, Astronomy and Astrophysics 426 (2004), pp. L45–L48.
- ↑ The Extent and Cause of the Pre-White Dwarf Instability Strip, M. S. O'Brien, Astrophysical Journal 532, #2 (April 2000), pp. 1078–1088.
- ↑ UV spectroscopy of the hybrid PG 1159-type central stars of the planetary nebulae NGC 7094 and Abell 43, Ziegler, M. et al. 2009
- ↑ Digital Demo Room Stellar Structure and Evolution Simulator(date unknown)
- ↑ 96.0 96.1 "Stars and Habitable Planets". Solstation.com. Retrieved 2012-05-22.
External links
- Libraries of stellar spectra, D. Montes, UCM
- Spectral Types for Hipparcos Catalogue Entries
- Stellar Spectral Classification, Richard O. Gray and Christopher J. Corbally
- Spectral models of stars, P. Coelho
- Merrifield, Michael; Bauer, Amanda; Häußler, Boris (2010). "Star Classification". Sixty Symbols. Brady Haran for the University of Nottingham.
| ||||||||||||||||||||||||||||||||||||||||||||||||||||||||||