St Helens South (UK Parliament constituency)
Coordinates: 53°26′53″N 2°43′52″W / 53.448°N 2.731°W
| St Helens South | |
|---|---|
|
Former Borough constituency for the House of Commons | |
|
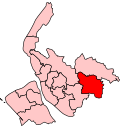
Boundary of St Helens South in Merseyside for the 2005 general election. | |
|
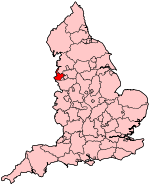
Location of Merseyside within England. | |
| County | Merseyside |
| 1983–2010 | |
| Number of members | One |
| Replaced by | St Helens South and Whiston |
| Created from | St Helens |
| European Parliament constituency | North West England |
St Helens South was a borough constituency represented in the House of Commons of the Parliament of the United Kingdom. It elected one Member of Parliament (MP) by the first past the post system of election.
Boundaries
The constituency was one of two covering the Metropolitan Borough of St Helens, the other being St Helens North. It contained the southern part of the borough including the town centre of St Helens, the south of the town, Clock Face and Rainhill.
Following recommendations made by the Boundary Commission for England, St Helens South was replaced with a new St Helens South and Whiston constituency, which will include three wards from Knowsley borough.
History
The forerunner seat had been represented by members of the Labour Party since 1935.
The constituency was formed in 1983, and was represented by Labour's Gerry Bermingham from then until he stood down in 2001. He was replaced by Shaun Woodward, who had defected from the Conservatives to Labour in December 1999. Woodward was deemed unlikely to retain his Witney constituency in Oxfordshire as a Labour candidate (it was subsequently won by David Cameron, now Leader of the Conservatives and Prime Minister of the United Kingdom), and was instead selected for this safe seat. Woodward has won all three elections however lost his position in the cabinet because of the Labour party defeat to the Liberal Democrat-Conservative coalition government in the 2010 General Election.
Members of Parliament
| Election | Member [1] | Party | |
|---|---|---|---|
| 1983 | Gerry Bermingham | Labour | |
| 2001 | Shaun Woodward | Labour | |
| 2010 | Constituency abolished: see St Helens South and Whiston | ||
Elections
Elections in the 2000s
| General Election 2005: St Helens South | |||||
|---|---|---|---|---|---|
| Party | Candidate | Votes | % | ±% | |
| Labour | Shaun Woodward | 19,345 | 54.5 | +4.8 | |
| Liberal Democrat | Brian Thomas Spencer | 10,036 | 28.3 | +5.2 | |
| Conservative | Una Riley | 4,602 | 13.0 | −0.8 | |
| UKIP | Malcolm Nightingale | 847 | 2.4 | +1.4 | |
| Socialist Labour | Michael Perry | 643 | 1.8 | −2.6 | |
| Majority | 9,309 | 26.2 | |||
| Turnout | 35,473 | 53.4 | +2.0 | ||
| Labour hold | Swing | −0.2 | |||
| General Election 2001: St Helens South | |||||
|---|---|---|---|---|---|
| Party | Candidate | Votes | % | ±% | |
| Labour | Shaun Woodward | 16,799 | 49.7 | −18.9 | |
| Liberal Democrat | Brian Thomas Spencer | 7,814 | 23.1 | +9.7 | |
| Conservative | Lee Rotherham | 4,675 | 13.8 | −1.1 | |
| Socialist Alliance | Neil Thompson | 2,325 | 6.9 | N/A | |
| Socialist Labour | Mike Roy Perry | 1,504 | 4.4 | N/A | |
| UKIP | Bryan Hilton Slater | 336 | 1.0 | N/A | |
| Independent | Michael Murphy | 271 | 0.8 | N/A | |
| Independent | David Oswald Braid | 80 | 0.2 | N/A | |
| Majority | 8,985 | 26.6 | |||
| Turnout | 33,804 | 51.4 | −15.1 | ||
| Labour hold | Swing | ||||
Elections in the 1990s
| General Election 1997: St Helens South | |||||
|---|---|---|---|---|---|
| Party | Candidate | Votes | % | ±% | |
| Labour | Gerry Bermingham | 30,367 | 68.6 | +7.6 | |
| Conservative | Mrs. Mary E.J.M Russell | 6,628 | 15.0 | −9.5 | |
| Liberal Democrat | Brian Thomas Spencer | 5,919 | 13.4 | −0.5 | |
| Referendum Party | William F.A.P. Holdaway | 1,165 | 2.6 | N/A | |
| Natural Law | Dr. Harriet S. Jump | 179 | 0.4 | −0.2 | |
| Majority | 23,739 | 53.6 | |||
| Turnout | 44,258 | 66.5 | |||
| Labour hold | Swing | ||||
| General Election 1992: St. Helens South[2] | |||||
|---|---|---|---|---|---|
| Party | Candidate | Votes | % | ±% | |
| Labour | Gerry Bermingham | 30,391 | 61.0 | +6.4 | |
| Conservative | Mrs Patricia M. Buzzard | 12,182 | 24.5 | −2.3 | |
| Liberal Democrat | Brian Thomas Spencer | 6,933 | 13.9 | −4.8 | |
| Natural Law | Dr. Harriet S. Jump | 295 | 0.6 | N/A | |
| Majority | 18,209 | 36.6 | +8.7 | ||
| Turnout | 49,801 | 73.8 | +2.5 | ||
| Labour hold | Swing | +4.3 | |||
Elections in the 1980s
| General Election 1987: St Helens South | |||||
|---|---|---|---|---|---|
| Party | Candidate | Votes | % | ±% | |
| Labour | Gerry Bermingham | 27,027 | 54.6 | +7.7 | |
| Conservative | John Anthony Brown | 13,226 | 26.7 | −0.4 | |
| Social Democratic | Philip James Briers | 9,252 | 18.7 | −3.7 | |
| Majority | 13,801 | 27.9 | |||
| Turnout | 49,505 | 71.3 | +4.0 | ||
| Labour hold | Swing | +4.1 | |||
| General Election 1983: St Helens South | |||||
|---|---|---|---|---|---|
| Party | Candidate | Votes | % | ±% | |
| Labour | Gerry Bermingham | 22,906 | 46.9 | N/A | |
| Conservative | R.G. Bull | 13,244 | 27.1 | N/A | |
| Social Democratic | P.J. Briers | 10,939 | 22.2 | N/A | |
| Independent | M.H. Davies | 1,780 | 3.6 | N/A | |
| Majority | 9,622 | 19.8 | N/A | ||
| Turnout | 48,869 | 70.6 | N/A | ||
| Labour win (new seat) | |||||
See also
Notes and references
- ↑ Leigh Rayment's Historical List of MPs – Constituencies beginning with "S" (part 1)
- ↑ "UK General Election results April 1992". Richard Kimber's Political Science Resources. Politics Resources. 9 April 1992. Retrieved 2010-12-06.