South Wales West (National Assembly for Wales electoral region)
| Welsh Assembly electoral region | |
|---|---|
 | |
| Created 1999 | |
| Current representation | |
| Labour | 7 AMs |
| Plaid Cymru | 2 AMs |
| Conservative | 1 AM |
| Liberal Democrats | 1 AM |
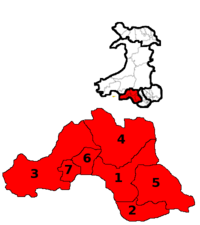
| Constituencies 1. Aberavon 2. Bridgend 3. Gower 4. Neath 5. Ogmore 6. Swansea East 7. Swansea West | |
| Preserved counties Mid Glamorgan (part) South Glamorgan (part) West Glamorgan | |
South Wales West is an electoral region of the National Assembly for Wales, consisting of seven constituencies. The region elects 11 members, seven directly elected constituency members and four additional members. The electoral region was first used in 1999, when the Assembly for Wales was created.
Each constituency elects one Assembly Member by the first past the post electoral system, and the region as a whole elects four additional or top-up Assembly Members, to create a degree of proportional representation. The additional member seats are allocated from closed lists by the d'Hondt method, with constituency results being taken into account in the allocation.
County boundaries
The region covers the whole of the preserved county of West Glamorgan, part of the preserved county of Mid Glamorgan and part of the preserved county of South Glamorgan. The rest of Mid Glamorgan is divided between the South Wales Central and South Wales East electoral regions. The rest of South Glamorgan is within the South Wales Central region.
Electoral region profile
The region is predominantly urban, taking in Wales' second largest city, Swansea, as well as working-class towns such as Neath and Port Talbot. However there are also rural regions, such as on the Gower peninsula. A higher proportion of the local populace are Welsh speakers than in the neighbouring region, South Wales Central.
Constituencies
The seven constituencies have the names and boundaries of constituencies of the House of Commons of the Parliament of the United Kingdom (Westminster):
| Constituency | 2011 Members | Preserved counties | |
|---|---|---|---|
| Aberavon | David Rees Labour |
Entirely within West Glamorgan | |
| Bridgend | Carwyn Jones Labour |
Partly Mid Glamorgan, partly South Glamorgan | |
| Gower | Edwina Hart Labour |
Entirely within West Glamorgan | |
| Neath | Gwenda Thomas Labour |
Entirely within West Glamorgan | |
| Ogmore | Janice Gregory Labour |
Partly Mid Glamorgan, partly South Glamorgan | |
| Swansea East | Mike Hedges Labour |
Entirely within West Glamorgan | |
| Swansea West | Julie James Labour |
Entirely within West Glamorgan | |
2011 Welsh Assembly election additional members
| Party | Constituency Seats | List Votes (vote %) | D'Hondt Entitlement | Additional Members Elected | Total Members Elected | Deviation from D'Hondt Entitlement | |
|---|---|---|---|---|---|---|---|
| Labour | 7 | 71,766 (46.5%) | 6 | 0 | 7 | +1 | |
| Conservative | 0 | 27,457 (17.8%) | 2 | 2 | 2 | 0 | |
| Plaid Cymru | 0 | 21,258 (13.8%) | 2 | 1 | 1 | -1 | |
| Liberal Democrats | 0 | 10,683 (6.9%) | 1 | 1 | 1 | 0 | |
| UKIP | 0 | 6,619 (4.3%) | 0 | 0 | 0 | 0 | |
| Socialist Labour | 0 | 5,057 (3.3%) | 0 | 0 | 0 | 0 | |
| BNP | 0 | 4,714 (3.1%) | 0 | 0 | 0 | 0 | |
| Green | 0 | 3,952 (2.6%) | 0 | 0 | 0 | 0 | |
| Welsh Christian | 0 | 1,602 (1.0%) | 0 | 0 | 0 | 0 | |
| TUSC | 0 | 809 (0.5%) | 0 | 0 | 0 | 0 | |
| Communist | 0 | 464 (0.3%) | 0 | 0 | 0 | 0 | |
2007 Welsh Assembly election additional members[1]
| Party | Constituency Seats | List Votes (vote %) | D'Hondt Entitlement | Additional Members Elected | Total Members Elected | Deviation from D'Hondt Entitlement | |
|---|---|---|---|---|---|---|---|
| Labour | 7 | 58,374 (35.8%) | 6 | 0 | 7 | +1 | |
| Plaid Cymru | 0 | 28,819 (17.7%) | 2 | 2 | 2 | 0 | |
| Conservative | 0 | 26,119 (16.1%) | 2 | 1 | 1 | -1 | |
| Liberal Democrats | 0 | 20,226 (12.4%) | 1 | 1 | 1 | 0 | |
| BNP | 0 | 8,993 (5.5%) | 0 | 0 | 0 | 0 | |
| Green | 0 | 6,130 (3.8%) | 0 | 0 | 0 | 0 | |
| UKIP | 0 | 5,914 (3.6%) | 0 | 0 | 0 | 0 | |
| Socialist Labour | 0 | 2,367 (1.5%) | 0 | 0 | 0 | 0 | |
| Welsh Christian | 0 | 1,685 (1.0%) | 0 | 0 | 0 | 0 | |
| Independent | 0 | 1,186 (0.7%) | 0 | 0 | 0 | 0 | |
| Socialist Alternative | 0 | 1,027 (0.6%) | 0 | 0 | 0 | 0 | |
| Respect | 0 | 713 (0.4%) | 0 | 0 | 0 | 0 | |
| Independent Conservative | 0 | 582 (0.4%) | 0 | 0 | 0 | 0 | |
| Communist | 0 | 546 (0.3%) | 0 | 0 | 0 | 0 | |
| Christian Peoples | 0 | 393 (0.2%) | 0 | 0 | 0 | 0 | |
2003 Welsh Assembly election additional members [2]
| Party | Constituency Seats | List Votes (vote %) | D'Hondt Entitlement | Additional Members Elected | Total Members Elected | Deviation from D'Hondt Entitlement | |
|---|---|---|---|---|---|---|---|
| Labour | 7 | 58,066 (41.61%) | 7 | 0 | 7 | 0 | |
| Plaid Cymru | 0 | 24,799 (17.77%) | 2 | 2 | 2 | 0 | |
| Conservative | 0 | 20,981 (15.03%) | 1 | 1 | 1 | 0 | |
| Liberal Democrats | 0 | 17,746 (12.72%) | 1 | 1 | 1 | 0 | |
| Green | 0 | 6,696 (4.80%) | 0 | 0 | 0 | 0 | |
| UKIP | 0 | 6,113 (4.38%) | 0 | 0 | 0 | 0 | |
| Socialist Labour | 0 | 3,446 (2.47%) | 0 | 0 | 0 | 0 | |
| Cymru Annibynnol | 0 | 1,346 (0.96%) | 0 | 0 | 0 | 0 | |
| ProLife Alliance | 0 | 355 (0.25%) | 0 | 0 | 0 | 0 | |
1999 Welsh Assembly election additional members [3]
| Party | Constituency Seats | List Votes (vote %) | D'Hondt Entitlement | Additional Members Elected | Total Members Elected | Deviation from D'Hondt Entitlement | |
|---|---|---|---|---|---|---|---|
| Labour | 7 | 70,625 (41.79%) | 5 | 0 | 7 | +2 | |
| Plaid Cymru | 0 | 50,757 (30.04%) | 4 | 2 | 2 | -2 | |
| Conservative | 0 | 20,993 (12.42%) | 1 | 1 | 1 | 0 | |
| Liberal Democrats | 0 | 18,527 (10.96%) | 1 | 1 | 1 | 0 | |
| Green | 0 | 4,082 (2.42%) | 0 | 0 | 0 | 0 | |
| People's Representative | 0 | 2,074 (1.23%) | 0 | 0 | 0 | 0 | |
| Socialist Alliance | 0 | 1,257 (0.74%) | 0 | 0 | 0 | 0 | |
| Natural Law | 0 | 676 (0.40%) | 0 | 0 | 0 | 0 | |
Notes
| ||||||||||||||||||||||