South Tyneside Council election, 2012
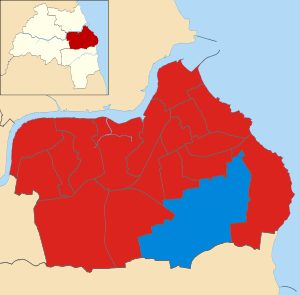
Map of the results of the 2012 South Tyneside council election.
Labour in red and
Conservative in blue.
The 2012 South Tyneside Council election took place on 3 May 2012 to elect members of South Tyneside Metropolitan Borough Council in England.[1] This was on the same day as other United Kingdom local elections, 2012. One third (18) of the seats were being contested, of which Labour won 17, and the Conservatives one.
New make-up of the council
Ward results
An asterisk denotes an incumbent.
Beacon & Bents ward
| Beacon & Bents |
| Party |
Candidate |
Votes |
% |
±% |
|
Labour |
John Anglin |
1,120 |
43.48 |
+11.03 |
|
Independent |
Ahmed Khan* |
917 |
35.60 |
−11.56 |
|
Conservative |
Ali Hayder |
173 |
6.72 |
+1.42 |
|
Independent |
Phil Brown |
147 |
5.71 |
N/A |
|
BNP |
James Hills |
123 |
4.77 |
−4.30 |
|
Liberal |
Ashleigh Brewer |
50 |
1.94 |
N/A |
|
Independent |
Siamak Kaikavoosi |
46 |
1.79 |
N/A |
| Majority |
203 |
7.88 |
|
| Turnout |
2,576 |
36.97 |
−6.41 |
|
Labour gain from Independent |
Swing |
|
|
Bede ward
| Bede |
| Party |
Candidate |
Votes |
% |
±% |
|
Labour |
Margaret Peacock |
922 |
47.53 |
+2.84 |
|
Independent |
Lee Hughes |
842 |
43.40 |
N/A |
|
Green |
Tony Gair |
95 |
4.90 |
N/A |
|
Conservative |
Oliver Wallhead |
81 |
4.18 |
−3.98 |
| Majority |
80 |
4.12 |
|
| Turnout |
1,945 |
32.55 |
−5.85 |
|
Labour hold |
Swing |
|
|
Biddick & All Saints ward
| Biddick & All Saints |
| Party |
Candidate |
Votes |
% |
±% |
|
Labour |
Anne Walsh* |
1,193 |
67.40 |
+31.60 |
|
Independent |
Kraig White |
316 |
17.85 |
N/A |
|
BNP |
Donna Watson |
107 |
6.01 |
−2.65 |
|
Conservative |
Brian Gilchrist |
78 |
4.41 |
−2.11 |
|
Liberal |
David Selby |
76 |
4.29 |
N/A |
| Majority |
877 |
49.55 |
|
| Turnout |
1,778 |
28.01 |
−5.18 |
|
Labour hold |
Swing |
|
|
Boldon Colliery ward
| Boldon Colliery |
| Party |
Candidate |
Votes |
% |
±% |
|
Labour |
Joanne Bell* |
1,534 |
61.38 |
+15.04 |
|
Independent |
Ian Diamond |
647 |
25.89 |
N/A |
|
Conservative |
Stewart Hay |
203 |
8.12 |
−8.03 |
|
BNP |
Ileene Gilchrist |
115 |
4.60 |
−4.73 |
| Majority |
887 |
35.49 |
|
| Turnout |
2,507 |
34.15 |
−3.44 |
|
Labour hold |
Swing |
|
|
Cleadon & East Boldon ward
Cleadon Park ward
| Cleadon Park |
| Party |
Candidate |
Votes |
% |
±% |
|
Labour |
Alexander Donaldson* |
820 |
45.89 |
+7.59 |
|
Independent |
June Elsom |
799 |
44.71 |
N/A |
|
Conservative |
Quintin Smith |
168 |
9.40 |
−6.39 |
| Majority |
21 |
1.18 |
|
| Turnout |
1,793 |
33.60 |
−5.09 |
|
Labour hold |
Swing |
|
|
Fellgate & Hedworth ward
| Fellgate & Hedworth |
| Party |
Candidate |
Votes |
% |
±% |
|
Labour |
Alan Smith |
1,226 |
55.50 |
+7.23 |
|
Independent |
Geraldine White |
786 |
35.58 |
N/A |
|
BNP |
Maureen Scott |
83 |
3.76 |
N/A |
|
Conservative |
Ian Armstrong |
81 |
3.67 |
−4.66 |
|
Liberal |
Andrew Cotton |
33 |
1.49 |
N/A |
| Majority |
440 |
19.89 |
|
| Turnout |
2,212 |
37.49 |
−4.00 |
|
Labour hold |
Swing |
|
|
Harton ward
Hebburn North ward
In 2008, Joe Abbott stood, and won, in this ward as a Liberal Democrat candidate.
| Hebburn North |
| Party |
Candidate |
Votes |
% |
±% |
|
Labour |
Mary Butler |
972 |
48.92 |
+24.06 |
|
Independent |
Joe Abbott* |
771 |
38.80 |
−7.22 |
|
BNP |
Martin Vaughan |
184 |
9.26 |
−7.73 |
|
Conservative |
David Fettis |
60 |
3.02 |
−1.37 |
| Majority |
201 |
10.12 |
|
| Turnout |
1,988 |
30.24 |
−7.18 |
|
Labour gain from Liberal Democrat |
Swing |
|
|
Hebburn South ward
| Hebburn South |
| Party |
Candidate |
Votes |
% |
±% |
|
Labour |
John McCabe* |
1,877 |
86.58 |
+42.14 |
|
Conservative |
John Coe |
291 |
13.42 |
+6.50 |
| Majority |
1,586 |
73.15 |
|
| Turnout |
2,193 |
36.00 |
−8.51 |
|
Labour hold |
Swing |
|
|
Horsley Hill ward
| Horsley Hill |
| Party |
Candidate |
Votes |
% |
±% |
|
Labour |
Mark Walsh |
1,407 |
53.28 |
+19.23 |
|
Independent |
Gordon Finch |
959 |
36.31 |
−2.53 |
|
Conservative |
Ross Huartt |
204 |
7.72 |
−6.60 |
|
Liberal |
Joseph Stephenson |
71 |
2.69 |
N/A |
| Majority |
448 |
19.96 |
|
| Turnout |
2,650 |
37.84 |
−6.73 |
|
Labour gain from Independent |
Swing |
|
|
Monkton ward
| Monkton |
| Party |
Candidate |
Votes |
% |
±% |
|
Labour |
Melanie Cartwright |
1,154 |
56.35 |
+23.59 |
|
Independent |
John Hodgson |
763 |
37.26 |
+0.33 |
|
Conservative |
James Milburn |
131 |
6.40 |
−0.97 |
| Majority |
391 |
19.09 |
|
| Turnout |
2,060 |
32.10 |
−8.58 |
|
Labour gain from Independent |
Swing |
|
|
Primrose ward
| Primrose |
| Party |
Candidate |
Votes |
% |
±% |
|
Labour |
Jim Perry* |
1,284 |
75.26 |
−26.67 |
|
BNP |
George Gilchrist |
227 |
13.31 |
−19.62 |
|
Conservative |
David Ireland |
195 |
11.43 |
−7.04 |
| Majority |
1,057 |
61.96 |
|
| Turnout |
1,717 |
27.95 |
−5.30 |
|
Labour hold |
Swing |
|
|
Simonside & Rekendyke ward
| Simonside & Rekendyke |
| Party |
Candidate |
Votes |
% |
±% |
|
Labour |
Edward Malcolm* |
1,348 |
80.62 |
+32.15 |
|
Labour |
Lynne Proudlock |
1,262 |
75.48 |
+27.01 |
|
Liberal |
Melanie Baker |
265 |
15.85 |
N/A |
|
BNP |
Peter Foreman |
238 |
14.23 |
+1.99 |
|
Conservative |
George Smith |
231 |
13.82 |
+1.71 |
| Majority |
997 |
59.63 |
|
| Turnout |
1,858 |
29.14 |
−3.39 |
|
Labour hold |
Swing |
|
|
West Park ward
Westoe ward
| Westoe |
| Party |
Candidate |
Votes |
% |
±% |
|
Labour |
Sheila Stephenson |
1,013 |
47.25 |
+28.38 |
|
Independent |
Victor Thompson |
639 |
29.80 |
N/A |
|
Conservative |
Edward Russell |
265 |
12.36 |
+1.50 |
|
Progressives |
Paul Walker |
165 |
7.70 |
N/A |
|
Liberal |
Stephen Flower |
62 |
2.89 |
N/A |
| Majority |
374 |
17.44 |
|
| Turnout |
2,149 |
32.82 |
−8.79 |
|
Labour gain from Independent |
Swing |
|
|
Whitburn & Marsden ward
| Whitburn & Marsden |
| Party |
Candidate |
Votes |
% |
±% |
|
Labour |
Tracey Dixon* |
1,661 |
76.19 |
+25.42 |
|
Conservative |
Elizabeth Turnbull |
519 |
23.81 |
−10.03 |
| Majority |
1,142 |
52.39 |
|
| Turnout |
2,208 |
37.81 |
−4.07 |
|
Labour hold |
Swing |
|
|
Whiteleas ward
| Whiteleas |
| Party |
Candidate |
Votes |
% |
±% |
|
Labour |
Doreen Purvis |
1,098 |
56.26 |
+13.05 |
|
Independent |
John Haram* |
632 |
30.08 |
−12.06 |
|
BNP |
Christopher Thornton |
185 |
8.81 |
−1.42 |
|
Independent |
Robin Coombes |
124 |
5.90 |
N/A |
|
Conservative |
Christopher Taylor |
62 |
2.95 |
−5.47 |
| Majority |
466 |
22.18 |
|
| Turnout |
2,107 |
32.24 |
−3.76 |
|
Labour gain from Independent |
Swing |
|
|
References