South Shields (UK Parliament constituency)
Coordinates: 54°58′23″N 1°24′50″W / 54.973°N 1.414°W
| South Shields | |
|---|---|
|
Borough constituency for the House of Commons | |
|
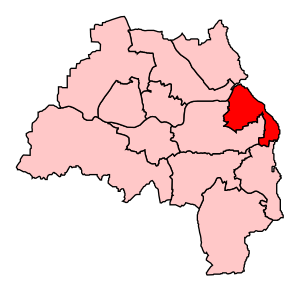
Boundary of South Shields in Tyne and Wear. | |
|
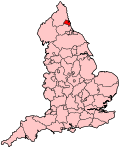
Location of Tyne and Wear within England. | |
| County | Tyne and Wear |
| Electorate | 63,765 (December 2010)[1] |
| Current constituency | |
| Created | 1832 |
| Member of parliament | Emma Lewell-Buck |
| Number of members | One |
| Created from | County Durham |
| Overlaps | |
| European Parliament constituency | North East England |
South Shields is a borough constituency represented in the House of Commons of the Parliament of the United Kingdom. It elects one Member of Parliament (MP) by the first past the post system of election. It has been represented by Emma Lewell-Buck of the Labour Party since 2013.
Boundaries
The current constituency covers the area of South Shields in the South Tyneside district of Tyne and Wear. Boundary changes at the 2010 general election transferred the community of Whitburn into the South Shields constituency from the neighbouring Jarrow seat.
Members of Parliament
The seat was held from 2001 to 2013 by David Miliband, who served as Foreign Secretary from 2007 until Labour's general election defeat of 2010. On 26 March 2013 Miliband announced his resignation from Parliament in order to take up a post as the head of the International Rescue Committee in New York City.[2]
| Election | Member[3] | Party | |
|---|---|---|---|
| 1832 | Robert Ingham | Whig | |
| 1841 | John Twizell Wawn | Whig | |
| 1852 | Robert Ingham | Whig | |
| 1868 | James Cochran Stevenson | Liberal | |
| 1895 | William Snowdon Robson, later Baron Robson | Liberal | |
| 1910 by-election | Russell Rea | Liberal | |
| 1916 by-election | Cecil Algernon Cochrane | Liberal | |
| 1918 by-election | Joseph Havelock Wilson CBE | Coalition Liberal and Trade Unionist | |
| 1922 | Edward Harney KC | Liberal | |
| 1929 | James Chuter Ede | Labour | |
| 1931 | Harcourt Johnstone | Liberal | |
| 1935 | James Chuter Ede | Labour | |
| 1964 | Arthur Blenkinsop | Labour | |
| 1979 | David G. Clark | Labour | |
| 2001 | David Miliband | Labour | |
| 2013 by-election | Emma Lewell-Buck | Labour | |
With two exceptions (Arthur Blenkinsop and Emma Lewell-Buck) every South Shields MP since 1929 has been a cabinet member at some point in their career. Two of them, Chuter Ede (Home Secretary) and Miliband (Foreign Secretary), have held one of the great offices of state while MP for South Shields. It is the only constituency in existence since the Great Reform Act of 1832 never to have elected a Conservative MP.[4]
Elections
| General Election 2015: South Shields | |||||
|---|---|---|---|---|---|
| Party | Candidate | Votes | % | ±% | |
| UKIP | Norman Dennis[5] | ||||
| Green | Shirley Ford[6] | ||||
| Independent | Lisa Nightingale | ||||
| Liberal Democrat | Gitanjalil (Gita) Gordon[7] | ||||
| Labour | Emma Lewell-Buck[8] | ||||
| Conservative | Robert Oliver | ||||
Elections 2001-15
| Election | Political result | Candidate | Party | Votes | % | ±% | ||
|---|---|---|---|---|---|---|---|---|
| By-election, May 2013 [9][10][11] Resignation of David Miliband Electorate: 62,979 Turnout: 24,780 (39.3%) −18.4 | Labour hold Majority: 6,505 (26.3%) −4.1 | Emma Lewell-Buck | Labour | 12,493 | 50.4 | −1.6 | ||
| Richard Elvin | UKIP | 5,988 | 24.2 | N/A | ||||
| Karen Allen | Conservative | 2,857 | 11.5 | −10.1 | ||||
| Ahmed Khan | Independent | 1,331 | 5.4 | N/A | ||||
| Phil Brown | Independent Socialist Party | 750 | 3.0 | N/A | ||||
| Lady Dorothy MacBeth Brookes | BNP | 711 | 2.9 | −3.6 | ||||
| Hugh Annand | Liberal Democrat | 352 | 1.4 | −12.8 | ||||
| Alan "Howling Laud" Hope | Monster Raving Loony | 197 | 0.8 | N/A | ||||
| Thomas Darwood | Independent | 57 | 0.2 | N/A | ||||
| General Election 2010 [12] Electorate: 64,084 Turnout: 36,518 (57.7%) +7.0 | Labour hold Majority: 11,109 (30.4%) −10.4 Swing: -6.4% from Lab to Con | David Miliband | Labour | 18,995 | 52.0 | -8.8 | ||
| Karen Allen | Conservative | 7,886 | 21.6 | +4.0 | ||||
| Stephen Psallidas | Liberal Democrat | 5,189 | 14.2 | -5.0 | ||||
| Donna Watson | BNP | 2,382 | 6.5 | N/A | ||||
| Shirley Ford | Green | 762 | 2.1 | N/A | ||||
| Siamak Kaikavoosi | Independent | 729 | 2.0 | N/A | ||||
| Victor Thompson | Independent | 316 | 0.9 | N/A | ||||
| Sam Navabi | Independent | 168 | 0.5 | N/A | ||||
| Roger Nettleship | Fight for an Anti-War Government | 91 | 0.2 | N/A | ||||
| General Election 2005 [13] Electorate: 59,330 Turnout: 30,206 (42.2%) −7.5 | Labour hold Majority: 12,312 (40.8%) −5.5 | David Miliband | Labour | 18,269 | 60.5 | −2.7 | ||
| Stephen Psallidas | Liberal Democrat | 5,957 | 19.7 | +2.9 | ||||
| Richard Lewis | Conservative | 5,207 | 17.2 | +0.3 | ||||
| Nader Afshari-Naderi | Independent | 773 | 2.6 | N/A | ||||
| General Election 2001 [14] Electorate: 61,285 Turnout: 30,448 (49.7%) −12.9 | Labour hold Majority: 14,090 (46.3%) −10.5 Swing: 5.3% from Con to Lab | David Miliband | Labour | 19,230 | 63.2 | −8.3 | ||
| Joanna Gardner | Conservative | 5,140 | 16.9 | +2.3 | ||||
| Marshall Grainger | Liberal Democrat | 5,127 | 16.8 | +8.0 | ||||
| Alan Hardy | UKIP | 689 | 2.3 | N/A | ||||
| Roger Nettleship | Independent | 262 | 0.9 | −0.1 | ||||
Elections 1970–1997
| Election | Political result | Candidate | Party | Votes | % | ±% | ||
|---|---|---|---|---|---|---|---|---|
| General Election, 1997 [14] Electorate: 62,324 Turnout: 38,978 (62.5%) −4.8 | Labour hold Majority: 22,153 (56.8%) +24.5 Swing: 12.2% from Con to Lab | David Clark | Labour | 27,834 | 71.4 | +11.6 | ||
| Mark Hoban | Conservative | 5,681 | 14.6 | −12.8 | ||||
| David Ord | Liberal Democrat | 3,429 | 8.8 | −4.0 | ||||
| Alan Lorriane | Referendum Party | 1,660 | 4.3 | N/A | ||||
| Ian Wilburn | Independent | 374 | 1.0 | N/A | ||||
| General Election, 1992 [15] Electorate: 59,392 Turnout: 41,619 (70.1%) −0.7 | Labour hold Majority: 13,477 (32.4%) +0.15 Swing: 0.1% from Con to Lab | David Clark | Labour | 24,876 | 59.8 | +1.9 | ||
| Jonathan L. Howard | Conservative | 11,399 | 27.4 | +1.7 | ||||
| Arthur Preece | Liberal Democrat | 5,344 | 12.8 | −2.6 | ||||
| General Election, 1987 [16] Electorate: 60,754 Turnout: 42,975 (70.7%) +4.5 | Labour hold Majority: 13,851 (32.2%) +16.6 Swing: 8.4% from Con to Lab | David Clark | Labour | 24,882 | 57.9 | +11.2 | ||
| Michael Fabricant | Conservative | 11,031 | 25.7 | −5.2 | ||||
| Margaret Mary Melling | Social Democratic | 6,654 | 15.5 | −7.2 | ||||
| Edward Grieves Dunn | Democrat | 408 | 1.0 | N/A | ||||
| General Election, 1983 [17] Electorate: 61,924 Turnout: 40,996 (66.2%) −5.0 | Labour hold Majority: 6,402 (15.6%) −10.5 Swing: 3.3% from Lab to Con | David Clark | Labour | 19,055 | 46.5 | −10.6 | ||
| P.J. Groves | Conservative | 15,551 | 30.1 | −0.1 | ||||
| P.J. Angus | Social Democratic | 9,288 | 22.7 | +10.7 | ||||
| General Election, 1979 [18] Electorate: 70,566 Turnout: 50,229 (71.2%) +6.5 | Labour hold Majority: 13,124 (26.1%) −5.4 Swing: 2.7% from Lab to Con | David Clark | Labour | 28,675 | 57.0 | +0.7 | ||
| R. Booth | Conservative | 15,551 | 31.0 | +6.1 | ||||
| L. Monger | Liberal | 6,003 | 12.0 | −5.3 | ||||
| General Election, October 1974 [19] Electorate: 72,584 Turnout: 46,976 (64.7%) −6.9 | Labour hold Majority: 14,825 (31.6%) +8.2 Swing: 4.1% from Con to Lab | Arthur Blenkinsop | Labour | 26,492 | 56.4 | −3.4 | ||
| N. S. Smith | Conservative | 11,667 | 24.8 | −11.6 | ||||
| L. Garbutt | Liberal | 8,106 | 17.3 | N/A | ||||
| W. Owen | National Front | 711 | 1.5 | −2.5 | ||||
| General Election, February 1974 [20] Electorate: 71,895 Turnout: 51,452 (71.6%) +4.8 | Labour hold Majority: 11,986 (23.3%) +3.0 Swing: 1.5% from Con to Lab | Arthur Blenkinsop | Labour | 30,740 | 58.8 | +0.4 | ||
| S. Smith | Conservative | 18,754 | 36.4 | −3.4 | ||||
| W. Owen | National Front | 1,958 | 3.8 | N/A | ||||
| General Election, 1970 [21] Electorate: 75,129 Turnout: 50,151 (66.8%) −1.7 | Labour hold Majority: 10,231 (20.4%) −9.0 Swing: 4.5% from Lab to Con | Arthur Blenkinsop | Labour | 30,191 | 60.2 | −4.5 | ||
| J. McKee | Conservative | 19,960 | 39.8 | +4.5 | ||||
Elections 1945–1966
| Election | Political result | Candidate | Party | Votes | % | ±% | ||
|---|---|---|---|---|---|---|---|---|
| General Election, 1966 [22] Electorate: 71,578 Turnout: 49,169 (68.7%) −5.4 | Labour hold Majority: 14,489 (29.5%) +4.7 Swing: 2.4% from Con to Lab | Arthur Blenkinsop | Labour | 31,829 | 64.7 | +9.6 | ||
| C. M. Dallas | Conservative | 17,340 | 35.3 | +4.9 | ||||
| General Election, 1964 [22] Electorate: 72,697 Turnout: 53,875 (74.1%) −0.3 | Labour hold Majority: 13,350 (24.8%) +8.9 Swing: 4.5% from Con to Lab | Arthur Blenkinsop | Labour | 29,694 | 55.1 | −2.8 | ||
| J. Chalmers | Conservative | 16,344 | 30.3 | −11.7 | ||||
| T. H. C. Wardlaw | Liberal | 7,837 | 14.6 | N/A | ||||
| General Election, 1959 [23] Electorate: 75,538 Turnout: 56,215 (74.4%) −2.8 | Labour hold Majority: 8,939 (15.9%) −3.4 Swing: 1.7% from Lab to Con | James Chuter Ede | Labour | 32,577 | 58.0 | −1.7 | ||
| J. Chalmers | Conservative | 23,638 | 42.0 | +1.7 | ||||
| General Election, 1955 [24] Electorate: 74,340 Turnout: 53,216 (71.6%) −9.3 | Labour hold Majority: 10,252 (19.3%) −3.0 Swing: 1.5% from Lab to Con | James Chuter Ede | Labour | 31,734 | 59.6 | +3.7 | ||
| J. Chalmers | Conservative | 21,482 | 40.4 | +6.9 | ||||
| General Election, 1951 [25] Electorate: 74,657 Turnout: 60,111 (80.5%) −1.2 | Labour hold Majority: 13,425 (22.3%) −7.3 Swing: 3.7% from Lab to Con | James Chuter Ede | Labour | 33,633 | 56.0 | +0.6 | ||
| J. Chalmers | Conservative | 20,208 | 33.6 | +6.8 | ||||
| C. J. Kitchell | Liberal | 6,270 | 10.4 | −5.5 | ||||
| General Election, 1950 [23] Electorate: 72,463 Turnout: 59,210 (81.7%) +8.6 | Labour hold Majority: 17,555 (29.7%) +10.8 Swing: 5.4% from Con to Lab | James Chuter Ede | Labour | 33,452 | 56.5 | −2.9 | ||
| John Chalmers | Conservative | 15,897 | 28.9 | −13.7 | ||||
| John George | Liberal | 9,446 | 16.0 | N/A | ||||
| F. O. Smith | Communist | 415 | 0.7 | N/A | ||||
| General Election, 1945 [26] Electorate: 51,599 Turnout: 37,706 (73.1%) −0.3 | Labour hold Majority: 7,114 (18.9%) +12.6 | James Chuter Ede | Labour | 22,410 | 59.4 | +11.3 | ||
| D. M. Parry | Liberal National | 15,296 | 40.6 | |||||
Elections in the 1930s
| General Election 1935: South Shields | |||||
|---|---|---|---|---|---|
| Party | Candidate | Votes | % | ±% | |
| Labour | James Chuter Ede | 22,031 | 48.16 | ||
| Liberal | Harcourt Johnstone | 12,932 | 29.27 | ||
| National Labour | Frederick Burden | 10,784 | 23.57 | ||
| Majority | 9,099 | 19.89 | |||
| Turnout | 72.79 | ||||
| Labour gain from Liberal | Swing | ||||
| General Election 1931: South Shields | |||||
|---|---|---|---|---|---|
| Party | Candidate | Votes | % | ±% | |
| Liberal | Harcourt Johnstone | 30,528 | 59.81 | ||
| Labour | James Chuter Ede | 20,512 | 40.19 | ||
| Majority | 10,016 | 19.62 | |||
| Turnout | 80.13 | ||||
| Liberal gain from Labour | Swing | ||||
Elections in the 1920s
| General Election 1929[27] | |||||
|---|---|---|---|---|---|
| Party | Candidate | Votes | % | ±% | |
| Labour | James Chuter Ede | 18,938 | 42.2 | +0.1 | |
| Liberal | Hon. Harold Burge Robson | 18,898 | 42.0 | ||
| Unionist | William Nunn | 7,110 | 15.8 | n/a | |
| Majority | 40 | 0.2 | |||
| Turnout | 72.9 | -2.4 | |||
| Labour gain from Liberal | Swing | ||||
| General Election 1924[27] | |||||
|---|---|---|---|---|---|
| Party | Candidate | Votes | % | ±% | |
| Liberal | Edward Harney | 23,171 | 57.9 | ||
| Labour | William Lawther | 16,852 | 42.1 | ||
| Majority | 6,319 | 15.8 | |||
| Turnout | 75.3 | ||||
| Liberal hold | Swing | ||||
| General Election 1923[27] | |||||
|---|---|---|---|---|---|
| Party | Candidate | Votes | % | ±% | |
| Liberal | Edward Harney | 22,912 | 59.3 | +19.5 | |
| Labour | William Lawther | 15,717 | 40.7 | +1.0 | |
| Majority | 7,195 | 18.6 | +18.5 | ||
| Turnout | 73.5 | ||||
| Liberal hold | Swing | +9.5 | |||
| General Election 1922[27] | |||||
|---|---|---|---|---|---|
| Party | Candidate | Votes | % | ±% | |
| Liberal | Edward Harney | 15,760 | 39.8 | n/a | |
| Labour | William Lawther | 15,735 | 39.7 | +14.9 | |
| National Liberal | Joseph Havelock Wilson | 8,121 | 20.5 | -54.7 | |
| Majority | 25 | 0.1 | 50.5 | ||
| Turnout | 76.2 | +24.9 | |||
| Liberal hold | Swing | ||||
Elections in the 1910s
| General Election 1918[27] | |||||
|---|---|---|---|---|---|
| Party | Candidate | Votes | % | ±% | |
| Liberal |
|
19,514 | 75.2 | N/A | |
| Labour | George John Rowe | 6,425 | 24.8 | N/A | |
| Majority | 13,089 | 50.4 | N/A | ||
| Turnout | 51.3 | N/A | |||
| Liberal hold | Swing | N/A | |||
- endorsed by Coalition government
| South Shields by-election, 1918 | |||||
|---|---|---|---|---|---|
| Party | Candidate | Votes | % | ±% | |
| Liberal | Joseph Havelock Wilson | Unopposed | N/A | N/A | |
| Liberal hold | Swing | N/A | |||
| South Shields by-election, 1916 | |||||
|---|---|---|---|---|---|
| Party | Candidate | Votes | % | ±% | |
| Liberal | Cecil Cochrane | Unopposed | N/A | N/A | |
| Liberal hold | Swing | N/A | |||
| General Election December 1910 South Shields[28] | |||||
|---|---|---|---|---|---|
| Party | Candidate | Votes | % | ±% | |
| Liberal | Rt Hon. Russell Rea | unopposed | n/a | n/a | |
| Liberal hold | Swing | n/a | |||
| South Shields by-election, 1910[28] | |||||
|---|---|---|---|---|---|
| Party | Candidate | Votes | % | ±% | |
| Liberal | Rt Hon. Russell Rea | Unopposed | N/A | N/A | |
| Liberal hold | Swing | N/A | |||
| General Election January 1910 South Shields[28] | |||||
|---|---|---|---|---|---|
| Party | Candidate | Votes | % | ±% | |
| Liberal | Rt Hon. Sir William Snowdon Robson | 9,090 | 65.2 | -8.7 | |
| Liberal Unionist | Roland Edmund Lomax Vaughan Williams | 4,854 | 34.8 | +8.7 | |
| Majority | -17.4 | ||||
| Turnout | 76.1 | +3.5 | |||
| Liberal hold | Swing | -8.7 | |||
Elections in the 1900s
| General Election 1906 South Shields[28] | |||||
|---|---|---|---|---|---|
| Party | Candidate | Votes | % | ±% | |
| Liberal | Rt Hon. Sir William Snowdon Robson | 9,717 | 73.9 | ||
| Liberal Unionist | A R Chamberlayne | 3,431 | 26.1 | ||
| Majority | 6,286 | 47.8 | +19.2 | ||
| Turnout | 72.6 | ||||
| Liberal hold | Swing | ||||
| General Election 1900 South Shields[28] | |||||
|---|---|---|---|---|---|
| Party | Candidate | Votes | % | ±% | |
| Liberal | William Snowdon Robson | 7,417 | 64.3 | ||
| Conservative | R Readhead | 4,119 | 35.7 | ||
| Majority | 3,298 | 28.6 | |||
| Turnout | 72.0 | ||||
| Liberal hold | Swing | ||||
See also
References
- ↑ "Electorate Figures - Boundary Commission for England". 2011 Electorate Figures. Boundary Commission for England. 4 March 2011. Retrieved 13 March 2011.
- ↑ "David Miliband to step down as MP". BBC News. 26 March 2013. Retrieved 26 March 2013.
- ↑ Leigh Rayment's Historical List of MPs – Constituencies beginning with "S" (part 4)
- ↑ http://davidmiliband.net/south-shields/
- ↑ http://ukpollingreport.co.uk/2015guide/southshields/
- ↑ http://www.mhpc.com/election2015/constituencies/south-shields/
- ↑ http://northeastlibdems.org.uk/en/article/2015/1019238/gita-gordon-named-as-first-bme-lib-dem-candidate-in-the-north-east/
- ↑ http://www.mhpc.com/election2015/constituencies/south-shields/
- ↑ South Shields by-election", South Tyneside Council
- ↑ "South Shields Constituency - 02 May 2013 Parliamentary By-Election". SouthTyneside.info. Retrieved 3 May 2013.
- ↑ "South Shields by-election: Labour wins as UKIP makes big gains". BBC News. 3 May 2013. Retrieved 3 May 2013.
- ↑ "UK General Election results May 2010, part21". Richard Kimber's political science resources. Retrieved 3 May 2013.
- ↑ "UK General Election results May 2005, part18". Richard Kimber's political science resources. Retrieved 3 May 2013.
- ↑ 14.0 14.1 "UK General Election results: South Shields, 1997 and 2001". Richard Kimber's political science resources. Retrieved 3 May 2013.
- ↑ "UK General Election results, April 1992, part 18". Richard Kimber's political science resources. Retrieved 3 May 2013.
- ↑ "UK General Election results, June 1983 (part 18)". Richard Kimber's political science resources. Retrieved 3 May 2013.
- ↑ "UK General Election results. June 1983, part 18". Richard Kimber's political science resources. Retrieved 3 May 2013.
- ↑ "UK General Election results, May 1979, part 18". Richard Kimber's political science resources. Retrieved 3 May 2013.
- ↑ "UK General Election results, October 1974 (part 18)". Richard Kimber's political science resources. Retrieved 3 May 2013.
- ↑ "UK General Election results, February 1974 (part 18)". Richard Kimber's political science resources. Retrieved 3 May 2013.
- ↑ "UK General Election results, June 1970 (part 18)". Richard Kimber's political science resources. Retrieved 3 May 2013.
- ↑ 22.0 22.1 "UK General Election results, March 1966 (part 18)". Richard Kimber's political science resources. Retrieved 3 May 2013.
- ↑ 23.0 23.1 "UK General Election results, October 1959 (part 18)". Richard Kimber's political science resources. Retrieved 4 May 2013.
- ↑ "UK General Election results, May 1955 (part 18)". Richard Kimber's political science resources. Retrieved 4 May 2013.
- ↑ "UK General Election results, October 1951 (part 18)". Richard Kimber's political science resources. Retrieved 4 May 2013.
- ↑ "UK General Election results, July 1945 (part 18)". Richard Kimber's political science resources. Retrieved 4 May 2013.
- ↑ 27.0 27.1 27.2 27.3 27.4 British parliamentary election results, 1918-1949, Fred W. S. Craig
- ↑ 28.0 28.1 28.2 28.3 28.4 British parliamentary election results, 1885-1918 (Craig)
Craig, F. W. S. (1983). British parliamentary election results 1918-1949 (3 ed.). Chichester: Parliamentary Research Services. ISBN 0-900178-06-X.
| ||||||||||||||||||