South Ribble (UK Parliament constituency)
Coordinates: 53°43′01″N 2°41′49″W / 53.717°N 2.697°W
| South Ribble | |
|---|---|
|
County constituency for the House of Commons | |
|
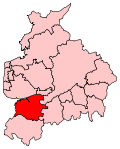
Boundary of South Ribble in Lancashire. | |
|
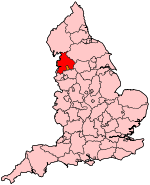
Location of Lancashire within England. | |
| County | Lancashire |
| Electorate | 75,116 (December 2010)[1] |
| Major settlements | Leyland and Penwortham |
| Current constituency | |
| Created | 1983 |
| Member of parliament | Lorraine Fullbrook (Conservative) |
| Number of members | One |
| Created from | Preston South |
| Overlaps | |
| European Parliament constituency | North West England |
South Ribble is a constituency[n 1] represented in the House of Commons of the UK Parliament since 2010 by Lorraine Fullbrook, a Conservative.[n 2]
History
The seat of South Ribble was created for the 1983 general election, following the local government changes in the 1970s which saw the creation of the main constitutive borough of the same name.
Former Preston North MP Robert Atkins won the South Ribble constituency in 1983 and fought the seat in every election up to the 1997 general election. At that time, in dramatic bellwether fashion, Labour's David Borrow gained the seat on a clear majority, with nearly 26,000 votes, 2,000 less than Robert Atkins' victory in 1983 which was the equally an unusual landslide result. From the 1997 "landslide year" until 2010, David Borrow's vote total and majority consistently shrunk with a swing back to the Conservatives at every election. In terms of the other parties, Liberal Democrats have not thus far achieved better than third and 2005 saw UKIP nominating a candidate for the first time, and taking just over 1,200 votes. Borrow finally lost South Ribble in 2010 on a large two-party swing to the current Member of Parliament, Lorraine Fullbrook.
Boundaries
Created in 1983, the seat's original boundaries were co-terminous with the South Ribble borough.[2] Due to its population figures, the borough of South Ribble and its parliamentary constituency hasn't shared the same boundaries since although the towns of Leyland and Penwortham have always featured at the centre of the constituency.
For the 1997 general election the eastern small towns of Bamber Bridge and Walton-le-Dale were moved to the Preston constituency. Following their review of parliamentary representation in Lancashire prior to the 2010 general election, the Boundary Commission for England created a new constituency of Wyre and Preston North in the central part of the county. This also made the Ribble Valley seat take wards from south of the River Ribble for the first time causing alterations to this seat also.
The new South Ribble constituency moved further south and south-west, and has electoral wards:
- Eccleston and Mawdesley, and Lostock in the Borough of Chorley
- Broad Oak, Charnock, Earnshaw Bridge, Golden Hill, Howick and Priory, Kingsfold, Leyland Central, Leyland St. Ambrose, Leyland St. Marys, Little Hoole and Much Hoole, Longton and Hutton West, Lowerhouse, Middleforth, Moss Side, New Longton and Hutton East, Seven Stars, Whitefield in the Borough of South Ribble
- Hesketh-with-Becconsall, North Meols, Rufford and Tarleton in the West Lancashire district
Members of Parliament
| Year | Member[3] | Party | |
|---|---|---|---|
| 1983 | Robert James Atkins | Conservative | |
| 1997 | David Borrow | Labour | |
| 2010 | Lorraine Fullbrook | Conservative | |
Elections
Elections in the 2010s
| General Election 2015: South Ribble[4][5] | |||||
|---|---|---|---|---|---|
| Party | Candidate | Votes | % | ±% | |
| Labour | Veronica Lucy Bennett | ||||
| UKIP | David Gallagher | ||||
| Conservative | Seema Louise Ghiassi Kennedy | ||||
| Liberal Democrat | Sue McGuire | ||||
| General Election 2010: South Ribble | |||||
|---|---|---|---|---|---|
| Party | Candidate | Votes | % | ±% | |
| Conservative | Lorraine Fullbrook | 23,396 | 45.5 | +7.1 | |
| Labour | David Borrow | 17,842 | 34.7 | −9.6 | |
| Liberal Democrat | Peter Fisher | 7,271 | 14.1 | −0.6 | |
| UKIP | David Duxbury | 1,895 | 3.7 | +1.5 | |
| BNP | Rosalind Gauci | 1,054 | 2.0 | +2.0 | |
| Majority | 5,554 | 10.8 | +6.2 | ||
| Turnout | 51,458 | 67.9 | +4.4 | ||
| Conservative gain from Labour | Swing | +8.1 | |||
Elections in the 2000s
| General Election 2005: South Ribble | |||||
|---|---|---|---|---|---|
| Party | Candidate | Votes | % | ±% | |
| Labour | David Borrow | 20,428 | 43.0 | −3.4 | |
| Conservative | Lorraine Fullbrook | 18,244 | 38.4 | +0.3 | |
| Liberal Democrat | Mark Lindsay Alcock | 7,634 | 16.1 | +0.6 | |
| UKIP | Kenneth Jones | 1,205 | 2.5 | N/A | |
| Majority | 2,184 | 4.6 | −3.7 | ||
| Turnout | 47,511 | 63.0 | +0.5 | ||
| Labour hold | Swing | −1.9 | |||
| General Election 2001: South Ribble | |||||
|---|---|---|---|---|---|
| Party | Candidate | Votes | % | ±% | |
| Labour | David Borrow | 21,386 | 46.4 | −0.4 | |
| Conservative | Adrian Edward Owens | 17,584 | 38.1 | +0.5 | |
| Liberal Democrat | Mark Lindsay Alcock | 7,150 | 15.5 | +4.9 | |
| Majority | 3,802 | 8.3 | −0.9 | ||
| Turnout | 46,120 | 62.5 | −14.6 | ||
| Labour hold | Swing | −0.5 | |||
Elections in the 1990s
| General Election 1997: South Ribble[6][7][8] | |||||
|---|---|---|---|---|---|
| Party | Candidate | Votes | % | ±% | |
| Labour | David Borrow | 25,856 | 46.8 | +12.0 | |
| Conservative | Robert James Atkins | 20,772 | 37.6 | −12.3 | |
| Liberal Democrat | Tim Farron | 5,879 | 10.6 | −4.2 | |
| Referendum Party | Mark Adams | 1,475 | 2.7 | N/A | |
| Liberal | Nigel R. Ashton | 1,127 | 2.0 | N/A | |
| Natural Law | Mrs. Bibette Leadbetter | 122 | 0.2 | −0.2 | |
| Majority | 5,084 | 9.2 | −5.8 | ||
| Turnout | 55,231 | 77.1 | |||
| Labour gain from Conservative | Swing | +12.1 | |||
| General Election 1992: South Ribble[9] | |||||
|---|---|---|---|---|---|
| Party | Candidate | Votes | % | ±% | |
| Conservative | Robert James Atkins | 30,828 | 47.5 | +0.3 | |
| Labour | Dr. Geoffrey Wilfred Tracey Smith | 24,855 | 38.3 | +5.2 | |
| Liberal Democrat | Simon Nicholas Jones | 8,928 | 13.8 | −6.0 | |
| Natural Law | Dr. Decter Ronald | 269 | 0.4 | +0.4 | |
| Majority | 5,973 | 9.2 | −4.9 | ||
| Turnout | 64,880 | 83.0 | +3.2 | ||
| Conservative hold | Swing | −2.5 | |||
Elections in the 1980s
| General Election 1987: South Ribble | |||||
|---|---|---|---|---|---|
| Party | Candidate | Votes | % | ±% | |
| Conservative | Robert James Atkins | 28,133 | 47.2 | −1.6 | |
| Labour | David Frank Roebuck | 19,703 | 33.1 | +6.6 | |
| Liberal | Joseph Alan Holleran | 11,746 | 19.7 | −5.0 | |
| Majority | 8,430 | 14.1 | |||
| Turnout | 59,582 | 82.5 | |||
| Conservative hold | Swing | −4.1 | |||
| General Election 1983: South Ribble | |||||
|---|---|---|---|---|---|
| Party | Candidate | Votes | % | ±% | |
| Conservative | Robert James Atkins | 27,625 | 48.8 | N/A | |
| Labour | Frank Duffy | 14,966 | 26.5 | N/A | |
| Liberal | Robert Walker | 13,960 | 24.7 | N/A | |
| Majority | 12,659 | 22.3 | N/A | ||
| Turnout | 56,551 | 78.0 | N/A | ||
| Conservative win (new seat) | |||||
See also
Notes and references
- Notes
- References
- ↑ "Electorate Figures - Boundary Commission for England". 2011 Electorate Figures. Boundary Commission for England. 4 March 2011. Retrieved 13 March 2011.
- ↑ Crewe, Ivor (1983). British Parliamentary Constituencies - a statistical compendium. faber and faber.
- ↑ Leigh Rayment's Historical List of MPs – Constituencies beginning with "S" (part 4)
- ↑ http://www.davidgallaghersouthribble.com/
- ↑ http://www.liverpoolecho.co.uk/news/local-news/blundellsands-councillor-veronica-bennett-chose-6957474
- ↑ "Politics Resources". Election 1997. Politics Resources. 1 May 1997. Retrieved 7 Jan 2011.
- ↑ C. Rallings & M. Thrasher, The Media Guide to the New Parliamentary Constituencies, p.138 (Plymouth: LGC Elections Centre, 1995)
- ↑ The 1997 election result is calculated relative to the notional, not the actual, 1992 result.
- ↑ "Politics Resources". Election 1992. Politics Resources. 9 April 1992. Retrieved 6 Dec 2010.