South Korean legislative election, 2008
| | |||||||||||||||||||||||||||||||||||||||||||||||||||||||||||||||||||
| |||||||||||||||||||||||||||||||||||||||||||||||||||||||||||||||||||
| |||||||||||||||||||||||||||||||||||||||||||||||||||||||||||||||||||
|
| |||||||||||||||||||||||||||||||||||||||||||||||||||||||||||||||||||
| legislative districts majority ■ - GNP ■ - UDP ■ – LFP ■ – Pro-Park ■ - DLP ■ - CKP ■ - Independent factions | |||||||||||||||||||||||||||||||||||||||||||||||||||||||||||||||||||
 |
| This article is part of a series on the politics and government of South Korea |
| Constitution |
|
National Assembly
|
|
Judiciary
|
|
Politics portal |
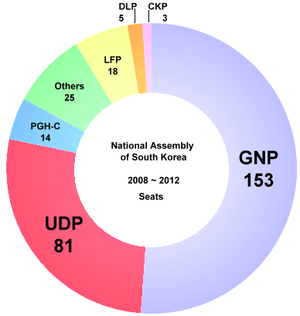
Legislative elections were held in South Korea on April 9, 2008.[1] The conservative Grand National Party won 153 of 299 seats while the main opposition United Democratic Party won 81 seats.[2] This election marked the lowest-ever voter turnout of 46.0%.[3]
Parties and Coalitions
As of April 9, 2008, there are six political parties represented in the 18th National Assembly of South Korea, in addition to independents:
- Grand National Party (한나라당, Hannara-dang), led by Kang Jae-seop. The current major conservative party within the National Assembly. (153 seats won)
- United Democratic Party (통합민주당, Tongham Minju-dang), led by Son Hak-gyu. The current major liberal party within the National Assembly. (81 seats won)
- United Democratic Party is now known as Democratic Party (민주당 Minju-dang).
- Liberty Forward Party (자유선진당, Jayu Seonjin-dang), led by Lee Hoi-chang. The Chungcheong Region-strongholder and current second conservative party within the National Assembly against the GNP. (18 seats won)
- Pro-Park Geun-hye Coalition (친박연대, Chin-bak Yeon-dae), led by Seo Cheong-won, although their inspirational leader is former GNP leader Park Geun-hye. A conservative coalition with Park Geun-hye within the National Assembly that broke away from the GNP after a dispute on the GNP's candidate nomination, which happened just before the election. (14 seats won)
- Democratic Labour Party (민주노동당, Minju Nodong-dang), led by Chun Young-se. A minor but the most progressive party within the 18th National Assembly, against both the Grand Nationals and Democrats. (5 seats won)
- Renewal of Korea Party (창조한국당, Changjo Hanguk-dang), led by Moon Kook-hyun. A minor but pro-environmental liberal party within the National Assembly, against the Grand Nationals. (3 seats won)
- (no seats) The New Progressive Party (진보신당) Jinbo Shin-dang), led by Sim Sang-jeong and Roh Hoe-chan, won 2.94% votes but not enough to gain any seats. The New Progressive Party split from the Democratic Labour Party as a reaction to nationalism after the 2007 presidential elections.
Results
| ↓ | ||||||
| L P |
|
K P |
|
F P |
Park |
|
The national summary of votes and seats by party follow:
| Turnout 46.0% | |||||||||||
|---|---|---|---|---|---|---|---|---|---|---|---|
| Parties | Local seats | ± | Block seats | ± | Constituency votes | % | PR block votes | % | Total seats | ± | |
| Grand National Party (한나라당) (GNP) | 131 | +31 | 22 | +1 | 7,478,776 | 43.45% | 6,421,727 | 37.48% | 153 | +32 | |
| United Democratic Party2 (통합민주당) (UDP) | 66 | -63 | 15 | -8 | 4,977,508 | 28.92% | 4,313,645 | 25.17% | 81 | -71 | |
| Liberty Forward Party (자유선진당) (LFP) | 14 | +14 | 4 | +4 | 984,751 | 5.72% | 1,173,463 | 6.84% | 18 | +18 | |
| Pro-Park Coalition (친박연대) (PRO-PARK) | 6 | +6 | 8 | +8 | 637,351 | 3.70% | 2,258,750 | 13.18% | 14 | +14 | |
| Democratic Labor Party (민주노동당) (DLP) | 2 | ±0 | 4 | -4 | 583,665 | 3.39% | 973,445 | 5.68% | 5 | -5 | |
| Creative Korea Party (창조한국당) (CKP) | 1 | +1 | 2 | +2 | 72,803 | 0.42% | 651,993 | 3.80% | 3 | +3 | |
| New Progressive Party (진보신당) (NPP) | 0 | ±0 | 0 | ±0 | 229,500 | 1.33% | 504,466 | 2.94% | 0 | ±0 | |
| Other parties | 0 | ±0 | 0 | ±0 | 341,010 | 1.98% | 834,048 | 4.83% | 0 | ±0 | |
| Independents | 25 | +23 | — | — | 1,907,326 | 11.08% | — | — | 25 | +23 | |
| Total | 245 | 54 | 17,212,690 | 100.0% | 17,131,537 | 100.0% | 299 | ||||
| Ideology | |||||||||||
| Conservative (GNP, LFP, PRO-PARK) | 151 | +51 | 34 | +13 | 9,100,879 | 52.87% | 9,853,940 | 57.50% | 185 | +64 | |
| Liberal (UDP, CKP) | 67 | -67 | 17 | -10 | 5,050,311 | 29.34% | 7,965,638 | 27.28% | 84 | -79 | |
| Progressive (DLP, NPP) | 2 | ±0 | 4 | -4 | 813,165 | 4.72% | 1477911 | 8.62% | 5 | -5 | |
| Total | 245 | 54 | 14,964,354 | 86.9% | 16,297,489 | 95.1% | 300 | ||||
1Later changed to Future Hope Alliance.
2Later changed to Democratic Party.

Election results (Total)

Seats prior to the election
Result by region
| |Region | GNP | UDP | LFP | PGH-C | DLP | ROKP | Independent | Total |
|---|---|---|---|---|---|---|---|---|
| Seoul | 40 | 7 | - | - | - | 1 | - | 48 |
| Busan | 11 | 1 | - | 1 | - | - | 5 | 18 |
| Incheon | 9 | 2 | - | - | - | - | 1 | 12 |
| Daegu | 8 | - | - | 3 | - | - | 1 | 12 |
| Gwangju | - | 7 | - | - | - | - | 1 | 8 |
| Daejeon | - | 1 | 5 | - | - | - | - | 6 |
| Ulsan | 5 | - | - | - | - | - | 1 | 6 |
| Gangwon-do | 3 | 2 | - | - | - | - | 3 | 8 |
| Gyeonggi-do | 32 | 17 | - | 1 | - | - | 1 | 51 |
| South Gyeongsang | 13 | 1 | - | - | 2 | - | 1 | 17 |
| North Gyeongsang | 9 | - | - | 1 | - | - | 5 | 15 |
| South Jeolla | - | 9 | - | - | - | - | 3 | 12 |
| North Jeolla | - | 9 | - | - | - | - | 2 | 11 |
| South Chungcheong | - | 1 | 8 | - | - | - | 1 | 10 |
| North Chungcheong | 1 | 6 | 1 | - | - | - | - | 8 |
| Jeju | - | 3 | - | - | - | - | - | 3 |
| Proportional representation |
22 | 15 | 4 | 8 | 3 | 2 | - | 54 |
| Total | 153 | 81 | 18 | 14 | 5 | 3 | 25 | 299 |
References
| ||||||||||||||||||||||


.jpg)
