Solihull Metropolitan Borough Council election, 2002
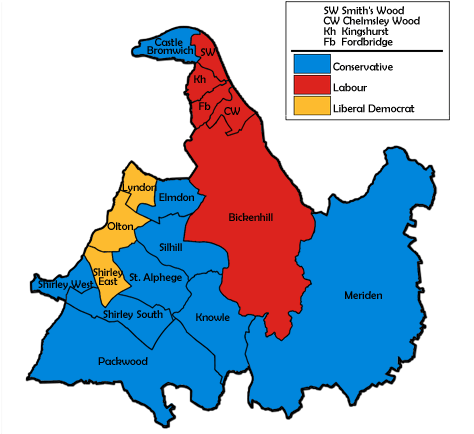
Map of the results for the 2002 Solihull council election.
The 2002 Solihull Metropolitan Borough Council election took place on 2 May 2002 to elect members of Solihull Metropolitan Borough Council in the West Midlands, England.
One third of the council was up for election and the Conservative party stayed in overall control of the council.[1]
Campaign
Before the election the Conservatives held 29 seats, compared to 14 for Labour and 8 for the Liberal Democrats, with 17 seats being contested in the election.[2] The Conservatives had held a majority on the council since gaining 4 seats at the 2000 election.[2]
Issues in the election included a proposed development by Asda in Shirley, the fate of the Accident and Emergency department at Solihull hospital and new housing developments.[3][4] Labour also wanted to address a north-south divide in the council area and opposed any transfer of council housing from council control.[3][4]
Election result
The results saw the Conservatives stay in control of the council with 29 of the 51 seats after only 2 seats changed parties.[5] A couple of former councillors returned to the council, the former Labour leader of the council Michael Corser in Chelmsley Wood and Liberal Democrat June Gandy in Shirley East.[5]
| Solihull Local Election Result 2002[6][7] |
| Party |
Seats |
Gains |
Losses |
Net gain/loss |
Seats % |
Votes % |
Votes |
+/− |
| |
Conservative |
9 |
1 |
1 |
0 |
52.9 |
49.2 |
24,309 |
-9.7% |
| |
Labour |
5 |
0 |
1 |
-1 |
29.4 |
23.7 |
11,741 |
+5.5% |
| |
Liberal Democrat |
3 |
1 |
0 |
+1 |
17.6 |
27.1 |
13,390 |
+4.5% |
This result had the following consequences for the total number of seats on the council after the elections :[8]
| Party |
Previous council |
New council |
|
Conservatives |
29 |
29 |
|
Labour |
14 |
13 |
|
Liberal Democrat |
8 |
9 |
| Total |
51 |
51 |
| Working majority |
7 |
7 |
Ward results
| Lyndon[6] |
| Party |
Candidate |
Votes |
% |
±% |
|
Liberal Democrat |
Robert Reeves |
1,583 |
65.4 |
+7.2 |
|
Conservative |
Gary Allport |
478 |
19.7 |
-9.1 |
|
Labour |
Catherine Connan |
360 |
14.9 |
+1.9 |
| Majority |
1,105 |
45.6 |
+16.3 |
| Turnout |
2,421 |
31.8 |
+3.2 |
|
Liberal Democrat hold |
Swing |
+8.1 |
|
| Olton[6] |
| Party |
Candidate |
Votes |
% |
±% |
|
Liberal Democrat |
John Windmill |
2,192 |
61.8 |
+11.0 |
|
Conservative |
Patricia Handslip |
1,078 |
30.4 |
-12.3 |
|
Labour |
Eric Collins |
277 |
7.8 |
+1.3 |
| Majority |
1,114 |
31.4 |
+23.2 |
| Turnout |
3,547 |
38.6 |
+2.7 |
|
Liberal Democrat hold |
Swing |
+11.6 |
|
| Packwood[6] |
| Party |
Candidate |
Votes |
% |
±% |
|
Conservative |
Kenneth Meeson |
2,627 |
60.7 |
+4.6 |
|
Liberal Democrat |
Eric Widger |
1,417 |
32.8 |
-6.3 |
|
Labour |
Florence Nash |
281 |
6.5 |
+1.6 |
| Majority |
1,210 |
28.0 |
+11.0 |
| Turnout |
4,325 |
37.9 |
-3.2 |
|
Conservative hold |
Swing |
+5.4 |
|
| Shirley East[6] |
| Party |
Candidate |
Votes |
% |
±% |
|
Liberal Democrat |
June Gandy |
2,028 |
57.1 |
+14.2 |
|
Conservative |
Brian Burgess |
1,242 |
35.0 |
-16.3 |
|
Labour |
Kevin Raven |
279 |
7.9 |
+2.1 |
| Majority |
786 |
22.1 |
+13.7 |
| Turnout |
3,549 |
39.1 |
+0.1 |
|
Liberal Democrat gain from Conservative |
Swing |
+15.2 |
|
| Shirley South[6] |
| Party |
Candidate |
Votes |
% |
±% |
|
Conservative |
David Evans |
2,023 |
54.3 |
-13.0 |
|
Liberal Democrat |
Roger Gemmell |
1,031 |
27.7 |
+13.2 |
|
Labour |
Barney McElholm |
673 |
18.1 |
+0.0 |
| Majority |
992 |
26.6 |
-22.6 |
| Turnout |
3,727 |
28.7 |
+2.5 |
|
Conservative hold |
Swing |
-13.1 |
|
| Shirley West[6] |
| Party |
Candidate |
Votes |
% |
±% |
|
Conservative |
Richard Lewis |
1,487 |
54.1 |
-8.9 |
|
Labour |
Arthur Harper |
681 |
24.8 |
+1.9 |
|
Liberal Democrat |
Anthony Verduyn |
581 |
21.1 |
+7.0 |
| Majority |
806 |
29.3 |
-10.7 |
| Turnout |
2,749 |
30.4 |
+0.9 |
|
Conservative hold |
Swing |
-5.4 |
|
| Silhill[6] |
| Party |
Candidate |
Votes |
% |
±% |
|
Conservative |
Sheila Pittaway |
2,145 |
61.7 |
-6.0 |
|
Liberal Democrat |
Brenda Chapple |
819 |
23.5 |
+3.3 |
|
Labour |
Marcus Bennion |
514 |
14.8 |
+2.7 |
| Majority |
1,326 |
38.1 |
-9.5 |
| Turnout |
3,478 |
35.3 |
+1.6 |
|
Conservative hold |
Swing |
-4.6 |
|
| St Alphege[6] |
| Party |
Candidate |
Votes |
% |
±% |
|
Conservative |
Kathleen Wild |
2,681 |
66.1 |
-8.6 |
|
Liberal Democrat |
Christine Reeves |
983 |
24.2 |
+8.2 |
|
Labour |
James Burman |
393 |
9.7 |
+0.4 |
| Majority |
1,698 |
41.9 |
-16.9 |
| Turnout |
4,057 |
37.1 |
+2.6 |
|
Conservative hold |
Swing |
-8.4 |
|
By-elections between 2002 and 2003
| Shirley West by-election 13 March 2003[9] |
| Party |
Candidate |
Votes |
% |
±% |
|
Liberal Democrat |
Howard Allen |
1,179 |
54.9 |
+33.8 |
|
Conservative |
Joan Allsopp |
777 |
36.2 |
-17.9 |
|
Labour |
Arthur Harper |
192 |
8.9 |
-15.9 |
| Majority |
402 |
18.7 |
-10.6 |
| Turnout |
2,148 |
23.8 |
-6.6 |
|
Liberal Democrat gain from Conservative |
Swing |
+25.8 |
|
References