Solihull Metropolitan Borough Council election, 1994
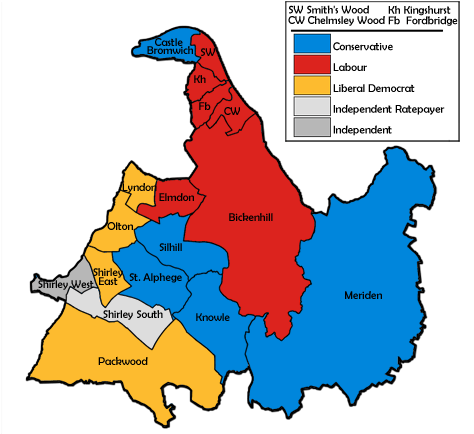
Map of the results for the 1994 Solihull council election.
The Solihull Metropolitan Borough Council elections were held on Thursday, 5 May 1994, with one third of the council and a double vacancy in Fordbridge to be elected. The council remained under no overall control with the Conservatives seven seats short of a majority. Voter turnout was 43.6%.[1][2]
Election result
| Solihull Local Election Result 1994 |
| Party |
Seats |
Gains |
Losses |
Net gain/loss |
Seats % |
Votes % |
Votes |
+/− |
| |
Labour |
7 |
0 |
0 |
0 |
38.9 |
26.2 |
17,764 |
+9.4% |
| |
Conservative |
5 |
0 |
2 |
-2 |
27.8 |
34.7 |
23,559 |
-22.3% |
| |
Liberal Democrat |
4 |
2 |
0 |
+2 |
22.2 |
30.5 |
20,698 |
+15.0% |
|
Independent Ratepayers & Residents |
1 |
0 |
0 |
0 |
5.5 |
6.0 |
4,065 |
-2.8% |
| |
Independent |
1 |
0 |
0 |
0 |
5.5 |
2.5 |
1,677 |
+2.5% |
| |
National Front |
0 |
0 |
0 |
0 |
0.0 |
0.2 |
150 |
+0.2% |
This result had the following consequences for the total number of seats on the council after the elections:
| Party |
Previous council |
New council |
|
Conservatives |
24 |
22 |
|
Labour |
15 |
15 |
|
Liberal Democrats |
6 |
8 |
|
Independent Ratepayers & Residents |
5 |
5 |
|
Independent |
1 |
1 |
| Total |
51 |
51 |
| Working majority |
-3 |
-7 |
Ward results
| Elmdon[1] |
| Party |
Candidate |
Votes |
% |
±% |
|
Labour |
Sheila Brookes |
2,437 |
56.5 |
+18.6 |
|
Conservative |
D. Wilkes |
1,317 |
30.5 |
-18.6 |
|
Liberal Democrat |
J. Jardine |
557 |
12.9 |
+12.9 |
| Majority |
1,120 |
26.0 |
+14.7 |
| Turnout |
4,311 |
52.3 |
+7.8 |
|
Labour hold |
Swing |
+18.6 |
|
| Fordbridge[1] |
| Party |
Candidate |
Votes |
% |
±% |
|
Labour |
Arthur Harper |
1,343 |
66.0 |
+9.1 |
|
Labour |
Ben Magee |
1,079 |
|
|
|
Conservative |
Keith Samuels |
361 |
17.7 |
-17.4 |
|
Liberal Democrat |
Bernard Wright |
184 |
9.0 |
+1.1 |
|
Liberal Democrat |
Jennifer Wright |
157 |
|
|
|
Independent Ratepayers |
M. Hitchcock |
147 |
7.2 |
+7.2 |
| Majority |
982 |
48.3 |
+26.5 |
| Turnout |
2,035 |
30.5 |
+10.2 |
|
Labour hold |
Swing |
|
|
|
Labour hold |
Swing |
+13.2 |
|
| Lyndon[1] |
| Party |
Candidate |
Votes |
% |
±% |
|
Liberal Democrat |
Norman Chapple |
2,577 |
69.1 |
+17.1 |
|
Conservative |
Peter Duddy |
646 |
17.3 |
-21.7 |
|
Labour |
J. Stanley |
505 |
13.5 |
+4.6 |
| Majority |
1,931 |
51.8 |
+38.8 |
| Turnout |
3,728 |
46.3 |
+4.9 |
|
Liberal Democrat hold |
Swing |
+19.4 |
|
| Olton[1] |
| Party |
Candidate |
Votes |
% |
±% |
|
Liberal Democrat |
John Windmill |
2,631 |
58.2 |
+14.7 |
|
Conservative |
Nicholas Worley |
1,542 |
34.1 |
-18.4 |
|
Labour |
Joan Holt |
346 |
7.7 |
+3.6 |
| Majority |
1,089 |
24.1 |
+15.1 |
| Turnout |
4,519 |
48.9 |
+2.5 |
|
Liberal Democrat hold |
Swing |
+16.5 |
|
| Packwood[1] |
| Party |
Candidate |
Votes |
% |
±% |
|
Liberal Democrat |
Peter Lee |
2.865 |
55.3 |
+20.5 |
|
Conservative |
Peter Llewellyn |
2,073 |
40.0 |
-22.5 |
|
Labour |
Michael Steed |
244 |
4.7 |
+2.0 |
| Majority |
792 |
15.3 |
-12.5 |
| Turnout |
5,182 |
51.7 |
+3.4 |
|
Liberal Democrat gain from Conservative |
Swing |
+21.5 |
|
| Shirley East[1] |
| Party |
Candidate |
Votes |
% |
±% |
|
Liberal Democrat |
Michael Southcombe |
2,388 |
51.3 |
+11.4 |
|
Conservative |
Richard Lewis |
1,626 |
34.9 |
-19.4 |
|
Labour |
Robert Houghton |
416 |
8.9 |
+3.2 |
|
Independent |
Leslie Pitt |
224 |
4.8 |
+4.8 |
| Majority |
762 |
16.4 |
+1.9 |
| Turnout |
4,654 |
50.2 |
+6.0 |
|
Liberal Democrat gain from Conservative |
Swing |
+15.4 |
|
| Shirley South[1] |
| Party |
Candidate |
Votes |
% |
±% |
|
Independent Ratepayers |
Richard Jackson |
2,859 |
54.9 |
+54.9 |
|
Liberal Democrat |
Richard Blight |
1,657 |
31.8 |
+31.8 |
|
Labour |
Peter Ward |
692 |
13.3 |
+7.5 |
| Majority |
1,202 |
23.1 |
+11.0 |
| Turnout |
5,208 |
39.2 |
-1.2 |
|
Independent Ratepayers hold |
Swing |
+11.5 |
| Shirley West[1] |
| Party |
Candidate |
Votes |
% |
±% |
|
Independent |
Brenda Otton |
1,453 |
38.1 |
-16.9 |
|
Independent Ratepayers |
John Rogers |
1,059 |
27.8 |
+27.8 |
|
Liberal Democrat |
Honor Cox |
684 |
17.9 |
+17.9 |
|
Labour |
Ann Littley |
615 |
16.1 |
+8.6 |
| Majority |
394 |
10.3 |
-7.2 |
| Turnout |
3,811 |
41.2 |
+4.0 |
|
Independent hold |
Swing |
-22.3 |
|
| St. Alphege[1] |
| Party |
Candidate |
Votes |
% |
±% |
|
Conservative |
Kathleen Wild |
3,316 |
65.6 |
-13.7 |
|
Liberal Democrat |
Roger Gemmell |
1,324 |
26.2 |
+26.2 |
|
Labour |
A. Hanley |
418 |
8.3 |
+2.3 |
| Majority |
1,992 |
39.4 |
-25.2 |
| Turnout |
5,058 |
47.6 |
+3.6 |
|
Conservative hold |
Swing |
-19.9 |
|
References