Solihull Metropolitan Borough Council election, 1992
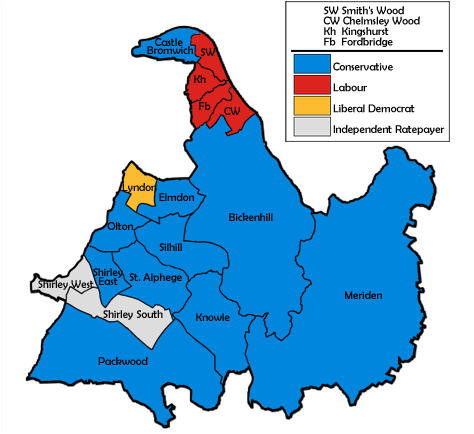
Map of the results for the 1992 Solihull council election.
The Solihull Metropolitan Borough Council elections were held on Thursday, 7 May 1992, with one third of the council to be elected. The council remained under no overall control with the Conservatives three seats short of a majority. Voter turnout was 37.8%.[1][2]
Election result
| Solihull Local Election Result 1992 |
| Party |
Seats |
Gains |
Losses |
Net gain/loss |
Seats % |
Votes % |
Votes |
+/− |
| |
Conservative |
10 |
1 |
0 |
+1 |
58.8 |
57.0 |
33,601 |
+10.8% |
| |
Labour |
4 |
0 |
1 |
-1 |
23.5 |
16.8 |
9,935 |
-6.2% |
|
Independent Ratepayers & Residents |
2 |
0 |
0 |
0 |
11.8 |
8.8 |
5,187 |
+0.5% |
| |
Liberal Democrat |
1 |
0 |
0 |
0 |
5.9 |
15.5 |
9,165 |
-3.0% |
| |
Green |
0 |
0 |
0 |
0 |
0.0 |
1.9 |
1,095 |
-1.7% |
This result had the following consequences for the total number of seats on the council after the elections:
| Party |
Previous council |
New council |
|
Conservatives |
23 |
24 |
|
Labour |
16 |
15 |
|
Independent Ratepayers & Residents |
6 |
6 |
|
Liberal Democrats |
6 |
6 |
| Total |
51 |
51 |
| Working majority |
-5 |
-3 |
Ward results
| Lyndon[1] |
| Party |
Candidate |
Votes |
% |
±% |
|
Liberal Democrat |
Richard Balmer |
1,775 |
52.0 |
-4.0 |
|
Conservative |
Gloria Cox |
1,333 |
39.1 |
+10.6 |
|
Labour |
Joan Holt |
305 |
8.9 |
-6.5 |
| Majority |
442 |
12.9 |
-14.6 |
| Turnout |
3,413 |
41.4 |
-8.0 |
|
Liberal Democrat hold |
Swing |
-7.3 |
|
| Packwood[1] |
| Party |
Candidate |
Votes |
% |
±% |
|
Conservative |
Kenneth Meeson |
2,858 |
62.5 |
+20.0 |
|
Liberal Democrat |
Jennifer Wright |
1,589 |
34.8 |
-15.5 |
|
Labour |
Frederick Bradley |
122 |
2.7 |
+0.2 |
| Majority |
1,269 |
27.8 |
+20.0 |
| Turnout |
4,569 |
48.3 |
-7.0 |
|
Conservative hold |
Swing |
+17.7 |
|
| Shirley South[1] |
| Party |
Candidate |
Votes |
% |
±% |
|
Independent |
Ursula Eames |
2,787 |
53.1 |
+1.8 |
|
Conservative |
Philip Cross |
2,152 |
41.0 |
+2.3 |
|
Labour |
Barry Beattie |
305 |
5.8 |
-4.1 |
| Majority |
635 |
12.1 |
-0.4 |
| Turnout |
5,244 |
40.4 |
-6.4 |
|
Independent hold |
Swing |
-0.2 |
|
| Shirley West[1] |
| Party |
Candidate |
Votes |
% |
±% |
|
Independent Ratepayers |
Jane Granger |
1,919 |
55.0 |
+7.3 |
|
Conservative |
Denis Eyre |
1,308 |
37.5 |
-0.2 |
|
Labour |
Robert Houghton |
262 |
7.5 |
-7.1 |
| Majority |
611 |
17.5 |
+7.5 |
| Turnout |
3,489 |
37.2 |
-4.7 |
|
Independent Ratepayers hold |
Swing |
+3.7 |
| Silhill[1] |
| Party |
Candidate |
Votes |
% |
±% |
|
Conservative |
Peter Hogarth |
2,977 |
73.4 |
+12.9 |
|
Liberal Democrat |
Bernard Winchcombe |
583 |
14.4 |
-8.2 |
|
Labour |
Donald Bargery |
494 |
12.2 |
-4.7 |
| Majority |
2,394 |
59.0 |
+21.2 |
| Turnout |
4,054 |
40.0 |
-6.0 |
|
Conservative hold |
Swing |
+10.6 |
|
References
|
|---|
| | Metropolitan boroughs | |
|---|
| | District councils (England) | |
|---|
| | District councils (Scotland) |
- Aberdeen
- Angus
- Annandale and Eskdale
- Argyll and Bute
- Badenoch and Strathspey
- Banff and Buchan
- Bearsden and Milngavie
- Berwickshire
- Caithness
- Clackmannan
- Clydebank
- Clydesdale
- Cumbernauld and Kilsyth
- Cumnock and Doon Valley
- Cunninghame
- Dumbarton
- Dundee
- Dunfermline
- East Kilbride
- East Lothian
- Eastwood
- Edinburgh
- Ettrick and Lauderdale
- Falkirk
- Glasgow
- Gordon
- Hamilton
- Inverclyde
- Inverness
- Kilmarnock and Loudoun
- Kincardine and Deeside
- Kirkcaldy
- Kyle and Carrick
- Lochaber
- Midlothian
- Monklands
- Moray
- Motherwell
- Nairn
- Nithsdale
- North East Fife
- Perth and Kinross
- Renfrew
- Ross and Cromarty
- Roxburgh
- Skye and Lochalsh
- Stewartry
- Stirling
- Strathkelvin
- Sutherland
- Tweeddale
- West Lothian
- Wigtown
|
|---|
| |
|