Solihull Metropolitan Borough Council election, 1990
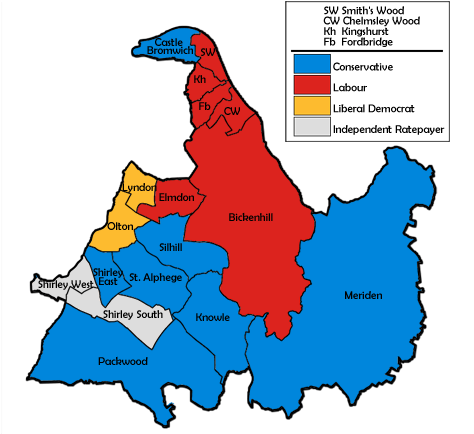
Map of the results for the 1990 Solihull council election.
The Solihull Metropolitan Borough Council elections were held on Thursday, 3 May 1990, with one third of the council to be elected. There had been a number of by-elections the previous year, with the net result being Liberal Democrat gains from the Conservatives in Shirley East and the Independent Ratepayers & Residents in Packwood. The Conservatives narrowly retained control of the council. Voter turnout was 49.5%.[1][2]
Election result
| Solihull Local Election Result 1990 |
| Party |
Seats |
Gains |
Losses |
Net gain/loss |
Seats % |
Votes % |
Votes |
+/− |
| |
Conservative |
7 |
1 |
2 |
-1 |
41.2 |
41.3 |
31,876 |
-10.6% |
| |
Labour |
6 |
1 |
0 |
+1 |
35.3 |
31.9 |
24,615 |
+5.6% |
| |
Liberal Democrat |
2 |
0 |
1 |
-1 |
11.8 |
16.7 |
12,849 |
+1.1% |
|
Independent Ratepayers & Residents |
2 |
1 |
0 |
+1 |
11.8 |
7.1 |
5,499 |
+1.0% |
| |
Green |
0 |
0 |
0 |
0 |
0.0 |
2.9 |
2,214 |
+2.9% |
| |
National Front |
0 |
0 |
0 |
0 |
0.0 |
0.1 |
62 |
+0.1% |
This result had the following consequences for the total number of seats on the council after the elections:
| Party |
Previous council |
New council |
|
Conservatives |
28 |
27 |
|
Labour |
14 |
15 |
|
Liberal Democrats |
6 |
5 |
|
Independent Ratepayers & Residents |
3 |
4 |
| Total |
51 |
51 |
| Working majority |
5 |
3 |
Ward results
| Elmdon[1] |
| Party |
Candidate |
Votes |
% |
±% |
|
Labour |
Sheila Brookes |
2,344 |
48.7 |
+2.9 |
|
Conservative |
Norman Page |
1,620 |
33.7 |
-11.2 |
|
Independent Ratepayers |
Jane Granger |
844 |
17.5 |
+17.5 |
| Majority |
724 |
15.1 |
+14.0 |
| Turnout |
4,808 |
55.1 |
|
|
Labour hold |
Swing |
+7.0 |
|
| Lyndon[1] |
| Party |
Candidate |
Votes |
% |
±% |
|
Liberal Democrat |
Norman Chapple |
2,441 |
54.6 |
+11.4 |
|
Labour |
Frederick Austin |
1,020 |
22.8 |
+5.5 |
|
Conservative |
Alan Power |
1,011 |
22.6 |
-16.9 |
| Majority |
1,421 |
31.8 |
+28.1 |
| Turnout |
4,472 |
54.0 |
|
|
Liberal Democrat hold |
Swing |
+2.9 |
|
| Olton[1] |
| Party |
Candidate |
Votes |
% |
±% |
|
Liberal Democrat |
John Windmill |
2,462 |
49.4 |
+13.3 |
|
Conservative |
Michael Goodwin |
1,941 |
38.9 |
-16.6 |
|
Labour |
Arthur Davis |
583 |
11.7 |
+3.2 |
| Majority |
521 |
10.4 |
-9.0 |
| Turnout |
4,986 |
53.6 |
|
|
Liberal Democrat hold |
Swing |
+15.0 |
|
| Packwood[1] |
| Party |
Candidate |
Votes |
% |
±% |
|
Conservative |
Peter Llewellyn |
2,459 |
49.6 |
-13.0 |
|
Liberal Democrat |
Judy Morris |
2,212 |
44.6 |
+13.4 |
|
Labour |
Eileen Turner |
286 |
5.8 |
-0.4 |
| Majority |
247 |
5.0 |
-26.4 |
| Turnout |
4,957 |
53.4 |
|
|
Conservative gain from Liberal Democrat |
Swing |
-13.2 |
|
| Shirley South[1] |
| Party |
Candidate |
Votes |
% |
±% |
|
Independent Ratepayer |
Richard Jackson |
2,796 |
45.5 |
-8.1 |
|
Conservative |
Peter Cooke |
2,360 |
38.4 |
+0.8 |
|
Labour |
William Tooth |
992 |
16.1 |
+7.3 |
| Majority |
436 |
7.1 |
-8.9 |
| Turnout |
6,148 |
65.6 |
|
|
Independent Ratepayers hold |
Swing |
-4.4 |
| Shirley West[1] |
| Party |
Candidate |
Votes |
% |
±% |
|
Independent Ratepayers |
Benda Otton |
1,859 |
39.2 |
+39.2 |
|
Conservative |
Keith Samuels |
1,561 |
32.9 |
-20.3 |
|
Labour |
Jeffrey Potts |
1,325 |
27.9 |
+6.1 |
| Majority |
298 |
6.3 |
-21.9 |
| Turnout |
4,745 |
37.3 |
|
|
Independent Ratepayers gain from Conservative |
Swing |
+29.7 |
| Silhill[1] |
| Party |
Candidate |
Votes |
% |
±% |
|
Conservative |
George Hill |
2,629 |
50.9 |
-17.4 |
|
Labour |
Calvin Tattersall |
1,121 |
21.7 |
+8.5 |
|
Liberal Democrat |
Richard Blight |
719 |
13.9 |
-4.6 |
|
Green |
Clifford Hards |
635 |
12.3 |
+12.3 |
|
National Front |
Norman Tomkinson |
62 |
1.2 |
+1.2 |
| Majority |
1,508 |
29.2 |
-20.6 |
| Turnout |
5,166 |
54.4 |
|
|
Conservative hold |
Swing |
-13.0 |
|
| St. Alphege[1] |
| Party |
Candidate |
Votes |
% |
±% |
|
Conservative |
Fraser Mitchell |
3,443 |
66.1 |
-10.1 |
|
Green |
Adrian Mabe |
681 |
13.1 |
+13.1 |
|
Liberal Democrat |
Bernard Winchcombe |
602 |
11.6 |
-5.2 |
|
Labour |
Maurice Jones |
480 |
9.2 |
+2.2 |
| Majority |
2,762 |
53.0 |
-6.4 |
| Turnout |
5,206 |
56.4 |
|
|
Conservative hold |
Swing |
-11.6 |
|
By-elections between 1990 and 1991
| Shirley West by-election 13 December 1990[3] |
| Party |
Candidate |
Votes |
% |
±% |
|
Independent Ratepayers |
Jane Granger |
1,115 |
56.6 |
+17.4 |
|
Conservative |
Keith Samuels |
643 |
32.6 |
-0.3 |
|
Labour |
Eileen Turner |
1,325 |
10.8 |
-17.1 |
| Majority |
472 |
24.0 |
+17.7 |
| Turnout |
1,971 |
21.2 |
-16.1 |
|
Independent Ratepayers gain from Conservative |
Swing |
+29.7 |
References