Solihull Metropolitan Borough Council election, 1987
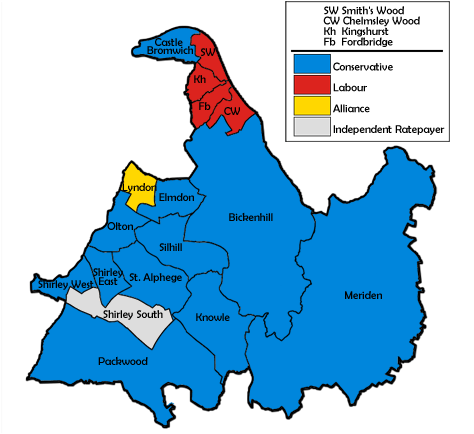
Map of the results for the 1987 Solihull council election.
The Solihull Metropolitan Borough Council elections were held on Thursday, 7 May 1987, with one third of the council to be elected. The Conservatives retained control of the council. Voter turnout was 43.2%[1][2]
Election result
| Solihull Local Election Result 1987 |
| Party |
Seats |
Gains |
Losses |
Net gain/loss |
Seats % |
Votes % |
Votes |
+/− |
| |
Conservative |
11 |
1 |
1 |
0 |
64.7 |
51.0 |
34,504 |
+10.8% |
| |
Labour |
4 |
0 |
0 |
0 |
23.5 |
17.9 |
12,130 |
-10.1% |
| |
SDP–Liberal Alliance |
1 |
1 |
0 |
+1 |
5.9 |
22.8 |
15,412 |
-0.6% |
|
Independent Ratepayers & Residents |
1 |
0 |
1 |
-1 |
5.9 |
8.1 |
5,499 |
-0.2% |
| |
National Front |
0 |
0 |
0 |
0 |
0.0 |
0.1 |
60 |
-0.0% |
This result had the following consequences for the total number of seats on the council after the elections:
| Party |
Previous council |
New council |
|
Conservatives |
29 |
29 |
|
Labour |
14 |
14 |
|
Independent Ratepayers & Residents |
6 |
5 |
|
Alliance |
2 |
3 |
| Total |
51 |
51 |
| Working majority |
7 |
7 |
Ward results
| Fordbridge[1] |
| Party |
Candidate |
Votes |
% |
±% |
|
Labour |
Angela Reid |
1,150 |
52.7 |
-28.8 |
|
Conservative |
Elizabeth Plaister |
643 |
29.4 |
+10.9 |
|
SDP–Liberal Alliance (Social Democratic) |
Bernadette Pruden |
390 |
17.9 |
+17.9 |
| Majority |
507 |
23.2 |
-39.7 |
| Turnout |
2,183 |
28.9 |
+4.7 |
|
Labour hold |
Swing |
-19.9 |
|
| Kingshurst[1] |
| Party |
Candidate |
Votes |
% |
±% |
|
Labour |
David Threlkeld |
1,362 |
52.5 |
-17.6 |
|
Conservative |
Daphne Cleghorn |
843 |
32.5 |
+2.7 |
|
SDP–Liberal Alliance (Social Democratic) |
Mark Akhurst |
387 |
14.9 |
+14.9 |
| Majority |
519 |
20.0 |
-20.3 |
| Turnout |
2,592 |
41.6 |
+6.3 |
|
Labour hold |
Swing |
-10.1 |
|
| Meriden[1] |
| Party |
Candidate |
Votes |
% |
±% |
|
Conservative |
Robert Meacham |
2,411 |
56.8 |
+10.1 |
|
SDP–Liberal Alliance (Social Democratic) |
John Johnson |
1,655 |
39.0 |
-2.7 |
|
Labour |
Eveline Benton |
176 |
4.1 |
-7.4 |
| Majority |
756 |
17.8 |
+12.7 |
| Turnout |
4,242 |
50.1 |
+8.4 |
|
Conservative hold |
Swing |
+6.4 |
|
| Packwood[1] |
| Party |
Candidate |
Votes |
% |
±% |
|
Conservative |
Timothy Vernon |
2,281 |
47.8 |
+4.3 |
|
Independent Residents |
David van Rest |
2,270 |
47.6 |
-2.3 |
|
Labour |
Sheila Brookes |
217 |
4.5 |
-2.0 |
| Majority |
11 |
0.2 |
-6.1 |
| Turnout |
4,768 |
50.9 |
+10.4 |
|
Conservative gain from Independent Residents |
Swing |
+3.3 |
| Shirley East[1] |
| Party |
Candidate |
Votes |
% |
±% |
|
Conservative |
Reginald Davies |
1,967 |
49.5 |
+10.1 |
|
SDP–Liberal Alliance (Social Democratic) |
Ernest Garwood |
854 |
21.5 |
-3.1 |
|
Independent Residents & Ratepayers |
Richard Jackson |
810 |
20.4 |
-1.4 |
|
Labour |
Margaret Brittin |
346 |
8.7 |
-5.5 |
| Majority |
1,113 |
28.0 |
+13.3 |
| Turnout |
3,977 |
40.1 |
+7.8 |
|
Conservative hold |
Swing |
+6.6 |
|
| Shirley South[1] |
| Party |
Candidate |
Votes |
% |
±% |
|
Independent Ratepayers |
James Eames |
2,419 |
47.9 |
-3.7 |
|
Conservative |
Peter Hogarth |
2,223 |
44.0 |
+8.0 |
|
Labour |
Maurice Jones |
408 |
8.1 |
-4.3 |
| Majority |
196 |
3.9 |
-11.7 |
| Turnout |
5,050 |
42.4 |
+9.3 |
|
Independent Ratepayers hold |
Swing |
-5.8 |
| Shirley West[1] |
| Party |
Candidate |
Votes |
% |
±% |
|
Conservative |
Terence Powell |
2,071 |
54.2 |
+15.3 |
|
SDP–Liberal Alliance (Liberal) |
John Reeve |
1,303 |
34.1 |
-3.1 |
|
Labour |
Christine Horton |
449 |
11.7 |
-10.3 |
| Majority |
768 |
20.1 |
+18.4 |
| Turnout |
3,823 |
39.1 |
+9.0 |
|
Conservative hold |
Swing |
+9.2 |
|
| Silhill[1] |
| Party |
Candidate |
Votes |
% |
±% |
|
Conservative |
Geoffrey Gibbons |
2,647 |
60.4 |
+12.0 |
|
SDP–Liberal Alliance (Social Democratic) |
Peter Congdon |
1,363 |
31.1 |
-6.0 |
|
Labour |
Colin Smith |
372 |
8.5 |
-6.0 |
| Majority |
1,284 |
29.3 |
+18.0 |
| Turnout |
4,382 |
42.2 |
+9.7 |
|
Conservative hold |
Swing |
+9.0 |
|
| Smith's Wood[1] |
| Party |
Candidate |
Votes |
% |
±% |
|
Labour |
Donald Cornock |
1,529 |
51.5 |
-28.0 |
|
Conservative |
Mark Saunders |
818 |
27.5 |
+7.0 |
|
SDP–Liberal Alliance (Social Democratic) |
Ann Clements |
623 |
21.0 |
+21.0 |
| Majority |
711 |
23.9 |
-35.0 |
| Turnout |
2,970 |
32.3 |
+4.2 |
|
Labour hold |
Swing |
-17.5 |
|
| St. Alphege[1] |
| Party |
Candidate |
Votes |
% |
±% |
|
Conservative |
Ronald Herd |
3,289 |
72.1 |
+12.9 |
|
SDP–Liberal Alliance (Social Democratic) |
Gomer Thomas |
1,120 |
24.6 |
-10.7 |
|
Labour |
Graham Craig |
151 |
3.3 |
-2.3 |
| Majority |
2,169 |
47.6 |
+23.6 |
| Turnout |
4,560 |
47.6 |
+13.0 |
|
Conservative hold |
Swing |
+11.8 |
|
References