Solar activity

Solar activity refers to natural phenomena occurring within the magnetically heated outer atmospheres in the Sun throughout the solar cycle. This activity takes the form of solar wind acceleration, flux emergence, light and energy particles released from the Sun such as solar flares, coronal mass ejection or solar eruptions,[1] and coronal heating; as well as sunspots which are one of the most commonly noticed forms of solar activity. Solar activity is generated due to a helical dynamo deep near the center of the Sun's mass responsible for generating strong magnetic fields; and a chaotic dynamo near the surface of the Sun which is responsible for producing smaller magnetic field fluctuations.[2]
The sum of all solar fluctuations is referred to as solar variation, and the collective effect of all solar variations on that which exists within the Sun's gravitational field is referred to as space weather. A major component of space weather is the solar wind, a stream of plasma released from the upper atmosphere of the Sun, which is responsible for the aurora, natural light displays in the sky in the Arctic and Antarctic. Disturbances in space weather can cause solar storms on Earth, disrupting technology, as well as geomagnetic storms in Earth's magnetosphere and sudden ionospheric disturbances in the ionosphere. Variations in solar intensity also affect Earth's climate, with models indicating it can explain periods of relative warmth and cold, except for the global warming in the late-20th century, which shows no relationship to solar activity. These variations can explain events such as ice ages and the Great Oxygenation Event, while the Sun's future expansion into a red giant will likely end any remaining life on Earth.
Solar activity and related events have been regularly recorded since the 8th century BCE. The Babylonians inscribed and possibly predicted solar eclipses, while the earliest extant report of sunspots dates back to the Chinese Book of Changes, c. 800 BCE. The first description of the solar corona was in 968, while the earliest sunspot drawing was in 1128, and a solar prominence was described in 1185 in the Russian Chronicle of Novgorod. Major developments that increased scientific understanding of the Sun began with the invention of the telescope, allowing the first detailed observations to be made in the 1600s. Solar spectroscopy began in the 1800s, from which properties of the solar atmosphere could be determined, while the creation of daguerreotypy allowed the sun to be photographed for the first time on 2 April 1845. Photography assisted in the study of solar prominences, granulation, and spectroscopy. Early in the 20th century, there was much interest in astrophysics in America. A number of new observatories were built with solar telescopes, both in America and elsewhere in the world. The 1931 invention of the coronagraph allowed the corona to be studied at any time in full daylight, and over the course of the twentieth century, there were many achievements and advancements in knowledge made by observatories.
Background

The Sun is a star located at the center of the Solar System. It is almost perfectly spherical and consists of hot plasma interwoven with magnetic fields.[3][4] It has a diameter of about 1,392,684 km (865,374 mi),[5] around 109 times that of Earth, and its mass (1.989×1030 kilograms, approximately 330,000 times the mass of Earth) accounts for about 99.86% of the total mass of the Solar System.[6] Chemically, about three quarters of the Sun's mass consists of hydrogen, while the rest is mostly helium. The remaining 1.69% (equal to 5,600 times the mass of Earth) consists of heavier elements, including oxygen, carbon, neon and iron, among others.[7]
The Sun formed about 4.567 billion[lower-alpha 1][8] years ago from the gravitational collapse of a region within a large molecular cloud. Most of the matter gathered in the center, while the rest flattened into an orbiting disk that would become the Solar System. The central mass became increasingly hot and dense, eventually initiating thermonuclear fusion in its core. It is thought that almost all stars form by this process.
The Sun is a G-type main-sequence star (G2V) based on spectral class and it is informally designated as a yellow dwarf because its visible radiation is most intense in the yellow-green portion of the spectrum, and although it is actually white, from the surface of the Earth it may appear yellow because of atmospheric scattering of blue light.[9] In the spectral class label, G2 indicates its surface temperature, of approximately 5778 K (5505 °C, 9941 °F), and V indicates that the Sun, like most stars, is a main-sequence star, and thus generates its energy by nuclear fusion of hydrogen nuclei into helium. In its core, the Sun fuses about 620 million metric tons of hydrogen each second.[10][11]
The mean distance of the Sun from the Earth is approximately 1 astronomical unit (about 150,000,000 km; 93,000,000 mi), though the distance varies as the Earth moves from perihelion in January to aphelion in July.[12] At this average distance, light travels from the Sun to Earth in about 8 minutes and 19 seconds. The energy of this sunlight supports almost all life[lower-alpha 2] on Earth by photosynthesis,[13] and drives Earth's climate and weather.[14] An accurate scientific understanding of the Sun developed slowly, and as recently as the 19th century prominent scientists had little knowledge of the Sun's physical composition and source of energy. This understanding is still developing; there are a number of present-day anomalies in the Sun's behavior that remain unexplained.
Solar cycle

Solar activity changes periodically in a solar cycle with an average duration of about 11 years. This cycle has been observed for hundreds of years. It causes a periodic change in the amount of irradiation from the Sun that is experienced on Earth and influences space weather, weather, and climate on Earth. It is one component of solar variation, the other being aperiodic fluctuations.
Powered by a hydromagnetic dynamo process, driven by the inductive action of internal solar flows, the solar cycle also modulates the flux of short-wavelength solar radiation, from ultraviolet to X-ray and influences the frequency of solar flares, coronal mass ejections, and other geoeffective solar eruptive phenomena.
The Sun's magnetic field structures its atmosphere and outer layers all the way through the corona and into the solar wind. Its spatiotemporal variations lead to a host of phenomena collectively known as solar activity. All of solar activity is strongly modulated by the solar magnetic cycle, since the latter serves as the energy source and dynamical engine for the former.
Types
Sunspots
Sunspots are temporary phenomena on the photosphere of the Sun that appear visibly as dark spots compared to surrounding regions. They are caused by intense magnetic activity, which inhibits convection by an effect comparable to the eddy current brake, forming areas of reduced surface temperature. They usually appear as pairs, with each sunspot having the opposite magnetic pole to the other.[15] Detailed observations of sunspots reveal patterns, not only in yearly minima and maxima but also in the relative location observed. This change in latitude of observation as related to the sunspot cycle is known as Spörer's law.
For a sunspot to be visible by the human eye it would need to be about 50,000 km in diameter, occupying an area of two billion sqare kilometers or 700 millionths of the visible solar hemisphere over 4 heliographic degrees. Based on the average solar activity over recent years approximately 100 sunspots or compact sunspot groups are visible from Earth without the use of a telescope.[lower-alpha 3][16]
Sunspots can expand and contract as they move about the surface of the Sun, and they can travel at a speed of a few hundred meters per second when they first appear.
-

Spörer's law noted that at the start of an 11-year sunspot cycle, the spots appeared first at higher latitudes and later in progressively lower latitudes.
-

A report in the Daily Mail characterized sunspot 1302 as a "behemoth" unleashing huge solar flares.
-

Detail of the Sun's surface, analog photography with a 4" Refractor, yellow glass filter and foil filter ND 4, Observatory Grosshadern, Munich
-

Detailed view of sunspot, 13 December 2006
Solar flares
A solar flare is a sudden flash of brightness observed over the Sun's surface or the solar limb, which is interpreted as a large energy release of up to 6 × 1025 joules of energy (about a sixth of the total energy output of the Sun each second or 160,000,000,000 megatons of TNT equivalent, over 25,000 times more energy than released from the impact of Comet Shoemaker–Levy 9 with Jupiter). They are often, but not always, followed by a colossal coronal mass ejection.[17] The flare ejects clouds of electrons, ions, and atoms through the corona of the Sun into space. These clouds typically reach Earth a day or two after the event.[18] The term is also used to refer to similar phenomena in other stars, where the term stellar flare applies.
Solar flares strongly influence the local space weather in the vicinity of the Earth. They can produce streams of highly energetic particles in the solar wind, known as a solar proton event. These particles can impact the Earth's magnetosphere n the form of a geomagnetic storm, and present radiation hazards to spacecraft and astronauts.
- A solar flare
-

On August 31, 2012 a long prominence/filament of solar material that had been hovering in the Sun's atmosphere, the corona, erupted out into space at 4:36 p.m. EDT.
-

Diagram of the magnetic line structure of a solar flare and its origin caused by deformation of the magnetic field lines in the Sun.
-

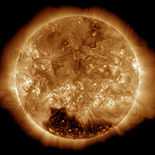
A complete 2D-Image of the Sun taken by STEREO (High Resolution)
Coronal mass ejection

A coronal mass ejection (CME) is a massive burst of solar wind and magnetic fields rising above the solar corona or being released into space.[19] Near solar maxima, the Sun produces about three CMEs every day, whereas near solar minima, there is about one CME every five days.[20] Coronal mass ejections, along with solar flares of other origin, can disrupt radio transmissions and cause damage to satellites and electrical transmission line facilities, resulting in potentially massive and long-lasting power outages.[21][22] Before automated monitoring was initiated, CME observations were recorded by visual monitoring. Historical records were collected and new observations recorded in annual summaries by the Astronomical Society of the Pacific between 1953 and 1960.[23]
Coronal mass ejections are often associated with other forms of solar activity, most notably solar flares, but a causal relationship has not been established. Most weak flares do not have associated CMEs; most powerful ones do. Most ejections originate from active regions on the Sun's surface, such as groupings of sunspots associated with frequent flares. Other forms of solar activity frequently associcated with coronal mass ejections are eruptive prominences, coronal dimming, coronal waves and Moreton waves, also called solar tsunami.
Recent scientific research[24][25] has shown that the phenomenon of magnetic reconnection is responsible for CME and solar flares. Magnetic reconnection is the name given to the rearrangement of magnetic field lines when two oppositely directed magnetic fields are brought together. This rearrangement is accompanied with a sudden release of energy stored in the original oppositely directed fields.
Prominences and filaments

A prominence is a large, bright, gaseous feature extending outward from the Sun's surface, often in a loop shape. Prominences are anchored to the Sun's surface in the photosphere, and extend outwards into the Sun's corona. While the corona consists of extremely hot ionized gases, known as plasma, which do not emit much visible light, prominences contain much cooler plasma, similar in composition to that of the chromosphere. The prominence plasma is typically a hundred times cooler and denser than the coronal plasma. A prominence forms over timescales of about a day, and prominences may persist in the corona for several weeks or months. Some prominences break apart and may then give rise to coronal mass ejections. Scientists are currently researching how and why prominences are formed. A typical prominence extends over many thousands of kilometers; the largest on record was estimated at over 800,000 kilometres (500,000 mi) long [26] – roughly the radius of the Sun.
When a prominence is viewed from a different perspective so that it is against the Sun instead of against space, it appears darker than the surrounding background. This formation is instead called a solar filament.[26] It is possible for a projection to be both a filament and a prominence. Some prominences are so powerful that they throw out matter from the Sun into space at speeds ranging from 600 km/s to more than 1000 km/s. Other prominences form huge loops or arching columns of glowing gases over sunspots that can reach heights of hundreds of thousands of kilometers. Prominences may last for a few days or even for a few months.[27]
Space weather
Space weather is the time varying environmental conditions within the Solar System, including the solar wind, and especially the space surrounding the Earth, including conditions in the near-Earth space defined by the magnetosphere down to the ionosphere and thermosphere. Space weather is distinct from the terrestrial weather of the Earth's atmosphere (troposphere and stratosphere). The science of space weather is focussed in two distinct directions: fundamental research and practical applications. The term space weather was not used until the 1990s. Prior to that time, activities now known as space weather were considered to be part of physics or aeronomy or space exploration.
Solar storms
Solar storms are caused by disturbances on the Sun, most often coronal clouds associated with coronal mass ejections (CMEs) produced by solar flares emanating from active sunspot regions, or less often from coronal holes. Most living stars produce disturbances in space weather with the field of heliophysics the science that studies such phenomena; itself primarily an interdisciplinary combination of stellar astronomy and planetary science. In the Solar System, the Sun can produce intense geomagnetic and proton storms capable of causing severe damage to technology including but not limited to large scale power outages, disruption or blackouts of radio communications (including GPS systems), and temporary or permanent disabling of satellites and other spaceborne technology. Intense solar storms may also be hazardous to high-latitude, high-altitude aviation and to human spaceflight.[28] Geomagnetic storms are the cause of aurora.[29] The most significant known solar storm occurred in September 1859 and is known as the "Carrington event".[30] The damage from the most potent solar storms is capable of threatening the stability of modern human civilization.[31]
Solar wind

The solar wind is a stream of plasma released from the upper atmosphere of the Sun. It consists of mostly electrons and protons with energies usually between 1.5 and 10 keV. The stream of particles varies in density, temperature, and speed over time and over solar longitude. These particles can escape the Sun's gravity because of their high energy, from the high temperature of the corona and magnetic, electrical and electromagnetic phenomena in it.
The solar wind is divided into two components, respectively termed the slow solar wind and the fast solar wind. The slow solar wind has a velocity of about 400 km/s, a temperature of 1.4–1.6×10⁶ K and a composition that is a close match to the corona. By contrast, the fast solar wind has a typical velocity of 750 km/s, a temperature of 8×10⁵ K and it nearly matches the composition of the Sun's photosphere.[32] The slow solar wind is twice as dense and more variable in intensity than the fast solar wind. The slow wind also has a more complex structure, with turbulent regions and large-scale structures.[33][34]
Both the fast and slow solar wind can be interrupted by large, fast-moving bursts of plasma called interplanetary coronal mass ejections, or ICMEs. ICMEs are the interplanetary manifestation of solar coronal mass ejections, which are caused by release of magnetic energy at the Sun. CMEs are often called "solar storms" or "space storms" in the popular media. They are sometimes, but not always, associated with solar flares, which are another manifestation of magnetic energy release at the Sun. ICMEs cause shock waves in the thin plasma of the heliosphere, launching electromagnetic waves and accelerating particles (mostly protons and electrons) to form showers of ionizing radiation that precede the CME.
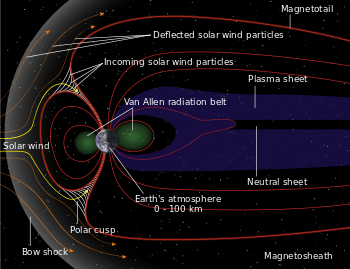
When a CME impacts the Earth's magnetosphere, it temporarily deforms the Earth's magnetic field, changing the direction of compass needles and inducing large electrical ground currents in Earth itself; this is called a geomagnetic storm and it is a global phenomenon. CME impacts can induce magnetic reconnection in Earth's magnetotail (the midnight side of the magnetosphere); this launches protons and electrons downward toward Earth's atmosphere, where they form the aurora.
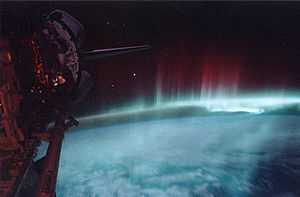
Aurora
An aurora is a natural light display in the sky, especially in the high latitude (Arctic and Antarctic) regions, caused by the collision of solar wind and magnetospheric charged particles with the high altitude atmosphere (thermosphere). Most auroras occur in a band known as the auroral zone,[35][36] which is typically 3° to 6° wide in latitude and observed at 10° to 20° from the geomagnetic poles at all local times (or longitudes), but often most vividly around the spring and autumn equinoxes. The charged particles and solar wind are directed into the atmosphere by the Earth's magnetosphere. A geomagnetic storm expands the auroral zone to lower latitudes.
Auroras are associated with the solar wind, a flow of ions continuously flowing outward from the Sun. The Earth's magnetic field traps these particles, many of which travel toward the poles where they are accelerated toward Earth. Collisions between these ions and atmospheric atoms and molecules cause energy releases in the form of auroras appearing in large circles around the poles. Auroras are more frequent and brighter during the intense phase of the solar cycle when coronal mass ejections increase the intensity of the solar wind.[37]
Geomagnetic storm
A geomagnetic storm is a temporary disturbance of the Earth's magnetosphere caused by a solar wind shock wave and/or cloud of magnetic field which interacts with the Earth's magnetic field. The increase in the solar wind pressure initially compresses the magnetosphere and the solar wind's magnetic field interacts with the Earth’s magnetic field and transfers an increased energy into the magnetosphere. Both interactions cause an increase in movement of plasma through the magnetosphere, and an increase in electric current in the magnetosphere and ionosphere.
The disturbance in the interplanetary medium which drives the geomagnetic storm may be due to a solar coronal mass ejection (CME) or a high speed stream (co-rotating interaction region or CIR)[38] of the solar wind originating from a region of weak magnetic field on the Sun’s surface. The frequency of geomagnetic storms increases and decreases with the sunspot cycle. CME driven storms are more common during the maximum of the solar cycle and CIR driven storms are more common during the minimum of the solar cycle.
There are several space weather phenomena which tend to be associated with or are caused by a geomagnetic storm. These include: Solar Energetic Particle (SEP) events, geomagnetically induced currents (GIC), ionospheric disturbances which cause radio and radar scintillation, disruption of navigation by magnetic compass and auroral displays at much lower latitudes than normal. In 1989, a geomagnetic storm energized ground induced currents which disrupted electric power distribution throughout most of the province of Quebec[39] and caused aurorae as far south as Texas.[40]
Sudden ionospheric disturbance
A sudden ionospheric disturbance is an abnormally high ionization/plasma density in the D region of the ionosphere caused by a solar flare. The SID results in a sudden increase in radio-wave absorption that is most severe in the upper medium frequency (MF) and lower high frequency (HF) ranges, and as a result often interrupts or interferes with telecommunications systems.[41]
Geomagnetically induced currents
Geomagnetically induced currents are a manifestation at ground level of space weather, which affect the normal operation of long electrical conductor systems. During space weather events, electric currents in the magnetosphere and ionosphere experience large variations, which manifest also in the Earth's magnetic field. These variations induce currents (GIC) in conductors operated on the surface of Earth. Electric transmission grids and buried pipelines are common examples of such conductor systems. GIC can cause problems, such as increased corrosion of pipeline steel and damaged high-voltage power transformers.
Effect on climate
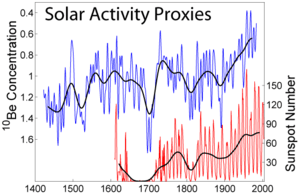
The role of solar activity in climate change has also been calculated over longer time periods using "proxy" datasets, such as tree rings.[42] Models indicate that solar and volcanic forcings can explain periods of relative warmth and cold between A.D. 1000 and 1900, but human-induced forcings are needed to reproduce the late-20th century warming.[43]
Both long- and short-term variations in solar intensity are known to affect global climate. A 2010 study suggests "that the effects of solar variability on temperature throughout the atmosphere may be contrary to current expectations."[44]
Long-term effects
Three to four billion years ago the Sun emitted only 70% of the power it radiates today. If the atmospheric composition had been the same as today, liquid water should not have existed on Earth. However, there is evidence for the presence of water on the early Earth, in the Hadean[45][46] and Archean[47][45] eons, leading to what is known as the faint young Sun paradox.[48] Hypothesized solutions to this paradox include a vastly different atmosphere, with much higher concentrations of greenhouse gases than currently exist.[49] Over the following approximately 4 billion years, the energy output of the Sun increased and atmospheric composition changed. The Great Oxygenation Event – oxygenation of the atmosphere around 2.4 billion years ago – was the most notable alteration. Over the next five billion years the Sun's ultimate death as it becomes a red giant and then a white dwarf will have large effects on climate, with the red giant phase possibly ending any life on Earth that survives until that time.
Short-term effects
_and_the_Sun's_energy_received_at_the_top_of_Earth's_atmosphere_(red%2C_bottom)._Solar_energy_has_been_measured_by_satellites_since_1978.gif)
Solar output varies on shorter time scales, including the 11-year solar cycle[50] and longer-term modulations.[51] The changes also have aperiodic fluctuations.[52] Solar intensity variations are considered to have been influential in triggering the Little Ice Age,[53] and some of the warming observed from 1900 to 1950. The cyclical nature of the Sun's energy output is not yet fully understood; it differs from the very slow change that is happening within the Sun as it ages and evolves.
In recent decades, solar activity has been measured by satellites, while before it was estimated using 'proxy' variables. Scientists studying climate change are interested in understanding the effects of variations in the total and spectral solar irradiance on Earth and its climate. Research indicates that solar variability has had effects including the Maunder minimum from 1645 to 1715 A.D., part of the Little Ice Age from 1550 to 1850 A.D. that was marked by relative cooling and greater glacier extent than the centuries before and afterward.[54][55] Some studies point toward solar radiation increases from cyclical sunspot activity affecting global warming, and climate may be influenced by the sum of all effects (solar variation, anthropogenic radiative forcings, etc.).[56][57]
.png)
The role of the Sun in recent climate change has been looked at by climate scientists. Since 1978, output from the Sun has been measured by satellites [58]:6 significantly more accurately than was previously possible from the surface. These measurements indicate that the Sun's total solar irradiance has not increased since 1978, so the warming during the past 30 years cannot be directly attributed to an increase in total solar energy reaching the Earth (see graph above, right). In the three decades since 1978, the combination of solar and volcanic activity probably had a slight cooling influence on the climate.[59]
Climate models have been used to examine the role of the Sun in recent climate change.[60] Models are unable to reproduce the rapid warming observed in recent decades when they only take into account variations in total solar irradiance and volcanic activity. Models are, however, able to simulate the observed 20th century changes in temperature when they include all the most important external forcings, including human influences and natural forcings. As has already been stated, Hegerl et al. (2007) concluded that greenhouse gas forcing had "very likely" caused most of the observed global warming since the mid-20th century. In making this conclusion, Hegerl et al. (2007) allowed for the possibility that climate models had been underestimating the effect of solar forcing.[61]
Another line of evidence against the Sun having caused recent climate change comes from looking at how temperatures at different levels in the Earth's atmosphere have changed.[62] Models and observations (see figure on the left) show that greenhouse gas results in warming of the lower atmosphere at the surface (called the troposphere) but cooling of the upper atmosphere (called the stratosphere).[63] Depletion of the ozone layer by chemical refrigerants has also resulted in a cooling effect in the stratosphere. If the Sun was responsible for observed warming, warming of the troposphere at the surface and warming at the top of the stratosphere would be expected as increase solar activity would replenish ozone and oxides of nitrogen.[64]
Observation history
Early reports
Solar activity and related events have been regularly recorded since the time of the Babylonians.[65] In the 8th century BCE,[65] they inscribed solar eclipses, and possibly predicted them from numerological rules. The earliest extant report of sunspots dates back to the Chinese Book of Changes, c. 800 BCE. The phrases used in the book translate to "A dou is seen in the Sun" and "A mei is seen in the Sun", where dou and mei would be darkening or obscuration (based on the context). Observations were regularly noted by Chinese and Korean astronomers, but only at the behest of the emperors, rather than systematically for their own sake.[65]
The first unambiguous mention of the solar corona was by Leo Diaconus, a Byzantine historian. He wrote of the 22 December 968 total eclipse, which he experienced in Constantinople (modern-dauy Istanbul, Turkey):[66]
...at the fourth hour of the day ... darkness covered the earth and all the brightest stars shone forth. And it was possible to see the disk of the Sun, dull and unlit, and a dim and feeble glow like a narrow band shining in a circle around the edge of the disk.—Leo Diaconus[66]

The earliest known record of a sunspot drawing was in 1128, by John of Worcester.[67]
In the third year of Lothar, emperor of the Romans, in the twenty-eighth year
of King Henry of the English...on Saturday, 8 December, there appeared from the
morning right up to the evening two black spheres against the sun.
Another early observation was that of Solar prominences, described in 1185 in the Russian Chronicle of Novgorod.[66]
"In the evening there as an eclipse of the sun. It was getting very gloomy and stars were seen ... The sun became similar in appearance to the moon and from its horns came out somewhat like live embers."
Telescopic era

Soon after the invention of the telescope, multiple astronomers observed the sun with it in the early 1600s, including Johannes Fabricius in Germany, Thomas Harriot in England, Galileo Galilei in Italy, and Christoph Scheiner in Germany. Harriot was the first to observe sunspots in 1610, while in 1611 the first results were published by Fabricius, who reasoned that ostensible movement of sunspots was actually due to axial rotation of the sun. Fabricius, who observed the sun together with his father David Fabricius, a pastor and astronomer, used camera obscura telescopy to save their eyes and get a better view of the solar disk. In a dark room they would study a projection of the sun on a white paper and observed the movement of the spots. Even before Fabricius, Giordano Bruno and Johannes Kepler had already suggested the idea that the sun rotates around its own axis.[69] Galileo and Scheiner were the most involved astronomers and were the most active in trying to deduce the sun's physical properties. While Scheiner had initially contended in 1612 that the spots were planets nearer to the sun than Mercury, Galileo is credited with the first convincing argument, published in 1613, that sunspots were features on the sun's surface – a position Scheiner later agreed with.[66] Between 1645 to 1715, a period now known as the Maunder minimum, sunspots became quite infrequent phenomena. There were several diligent observers, such as Johannes Hevelius, Jean Picard, and Jean Dominique Cassini, and a similar decrease in auroral counts, indicating that the lack of sunspots was genuine, and not just a lack of observation.[66]
19th century
Further scientific developments occurred in the 1800s. While Isaac Newton had demonstrated the splitting of visible light through a prism via refraction in the 1660s, solar spectrometry only began in 1817, after the detection of infra-red radiation by William Herschel in 1800, and of ultraviolet radiation by William Hyde Wollaston in 1801. Wollaston also undertook the first steps towards solar spectroscopy, by noticing that dark lines appeared in the spectrum of the sun when viewed through a glass prism. Joseph von Fraunhofer independently discovered those "dark lines" 15 years later, and for his more detailed study the lines were named Fraunhofer lines after him. Other physicists discerned that from the lines, properties of the solar atmosphere could be determined. Some notable scientists to make spectroscopy part of mainstream science were David Brewster, Gustav Kirchhoff, Robert Wilhelm Bunsen, and Anders Jonas Ångström.[70]
From 1826, Samuel Heinrich Schwabe, a German amateur astronomer, made detailed observations of sunspots, believing that they were the shadows of nearby planets. He did not find any planets in seventeen years, but did discover the cyclical nature of the average number of sunspots on the sun, then estimated to have a 10-year period. Swiss astronomer Rudolf Wolf then researched past sunspot observations as far back as the 1755–1766 cycle, now known as "Cycle 1". He also established in 1848 a relative sunspot number formulation to compare the work of different astronomers using varying equipment and methodologies. That number is now known as the Wolf (or Zürich) sunspot number. Around 1852, four scientists – Edward Sabine, Rudolf Wolf, Jean-Alfred Gautier, and Johann von Lamont – all determined, independent of each other, that there was a link between the sunspot cycle and geomagnetic activity, sparking the first research into interactions between the Sun and the Earth.[70]
The invention of daguerreotypy by J. N. Niepce and Louis Daguerre in 1839 allowed the sun to photographed for the first time, on 2 April 1845 by French physicists Louis Fizeau and Léon Foucault. Sunspots, as well as the limb darkening effect, are visible in their daguerrotype. From 1858, a specialised solar telescope in Kew, England was used to make daily photographs of sun, under direction of Warren De la Rue. Photography assisted in the study of solar prominences, granulation, and spectroscopy. Charles A. Young was the first solar photographer to capture a prominence in 1870, and Jules Janssen in Meudon, near Paris, made significant advances in these fields. Solar eclipses were also photographed, with the most useful early images taken on 28 July 1851 by Berkowski at the Königsberg observatory in Prussia (modern-day Kalinigrad, Russia) and on 18 July 1860 by De la Rue's team in Spain.[70]
The first modern, and clearly described, accounts of a solar flare and coronal mass ejection occurred in 1859 and 1860 respectively. On 1 September 1859, Richard C. Carrington, while observing sunspots, saw patches of increasingly bright light within a group of sunspots, which then dimmed and moved across that area within a few minutes. This event, also reported by another astronomer, R. Hodgson, is a description of a solar flare. The widely viewed total solar eclipse on 18 July 1860 resulted in many drawings, depicting an anomalous feature that corresponds with modern observations of coronal mass ejections.[70]
While nineteenth century astronomers could track sunspots with reasonable accuracy, the derived period of the sun's rotation varied between 25 and 28 days – a relatively large inaccuracy. The cause was determined in 1858 by two scientists independently: Richard C. Carrington in England and Gustav Spörer in Germany discovered that the latitude with the most sunspots decreases from 40° to 5° during each sunspot cycle, and that at higher latitudes sunspots rotate more slowly. This led to the conclusion that the sun rotates differentially, and that at least the outer layer must be fluid. Advancements in spectrometry confirmed this was true, including in latitudes without sunspots, with the first results obtained in 1871 by Hermann Vogel, and shortly thereafter by Charles Young. Nils Dúner's spectroscopic observtion in the 1880s showed that there was a 30% difference between the sun's faster equatorial regions and its slower polar regions.[70]
20th century
Early in the 20th century, there was much interest in astrophysics in America, and a number of new observatories were built.[71]:320 Solar telescopes (and thus, solar observatories), were installed at Mount Wilson Observatory in California in 1904,[71]:324 and in the 1930s at McMath-Hulbert Observatory.[72] There was also interest in other parts of the world, with the establishment of the Kodaikanal Solar Observatory in India at the turn of the century,[73] the Einsteinturm in Germany in 1924,[74] and the Solar Tower Telescope at the National Observatory of Japan in 1930.[75]
In 1907–08, George Ellery Hale uncovered the sun's magnetic cycle and magnetic nature of sunspots. A decade later, via empirical observation, Hale and his colleagues deduced three rules regarding the magnetic polarity of sunspots, which are now known as Hale's polarity laws.[70] Until the 1930s, little progress had been made on understanding the Sun's corona, as it could only be viewed during total solar eclipses, which are rare occurrences often best observed from remote locations. Bernard Lyot's 1931 invention of the coronagraph – a telescope with an attachment to block out the direct light of the solar disk – allowed the corona to be studied at anytime in full daylight.[70]
The Sun was, until the 1990s, the only star whose surface had been resolved.[76] Other major achievements and advancements in scientific knowledge made by observatories in the 20th century, as noted in a report to the US National Research Council in 1998, included:[77]
- Elucidation in detail of the remarkable structure of the Sun's X-ray-emitting loops
- Direct observation of the expanding corona and solar wind
- The discovery that the Sun's brightness varies with its level of activity, and verification of this effect in other solar-type stars
- The discovery that the magnetic fields of a star like the sun are in an intense fibril state at the visible surface
- The inference from the dynamics of rising azimuthal flux bundles that there are magnetic fields of 0.5×10⁵ to 1×10⁵ gauss at the base of the conductive zone, presumable in some fibril form
- The discovery of the low-level emission of electron neutrinos from the thermonuclear core of the Sun
— National Research Council Task Group on Ground-based Solar Research[77]
See also
- Attribution of recent climate change (section Solar activity)
- Climate change (section Solar output)
- Global warming (section Solar activity)
- List of articles related to the Sun
- Outline of astronomy
- Solar variation
Notes
- ↑ All numbers in this article are short scale. One billion is 109, or 1,000,000,000.
- ↑ Hydrothermal vent communities live so deep under the sea that they have no access to sunlight. Bacteria instead use sulfur compounds as an energy source, via chemosynthesis.
- ↑ This is based on the hypothesis that the average human eye may have a resolution of 3.3×10⁻⁴ radians or 70 arc seconds, with a 1.5 millimetres (0.059 in) maximum pupil dilation in relatively bright light.[16]
References
- ↑ Siscoe, edited by Carolus J. Schrijver, George L. (2010). Heliophysics : evolving solar activity and the climates of space and earth (1. publ. ed.). Cambridge: Cambridge University Press. ISBN 9780521112949. Retrieved 28 August 2014.
- ↑ Giampapa, Mark S; Hill, Frank; Norton, Aimee A; Pevtsov, Alexei A. "Causes of Solar Activity" (PDF). A Science White Paper for the Heliophysics 2010 Decadal Survey: 1. Retrieved 26 August 2014.
- ↑ "How Round is the Sun?". NASA. 2 October 2008. Retrieved 7 March 2011.
- ↑ "First Ever STEREO Images of the Entire Sun". NASA. 6 February 2011. Retrieved 7 March 2011.
- ↑ Emilio, M.; Kuhn, J. R.; Bush, R. I.; Scholl, I. F. (2012). "Measuring the Solar Radius from Space during the 2003 and 2006 Mercury Transits". The Astrophysical Journal 750 (2): 135. arXiv:1203.4898. Bibcode:2012ApJ...750..135E. doi:10.1088/0004-637X/750/2/135.
- ↑ Woolfson, M. (2000). "The origin and evolution of the solar system". Astronomy & Geophysics 41 (1): 12. Bibcode:2000A&G....41a..12W. doi:10.1046/j.1468-4004.2000.00012.x.
- ↑ Basu, S.; Antia, H. M. (2008). "Helioseismology and Solar Abundances". Physics Reports 457 (5–6): 217. arXiv:0711.4590. Bibcode:2008PhR...457..217B. doi:10.1016/j.physrep.2007.12.002.
- ↑ Connelly, James N.; Bizzarro, Martin; Krot, Alexander N.; Nordlund, Åke; Wielandt, Daniel; Ivanova, Marina A. (2 November 2012). "The Absolute Chronology and Thermal Processing of Solids in the Solar Protoplanetary Disk". Science 338 (6107): 651–655. Bibcode:2012Sci...338..651C. doi:10.1126/science.1226919. PMID 23118187.
- ↑ Wilk, S. R. (2009). "The Yellow Sun Paradox". Optics & Photonics News: 12–13.
- ↑ Phillips, K. J. H. (1995). Guide to the Sun. Cambridge University Press. pp. 47–53. ISBN 978-0-521-39788-9.
- ↑ Karl S. Kruszelnicki (17 April 2012). "Dr Karl's Great Moments In Science: Lazy Sun is less energetic than compost". Australian Broadcasting Corporation. Retrieved 25 February 2014.
Every second, the Sun burns 620 million tonnes of hydrogen...
- ↑ "Equinoxes, Solstices, Perihelion, and Aphelion, 2000–2020". US Naval Observatory. 31 January 2008. Retrieved 17 July 2009.
- ↑ Simon, A. (2001). The Real Science Behind the X-Files : Microbes, meteorites, and mutants. Simon & Schuster. pp. 25–27. ISBN 0-684-85618-2.
- ↑ Portman, D. J. (1952-03-01). "Review of Cycles in Weather and Solar Activity. by Maxwell O. Johnson". The Quarterly Review of Biology 27 (1): 136–137. doi:10.1086/398866. JSTOR 2812845.
- ↑ "Sunspots". NOAA. Retrieved 22 February 2013.
- ↑ 16.0 16.1 Kennwell, John (2014). "Naked Eye Sunspots". Bureau of Meteorology. Commonwealth of Australia. Retrieved 29 August 2014.
- ↑ Kopp, G.; Lawrence, G; Rottman, G. (2005). "The Total Irradiance Monitor (TIM): Science Results". Solar Physics 20 (1–2): 129–139. Bibcode:2005SoPh..230..129K. doi:10.1007/s11207-005-7433-9.
- ↑ Menzel, Whipple, and de Vaucouleurs, "Survey of the Universe", 1970
- ↑ Christian, Eric R. (5 March 2012). "Coronal Mass Ejections". NASA.gov. Retrieved 9 July 2013.
- ↑ Nicky Fox. "Coronal Mass Ejections". Goddard Space Flight Center @ NASA. Retrieved 2011-04-06.
- ↑ Baker, Daniel N. et al. (2008). Severe Space Weather Events – Understanding Societal and Economic Impacts: A Workshop Report. National Academies Press. p. 77. ISBN 978-0-309-12769-1.
- ↑ Wired world is increasingly vulnerable to coronal ejections from the Sun, Aviation Week & Space Technology, 14 January 2013 issue, pp. 49–50: "But the most serious potential for damage rests with the transformers that maintain the proper voltage for efficient transmission of electricity through the grid."
- ↑ Astronomical Society of the Pacific Visual Records
- Nicholson, Seth B. (1954). "SOLAR ACTIVITY IN 1953". Publications of the Astronomical Society of the Pacific 66 (389): –55–57. doi:10.1086/126653. ISSN 0004-6280. JSTOR 40672795.
- Cragg, Thomas A. (1955). "SOLAR ACTIVITY IN 1954". Publications of the Astronomical Society of the Pacific 67 (395): –99–101. doi:10.1086/126771. ISSN 0004-6280. JSTOR 40672921.
- Nicholson, Seth B. (1956). "SOLAR ACTIVITY IN 1955". Publications of the Astronomical Society of the Pacific 68 (401): –146–148. doi:10.1086/126899. ISSN 0004-6280. JSTOR 40673035.
- Cragg, Thomas (1957). "SOLAR ACTIVITY IN 1956". Publications of the Astronomical Society of the Pacific 69 (407): –166–168. doi:10.1086/127038. ISSN 0004-6280. JSTOR 40676393.
- Cragg, Thomas (1958). "SOLAR ACTIVITY IN 1957". Publications of the Astronomical Society of the Pacific 70 (414): –299–302. doi:10.1086/127227. ISSN 0004-6280. JSTOR 40673342.
- Cragg, Thomas A. (1959). "SOLAR ACTIVITY IN 1958". Publications of the Astronomical Society of the Pacific 71 (420): –212–215. doi:10.1086/127366. ISSN 0004-6280. JSTOR 40673498.
- Cragg, Thomas A. (1960). "SOLAR ACTIVITY IN 1959". Publications of the Astronomical Society of the Pacific 72 (426): –200–203. doi:10.1086/127509. ISSN 0004-6280. JSTOR 40676961.
- Cragg, Thomas A. (1961). "SOLAR ACTIVITY IN 1960". Publications of the Astronomical Society of the Pacific 73 (432): –198–201. doi:10.1086/127655. ISSN 0004-6280. JSTOR 40673546.
- ↑ "Coronal Mass Ejections: Scientists Unlock the Secrets of Exploding Plasma Clouds On the Sun". Science Daily.
- ↑ NASA Science
- ↑ 26.0 26.1 Atkinson, Nancy (August 6, 2012). "Huge Solar Filament Stretches Across the Sun". Universe Today. Retrieved August 11, 2012.
- ↑ "About Filaments and Prominences". Retrieved 2010-01-02.
- ↑ Phillips, Tony (21 Jan 2009). "Severe Space Weather--Social and Economic Impacts". NASA Science News. National Aeronautics and Space Administration. Retrieved 2014-05-07.
- ↑ "NOAA Space Weather Scales". NOAA Space Weather Prediction Center. 1 Mar 2005. Retrieved 2014-05-07.
- ↑ Bell, Trudy E.; T. Phillips (6 May 2008). "A Super Solar Flare". NASA Science News. National Aeronautics and Space Administration. Retrieved 2014-05-07.
- ↑ Kappenman, John (2010). Geomagnetic Storms and Their Impacts on the U.S. Power Grid (PDF). META-R 319. Goleta, CA: Metatech Corporation for Oak Ridge National Laboratory. OCLC 811858155.
- ↑ Feldman, U.; Landi, E.; Schwadron, N. A. (2005). "On the sources of fast and slow solar wind". Journal of Geophysical Research 110 (A7): A07109.1–A07109.12. Bibcode:2005JGRA..11007109F. doi:10.1029/2004JA010918.
- ↑ Kallenrode, May-Britt (2004). Space Physics: An Introduction to Plasmas and. Springer. ISBN 3-540-20617-5.
- ↑ Suess, Steve (June 3, 1999). "Overview and Current Knowledge of the Solar Wind and the Corona". The Solar Probe. NASA/Marshall Space Flight Center. Archived from the original on 2008-06-10. Retrieved 2008-05-07.
- ↑ Feldstein, Y. I. (1963). "Some problems concerning the morphology of auroras and magnetic disturbances at high latitudes". Geomagnetism and Aeronomy 3: 183–192. Bibcode:1963Ge&Ae...3..183F.
- ↑ Feldstein, Y. I. (1986). "A Quarter Century with the Auroral Oval". EOS 67 (40): 761. Bibcode:1986EOSTr..67..761F. doi:10.1029/EO067i040p00761-02.
- ↑ National Aeronautics and Space Administration, Science Mission Directorate (2009). "Space Weather 101". Mission:Science. Retrieved 2014-08-30.
- ↑ Corotating Interaction Regions, Corotating Interaction Regions Proceedings of an ISSI Workshop, 6–13 June 1998, Bern, Switzerland, Springer (2000), Hardcover, ISBN 978-0-7923-6080-3, Softcover, ISBN 978-90-481-5367-1
- ↑ "Scientists probe northern lights from all angles". CBC. 22 October 2005.
- ↑ "Earth dodges magnetic storm". New Scientist. 24 June 1989.
- ↑ Federal Standard 1037C Glossary of Telecommunications Terms, http://www.its.bldrdoc.gov/fs-1037/fs-1037c.htm, retrieved 2011 Dec 15
- ↑ Simmon, R. and D. Herring (November 2009). "Notes for slide number 5 titled "Over 100 years of total solar irradiance data," in presentation, "Human contributions to global climate change"". Presentation library on the U.S. National Oceanic and Atmospheric Administration's Climate Services website. Archived from the original on 3 July 2011. Retrieved 2011-06-23.
- ↑ Committee on Surface Temperature Reconstructions for the Last 2,000 Years, US National Research Council (2006). "10. Climate Forcings and Climate Models". Surface Temperature Reconstructions for the Last 2,000 Years. Washington, D.C., USA: National Academy Press. p. 109. ISBN 0-309-66144-7. Retrieved 2011-06-23.
- ↑ Haigh, Joanna D.; Winning, Ann R.; Toumi, Ralf; Harder, Jerald W. (2010-10-07). "An influence of solar spectral variations on radiative forcing of climate". Nature 467 (7316): 696–9. Bibcode:2010Natur.467..696H. doi:10.1038/nature09426. ISSN 0028-0836. PMID 20930841.
Currently there is insufficient observational evidence to validate the spectral variations observed by SIM, or to fully characterize other solar cycles, but our findings raise the possibility that the effects of solar variability on temperature throughout the atmosphere may be contrary to current expectations.
- ↑ 45.0 45.1 Marty, B. (2006). "Water in the Early Earth". Reviews in Mineralogy and Geochemistry 62: 421. doi:10.2138/rmg.2006.62.18.
- ↑ Watson, E. B.; Harrison, TM (2005). "Zircon Thermometer Reveals Minimum Melting Conditions on Earliest Earth". Science 308 (5723): 841–4. doi:10.1126/science.1110873. PMID 15879213.
- ↑ Hagemann, Steffen G.; Gebre-Mariam, Musie; Groves, David I. (1994). "Surface-water influx in shallow-level Archean lode-gold deposits in Western, Australia". Geology 22 (12): 1067. doi:10.1130/0091-7613(1994)022<1067:SWIISL>2.3.CO;2.
- ↑ Sagan, C.; G. Mullen (1972). Earth and Mars: Evolution of Atmospheres and Surface Temperatures.
- ↑ Sagan, C.; Chyba, C (1997). "The Early Faint Sun Paradox: Organic Shielding of Ultraviolet-Labile Greenhouse Gases". Science 276 (5316): 1217–21. doi:10.1126/science.276.5316.1217. PMID 11536805.
- ↑ Willson, Richard C.; Hudson, Hugh S. (1991). "The Sun's luminosity over a complete solar cycle". Nature 351 (6321): 42. Bibcode:1991Natur.351...42W. doi:10.1038/351042a0.
- ↑ Willson, Richard C. (2003). "Secular total solar irradiance trend during solar cycles 21–23". Geophysical Research Letters 30 (5). Bibcode:2003GeoRL..30.1199W. doi:10.1029/2002GL016038.
- ↑ Active Cavity Radiometer Irradiance Monitor (ACRIM) total solar irradiance monitoring 1978 to present (Satellite observations of total solar irradiance); access date 2012-02-03
- ↑ "Solar Irradiance Changes and the Relatively Recent Climate". Solar influences on global change. Washington, D.C: National Academy Press. 1994. p. 36. ISBN 0-309-05148-7.
- ↑ "Glossary I-M". NASA Earth Observatory. Retrieved 28 February 2011.
- ↑ Bard, Edouard; Raisbeck, Grant; Yiou, Françoise; Jouzel, Jean (2000). "Solar irradiance during the last 1200 years based on cosmogenic nuclides". Tellus B 52 (3): 985. doi:10.1034/j.1600-0889.2000.d01-7.x.
- ↑ "NASA Study Finds Increasing Solar Trend That Can Change Climate". 2003.
- ↑ Svensmark, Henrik; Bondo, Torsten; Svensmark, Jacob (2009). "Cosmic ray decreases affect atmospheric aerosols and clouds". Geophysical Research Letters 36 (15): n/a. Bibcode:2009GeoRL..3615101S. doi:10.1029/2009GL038429.
- ↑ US National Research Council (2008). Understanding and responding to climate change: Highlights of National Academies Reports, 2008 edition (PDF). 500 Fifth St. N.W., Washington, D.C. 20001: National Academy of Sciences. Retrieved 2011-05-20.
- ↑ Global Climate Change, in Karl & others 2009, pp. 15–16.
- ↑ Hegerl, et al., Chapter 9: Understanding and Attributing Climate Change, Frequently Asked Question 9.2: Can the Warming of the 20th century be Explained by Natural Variability?, in IPCC AR4 WG1 2007.
- ↑ Hegerl, et al., Chapter 9: Understanding and Attributing Climate Change, Executive Summary, in IPCC AR4 WG1 2007.
- ↑ Simmon, R. and D. Herring (November 2009). "Notes for slide number 7, titled "Satellite evidence also suggests greenhouse gas warming," in presentation, "Human contributions to global climate change"". Presentation library on the U.S. National Oceanic and Atmospheric Administration's Climate Services website. Archived from the original on 3 July 2011. Retrieved 2011-06-23.
- ↑ Hegerl et al., Chapter 9: Understanding and Attributing Climate Change, Frequently Asked Question 9.2: Can the Warming of the 20th century be Explained by Natural Variability?, in IPCC AR4 WG1 2007.
- ↑ Karl & others 2009, p. 20.
- ↑ 65.0 65.1 65.2 "History of Solar Physics: A Time Line of Great Moments: 1223 BC–250 BC". High Altitude Observatory. University Corporation for Atmospheric Research. Retrieved 15 August 2014.
- ↑ 66.0 66.1 66.2 66.3 66.4 66.5 "History of Solar Physics: A Time Line of Great Moments: 0–1599". High Altitude Observatory. University Corporation for Atmospheric Research. Retrieved 15 August 2014.
- ↑ 67.0 67.1 John of Worcester (1128). The Chronicle of John of Worcester (MS 157 ed.). Corpus Christi College, Oxford: John of Worcester. p. 380.
- ↑ Helden, Albert van (1996-09-01). "Galileo and Scheiner on Sunspots: A Case Study in the Visual Language of Astronomy". Proceedings of the American Philosophical Society 140 (3): 358–396. JSTOR 987314.
- ↑ The Galileo Project. David (1564-1617) and Johannes (1587-1616) Fabricius
- ↑ 70.0 70.1 70.2 70.3 70.4 70.5 70.6 "History of Solar Physics: A Time Line of Great Moments: 1800–1999". High Altitude Observatory. University Corporation for Atmospheric Research. Retrieved 15 August 2014.
- ↑ 71.0 71.1 King, Henry C. (2003). The history of the telescope. Mineola, N.Y.: Dover Publications. ISBN 0486432653.
- ↑ "History". Mcmath-Hulbert Solar Observatory. Retrieved 30 August 2014.
- ↑ "Kodaikanal Observatory". Indian Institute of Astrophysics. 2 July 2014. Retrieved 30 August 2014.
- ↑ Ouellette, Jennifer (7 March 2011). "Einstein's Not-So-Ivory Tower". Discovery News. Retrieved 30 August 2014.
- ↑ "Solar Tower Telescope". National Observatory of Japan. 14 February 2005. Archived from the original on 10 March 2006. Retrieved 30 August 2014.
- ↑ Burns, D.; Baldwin, J. E.; Boysen, R. C.; Haniff, C. A.; et al. (September 1997). "The surface structure and limb-darkening profile of Betelgeuse" (PDF). Monthly Notices of the Royal Astronomical Society 290 (1): L11–L16. Bibcode:1997MNRAS.290L..11B. doi:10.1093/mnras/290.1.l11.
- ↑ 77.0 77.1 National Research Council (U.S.). Task Group on Ground-based Solar Research (1998). Ground-based Solar Research: An Assessment and Strategy for the Future. Washington D.C.: National Academy Press. p. 10.
External links
- Today's Space Weather – from the National Oceanic and Atmospheric Administration (United States)
- IPS Daily Solar and Geophysical Report – from the Bureau of Meteorology (Australia)
- Latest Space Weather Data – from the Solar Influences Data Analysis Center (Belgium)
- Latest images from Big Bear Solar Observatory (California)
- The Very Latest SOHO Images – from the ESA/NASA Solar & Heliospheric Observatory
| |||||||||||||||||||||||||||||||||||||||