Sheffield City Council election, 2006
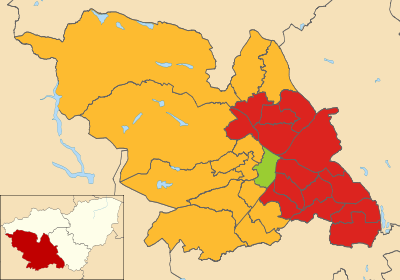
Map of the results of the 2006 Sheffield council election.
Labour in red, Liberal Democrats in yellow and the
Greens in green.
Sheffield City Council elections took place on Thursday 4 May 2006 with polling stations open between 7am and 10pm. One third of council seats were up for election; one in each ward, plus one additional seat in Ecclesall due to a resignation. The overall turnout this year was 34.5%, down considerably from the previous year's general election turnout at 43.9 per cent turnout in Sheffield.[1]
Councillors before and after the election
| Ward | Incumbent Elected | Incumbent | Elected |
| Arbourthorne |
2004 |
Timothy Rippon |
Timothy Rippon |
| Beauchief & Greenhill |
2004 |
Clive Skelton |
Clive Skelton |
| Beighton |
2004 |
Helen Mirfin-Boukouris |
Helen Mirfin-Boukouris |
| Birley |
2004 |
Michael Pye |
Michael Pye |
| Broomhill |
2004 |
Shaffaq Mohammed |
Shaffaq Mohammed |
| Burngreave |
2004 |
Steve Jones |
Steve Jones |
| Central |
2004 |
Mohammad Azim |
Bernard Little |
| Crookes |
2004 |
Sylvia Anginotti |
Sylvia Anginotti |
| Darnall |
2004 |
Mohammad Altaf |
Mazher Iqbal |
| Dore & Totley |
2004 |
Keith Hill |
Keith Hill |
| East Ecclesfield |
2004 |
Graham Oxley |
Graham Oxley |
| Ecclesall 1 |
2004 |
Roger Davison |
Roger Davison |
| Ecclesall 2 |
2004 |
Kate Dawson |
Michael Reynolds |
| Firth Park |
2004 |
Alan Law |
Alan Law |
| Fulwood |
2004 |
Janice Sidebottom |
Janice Sidebottom |
| Gleadless Valley |
2004 |
Garry Weatherall |
Garry Weatherall |
| Graves Park |
2004 |
Barrie Jervis |
Robert McCann |
| Hillsborough |
2004 |
Janet Bragg |
Janet Bragg |
| Manor Castle |
2004 |
Janet Wilson |
Janet Wilson |
| Mosborough |
2004 |
Samuel Wall |
Samuel Wall |
| Nether Edge |
2004 |
Patricia White |
Patricia White |
| Richmond |
2004 |
Terry Barrow |
Elizabeth Naylor |
| Shiregreen & Brightside |
2004 |
Peter Rippon |
Peter Rippon |
| Southey |
2004 |
Gillian Furniss |
Gillian Furniss |
| Stannington |
2004 |
David Baker |
David Baker |
| Stocksbridge & Upper Don |
2004 |
Alison Brelsford |
Alison Brelsford |
| Walkley |
2004 |
Jonathan Harston |
Jonathan Harston |
| West Ecclesfield |
2004 |
Trevor Bagshaw |
Trevor Bagshaw |
| Woodhouse |
2004 |
Raymond Satur |
Raymond Satur |
Election result
| Sheffield City Council Election Result 2006 |
| Party |
Seats |
Gains |
Losses |
Net gain/loss |
Seats % |
Votes % |
Votes |
+/− |
| |
Liberal Democrat |
14 |
0 |
1 |
-1 |
48.3 |
34.0 |
42,533 |
+3.2% |
| |
Labour |
14 |
0 |
0 |
0 |
48.3 |
33.7 |
42,191 |
-0.7% |
| |
Green |
1 |
1 |
0 |
+1 |
3.4 |
10.9 |
13,621 |
-1.9% |
| |
Conservative |
0 |
0 |
0 |
0 |
0.0 |
15.0 |
18,765 |
-0.8% |
| |
BNP |
0 |
0 |
0 |
0 |
0.0 |
2.3 |
2,906 |
-0.8% |
| |
UKIP |
0 |
0 |
0 |
0 |
0.0 |
2.3 |
2,849 |
+0.9% |
| |
Respect |
0 |
0 |
0 |
0 |
0.0 |
1.0 |
1,208 |
+1.0% |
| |
Christian Peoples |
0 |
0 |
0 |
0 |
0.0 |
0.3 |
395 |
+0.3% |
| |
Independent |
0 |
0 |
0 |
0 |
0.0 |
0.3 |
337 |
+0.3% |
| |
Socialist Alternative |
0 |
0 |
0 |
0 |
0.0 |
0.2 |
206 |
+0.1% |
This result has the following consequences for the total number of seats on the Council after the elections:
| Party |
Previous council |
New council |
|
Labour |
44 |
44 |
|
Liberal Democrats |
37 |
36 |
|
Conservatives |
2 |
2 |
|
Green |
1 |
2 |
|
BNP |
0 |
0 |
|
UKIP |
0 |
0 |
|
Respect |
0 |
0 |
|
Christian Peoples |
0 |
0 |
|
Independent |
0 |
0 |
|
Socialist Alternative |
0 |
0 |
| Total |
84 |
84 |
| Working majority |
4 |
4 |
Ward results
| Arbourthorne [1] |
| Party |
Candidate |
Votes |
% |
±% |
|
Labour |
Timothy Rippon |
1,695 |
49.5 |
+2.6 |
|
Liberal Democrat |
Tony Bennett |
872 |
25.4 |
-2.1 |
|
Conservative |
Peter Smith |
451 |
13.2 |
+1.4 |
|
Green |
Alexa Walker |
288 |
8.4 |
-0.0 |
|
Christian Peoples |
Kyle Spotswood |
121 |
3.5 |
+3.5 |
| Majority |
823 |
24.0 |
+4.6 |
| Turnout |
3,427 |
28.2 |
-10.8 |
|
Labour hold |
Swing |
+2.3 |
|
| Beauchief & Greenhill [1] |
| Party |
Candidate |
Votes |
% |
±% |
|
Liberal Democrat |
Clive Skelton |
2,134 |
38.7 |
+2.2 |
|
Labour |
Steven Wilson |
1,852 |
33.6 |
+4.1 |
|
Conservative |
Michelle Grant |
628 |
11.4 |
-1.7 |
|
BNP |
John Beatson |
567 |
10.3 |
-2.9 |
|
Green |
David Hayes |
327 |
5.9 |
-1.8 |
| Majority |
282 |
5.1 |
-1.9 |
| Turnout |
5,508 |
41.3 |
-7.4 |
|
Liberal Democrat hold |
Swing |
-0.9 |
|
| Beighton [1] |
| Party |
Candidate |
Votes |
% |
±% |
|
Labour |
Helen Mirfin-Boukouris |
1,655 |
42.7 |
-3.6 |
|
Conservative |
Shirley Clayton |
745 |
19.2 |
-1.9 |
|
BNP |
Roy James |
659 |
17.0 |
+17.0 |
|
Liberal Democrat |
Allan Wisbey |
564 |
14.5 |
+2.1 |
|
Green |
Andrew Brandram |
255 |
6.6 |
-3.0 |
| Majority |
910 |
23.5 |
-1.7 |
| Turnout |
3,878 |
30.2 |
-8.1 |
|
Labour hold |
Swing |
-0.9 |
|
| Birley [1] |
| Party |
Candidate |
Votes |
% |
±% |
|
Labour |
Michael Pye |
2,018 |
49.6 |
-3.6 |
|
Liberal Democrat |
Angela Hill |
766 |
18.8 |
-1.7 |
|
Conservative |
Gordon Millward |
543 |
13.3 |
-3.2 |
|
Green |
Francis Plunkett |
346 |
8.5 |
-1.3 |
|
UKIP |
Sally Stracey |
396 |
9.7 |
+9.7 |
| Majority |
1,252 |
30.8 |
-1.9 |
| Turnout |
4,069 |
31.6 |
-14.5 |
|
Labour hold |
Swing |
-0.9 |
|
| Broomhill [1] |
| Party |
Candidate |
Votes |
% |
±% |
|
Liberal Democrat |
Shaffaq Mohammed |
1,239 |
41.6 |
+0.5 |
|
Green |
Robert Cole |
730 |
24.5 |
-0.3 |
|
Labour |
Jennifer Armstrong |
581 |
19.5 |
-0.2 |
|
Conservative |
Michael Ginn |
426 |
14.3 |
-0.1 |
| Majority |
509 |
17.1 |
+0.8 |
| Turnout |
2,976 |
25.4 |
-10.3 |
|
Liberal Democrat hold |
Swing |
+0.4 |
|
| Burngreave [1] |
| Party |
Candidate |
Votes |
% |
±% |
|
Labour |
Steven Jones |
2,278 |
48.9 |
-0.3 |
|
Respect |
Maxine Bowler |
1,208 |
25.9 |
+25.9 |
|
Conservative |
Russell Cutts |
425 |
9.1 |
-0.7 |
|
Green |
Christopher Sissons |
401 |
8.6 |
-6.6 |
|
Liberal Democrat |
Tasadique Mohammed |
350 |
7.5 |
-7.9 |
| Majority |
1,070 |
23.0 |
-10.8 |
| Turnout |
4,662 |
33.9 |
-3.2 |
|
Labour hold |
Swing |
-13.1 |
|
| Central [1] |
| Party |
Candidate |
Votes |
% |
±% |
|
Green |
Bernard Little |
1,159 |
32.6 |
+2.6 |
|
Labour |
Mohammad Maroof |
1,117 |
31.5 |
+0.3 |
|
Liberal Democrat |
Mohammad Azim |
1,036 |
29.2 |
-0.2 |
|
Conservative |
Nicholas Bryan |
239 |
6.7 |
-2.7 |
| Majority |
42 |
1.2 |
+0.0 |
| Turnout |
3,551 |
30.4 |
-5.2 |
|
Green gain from Liberal Democrat |
Swing |
+1.4 |
|
| Crookes [1] |
| Party |
Candidate |
Votes |
% |
±% |
|
Liberal Democrat |
Sylvia Anginotti |
2,470 |
48.6 |
+6.6 |
|
Conservative |
David Robinson |
939 |
18.5 |
-0.1 |
|
Labour |
Felicity Matthews |
823 |
16.2 |
-4.4 |
|
Green |
Julian Briggs |
730 |
14.4 |
-4.4 |
|
Christian Peoples |
Stuart Johnson |
116 |
2.3 |
+2.3 |
| Majority |
1,531 |
30.1 |
+8.7 |
| Turnout |
5,078 |
38.3 |
-10.4 |
|
Liberal Democrat hold |
Swing |
+3.3 |
|
| Darnall [1] |
| Party |
Candidate |
Votes |
% |
±% |
|
Labour |
Mazher Iqbal |
2,338 |
54.8 |
+14.4 |
|
Liberal Democrat |
John Bowden |
732 |
17.1 |
-7.1 |
|
UKIP |
Charlotte Arnott |
482 |
11.3 |
-4.8 |
|
Conservative |
Anne Corke |
385 |
9.0 |
-1.5 |
|
Green |
Julie White |
333 |
7.8 |
-0.9 |
| Majority |
1,606 |
37.6 |
+21.4 |
| Turnout |
4,270 |
31.4 |
-11.7 |
|
Labour hold |
Swing |
+10.7 |
|
| Dore & Totley [1] |
| Party |
Candidate |
Votes |
% |
±% |
|
Liberal Democrat |
Keith Hill |
3,770 |
52.8 |
+13.8 |
|
Conservative |
Janet Chapman |
2,623 |
36.7 |
-7.6 |
|
Labour |
Mohammad Hussain |
300 |
4.2 |
-4.8 |
|
Green |
Dawn Biram |
274 |
3.8 |
-3.9 |
|
UKIP |
James Laurie |
172 |
2.4 |
+2.4 |
| Majority |
1,147 |
16.1 |
+10.8 |
| Turnout |
7,139 |
54.3 |
-4.9 |
|
Liberal Democrat hold |
Swing |
+10.7 |
|
| East Ecclesfield [1] |
| Party |
Candidate |
Votes |
% |
±% |
|
Liberal Democrat |
Graham Oxley |
2,039 |
46.1 |
+10.6 |
|
Labour |
Adele Jagger |
1,565 |
35.4 |
+4.2 |
|
Conservative |
Miles Waters |
441 |
10.0 |
+1.8 |
|
Green |
Lamia Safir |
378 |
8.5 |
+0.4 |
| Majority |
474 |
10.7 |
+6.4 |
| Turnout |
4,423 |
32.3 |
-12.5 |
|
Liberal Democrat hold |
Swing |
+3.2 |
|
| Ecclesall [1] |
| Party |
Candidate |
Votes |
% |
±% |
|
Liberal Democrat |
Roger Davison |
3,449 |
52.2 |
+6.1 |
|
Liberal Democrat |
Michael Reynolds |
3,281 |
|
|
|
Conservative |
Michael Young |
1,617 |
24.5 |
-1.9 |
|
Conservative |
Daniel Young |
1,586 |
|
|
|
Green |
Arun Mathur |
789 |
11.9 |
-1.7 |
|
Labour |
James Lafferty |
587 |
8.9 |
-4.9 |
|
Green |
Robert Murphy |
573 |
|
|
|
Labour |
Neil Cleeveley |
480 |
|
|
|
Christian Peoples |
Sidney Cordle |
158 |
2.4 |
+2.4 |
| Majority |
1,664 |
27.7 |
+8.0 |
| Turnout |
6,600 |
45.8 |
-7.7 |
|
Liberal Democrat hold |
Swing |
|
|
|
Liberal Democrat hold |
Swing |
+4.0 |
|
| Firth Park [1] |
| Party |
Candidate |
Votes |
% |
±% |
|
Labour |
Alan Law |
1,854 |
55.0 |
-2.3 |
|
Liberal Democrat |
John Tomlinson |
641 |
19.0 |
+6.6 |
|
Green |
Steven Marshall |
441 |
13.1 |
-1.6 |
|
Conservative |
Paul Rymill |
437 |
13.0 |
-2.5 |
| Majority |
1,213 |
36.0 |
-5.8 |
| Turnout |
3,373 |
26.8 |
-8.7 |
|
Labour hold |
Swing |
-4.4 |
|
| Fulwood [1] |
| Party |
Candidate |
Votes |
% |
±% |
|
Liberal Democrat |
Janice Sidebottom |
2,541 |
47.2 |
+3.8 |
|
Conservative |
Caroline Cooper |
1,818 |
33.8 |
+7.3 |
|
Green |
Laura Anderson |
450 |
8.4 |
-3.6 |
|
Labour |
Martin Newsome |
436 |
8.1 |
-4.1 |
|
UKIP |
Nigel James |
137 |
2.5 |
-2.3 |
| Majority |
723 |
13.4 |
-3.5 |
| Turnout |
5,382 |
42.0 |
-8.9 |
|
Liberal Democrat hold |
Swing |
-1.7 |
|
| Gleadless Valley [1] |
| Party |
Candidate |
Votes |
% |
±% |
|
Labour |
Garry Westherall |
1,701 |
36.3 |
-3.3 |
|
Liberal Democrat |
Denise Reaney |
1,652 |
35.3 |
+6.5 |
|
Green |
Robert Unwin |
981 |
21.0 |
+0.2 |
|
Conservative |
Amy Taylor |
348 |
7.4 |
-3.3 |
| Majority |
49 |
1.0 |
-9.8 |
| Turnout |
4,682 |
35.1 |
-9.4 |
|
Labour hold |
Swing |
-4.9 |
|
| Graves Park [1] |
| Party |
Candidate |
Votes |
% |
±% |
|
Liberal Democrat |
Robert McCann |
1,935 |
38.1 |
-4.7 |
|
Labour |
Robert Pemberton |
1,389 |
27.4 |
+0.2 |
|
Conservative |
Trevor Grant |
775 |
15.3 |
-1.2 |
|
Green |
Rita Wilcock |
499 |
9.8 |
-3.7 |
|
UKIP |
Pauline Arnott |
272 |
5.4 |
+5.4 |
|
Socialist Alternative |
Celvin Payne |
206 |
4.1 |
+4.1 |
| Majority |
546 |
10.8 |
-4.8 |
| Turnout |
5,076 |
39.2 |
-9.3 |
|
Liberal Democrat hold |
Swing |
-2.4 |
|
| Hillsborough [1] |
| Party |
Candidate |
Votes |
% |
±% |
|
Labour |
Janet Bragg |
1,882 |
41.4 |
-0.7 |
|
Liberal Democrat |
Stephen Ayris |
1,667 |
36.6 |
+2.4 |
|
Green |
Christopher McMahon |
568 |
12.5 |
-1.9 |
|
Conservative |
Peter Smith |
433 |
9.5 |
+0.3 |
| Majority |
215 |
4.7 |
-3.2 |
| Turnout |
4,550 |
34.8 |
-14.0 |
|
Labour hold |
Swing |
-1.5 |
|
| Manor Castle [1] |
| Party |
Candidate |
Votes |
% |
±% |
|
Labour |
Janet Wilson |
1,604 |
58.2 |
-3.8 |
|
Green |
Graham Wroe |
473 |
17.2 |
+3.1 |
|
Liberal Democrat |
Colin France |
363 |
13.2 |
-1.6 |
|
Conservative |
Christina Stark |
316 |
11.5 |
+2.5 |
| Majority |
1,131 |
41.0 |
-6.2 |
| Turnout |
2,756 |
23.9 |
-11.0 |
|
Labour hold |
Swing |
-3.4 |
|
| Mosborough [1] |
| Party |
Candidate |
Votes |
% |
±% |
|
Labour |
Samuel Wall |
1,623 |
40.8 |
-1.6 |
|
Liberal Democrat |
Christopher Tutt |
1,125 |
28.3 |
+0.7 |
|
Conservative |
Evelyn Millward |
696 |
17.5 |
-4.2 |
|
UKIP |
John Marshall |
308 |
7.7 |
+7.7 |
|
Green |
Heather Hunt |
224 |
5.6 |
-2.5 |
| Majority |
498 |
12.5 |
-2.3 |
| Turnout |
3,976 |
30.6 |
-11.0 |
|
Labour hold |
Swing |
-1.1 |
|
| Nether Edge [1] |
| Party |
Candidate |
Votes |
% |
±% |
|
Liberal Democrat |
Patricia White |
2,163 |
40.4 |
-1.4 |
|
Labour |
Mohammad Khan |
1,743 |
32.5 |
+5.3 |
|
Green |
Mervyn Smith |
986 |
18.4 |
+0.9 |
|
Conservative |
Rosita Malandrinos |
466 |
8.7 |
-4.7 |
| Majority |
420 |
7.8 |
-6.8 |
| Turnout |
5,358 |
43.0 |
-7.5 |
|
Liberal Democrat hold |
Swing |
-3.3 |
|
| Richmond [1] |
| Party |
Candidate |
Votes |
% |
±% |
|
Labour |
Elizabeth Naylor |
1,832 |
48.1 |
+7.5 |
|
Liberal Democrat |
Judith Webster |
741 |
19.5 |
+5.8 |
|
UKIP |
Leslie Arnott |
508 |
13.3 |
+13.3 |
|
Conservative |
Ian Fey |
438 |
11.5 |
+0.9 |
|
Green |
Eamonn Ward |
289 |
7.6 |
-4.5 |
| Majority |
1091 |
28.7 |
+2.3 |
| Turnout |
3,808 |
29.8 |
-11.8 |
|
Labour hold |
Swing |
+0.8 |
|
| Shiregreen & Brightside [1] |
| Party |
Candidate |
Votes |
% |
±% |
|
Labour |
Peter Rippon |
1,883 |
48.5 |
+1.8 |
|
BNP |
Christopher Hartigan |
1,015 |
26.1 |
+2.8 |
|
Liberal Democrat |
Barbara Masters |
431 |
11.1 |
-1.9 |
|
Conservative |
Mohammed Tariq |
317 |
8.2 |
-0.6 |
|
Green |
Jennyfer Barnard |
239 |
6.2 |
-1.8 |
| Majority |
868 |
22.3 |
-1.1 |
| Turnout |
3,885 |
28.4 |
-5.0 |
|
Labour hold |
Swing |
-0.5 |
|
| Southey [1] |
| Party |
Candidate |
Votes |
% |
±% |
|
Labour |
Gillian Furniss |
1,602 |
46.1 |
-4.1 |
|
BNP |
David Wright |
665 |
19.1 |
-2.8 |
|
Liberal Democrat |
Richard Bowden |
377 |
10.8 |
-1.3 |
|
Conservative |
Robert McIlveen |
350 |
10.1 |
+1.9 |
|
Independent |
Mark Wilde |
337 |
9.7 |
+9.7 |
|
Green |
Steven Barnard |
144 |
4.1 |
-3.4 |
| Majority |
937 |
27.0 |
-1.3 |
| Turnout |
3,475 |
27.0 |
-9.4 |
|
Labour hold |
Swing |
-0.6 |
|
| Stannington [1] |
| Party |
Candidate |
Votes |
% |
±% |
|
Liberal Democrat |
David Baker |
2,421 |
46.9 |
+8.0 |
|
Labour |
Louise Webb |
1,428 |
27.7 |
-0.8 |
|
Conservative |
Matthew Dixon |
803 |
15.5 |
-4.2 |
|
Green |
Michael Maas |
512 |
9.9 |
-3.0 |
| Majority |
993 |
19.2 |
+8.8 |
| Turnout |
5,164 |
37.9 |
-10.4 |
|
Liberal Democrat hold |
Swing |
+4.4 |
|
| Stocksbridge & Upper Don [1] |
| Party |
Candidate |
Votes |
% |
±% |
|
Liberal Democrat |
Alison Brelsford |
2,201 |
48.1 |
+3.6 |
|
Labour |
Christopher Prescott |
1,094 |
23.9 |
-1.9 |
|
Conservative |
Timothy Lewis |
736 |
16.1 |
+0.6 |
|
Green |
Angela Roberts |
549 |
12.0 |
-2.1 |
| Majority |
1,107 |
24.2 |
+5.5 |
| Turnout |
4,580 |
32.2 |
-9.6 |
|
Liberal Democrat hold |
Swing |
+2.7 |
|
| Walkley [1] |
| Party |
Candidate |
Votes |
% |
±% |
|
Liberal Democrat |
Jonathan Harston |
1,863 |
40.6 |
+2.9 |
|
Labour |
James Bamford |
1,783 |
38.9 |
+2.4 |
|
Green |
Barry New |
625 |
13.6 |
-3.9 |
|
Conservative |
Andrew Gabbitas |
313 |
6.8 |
-1.4 |
| Majority |
80 |
1.7 |
+0.5 |
| Turnout |
4,584 |
35.5 |
-7.6 |
|
Liberal Democrat hold |
Swing |
+0.2 |
|
| West Ecclesfield [1] |
| Party |
Candidate |
Votes |
% |
±% |
|
Liberal Democrat |
Trevor Bagshaw |
2,388 |
49.6 |
+6.5 |
|
Labour |
Shiela Constance |
1,562 |
32.4 |
-2.1 |
|
Conservative |
Paula Axelby |
511 |
10.6 |
-2.7 |
|
Green |
Kathryn Aston |
353 |
7.3 |
-1.7 |
| Majority |
826 |
17.2 |
+8.6 |
| Turnout |
4,814 |
34.7 |
-8.7 |
|
Liberal Democrat hold |
Swing |
+4.3 |
|
| Woodhouse [1] |
| Party |
Candidate |
Votes |
% |
±% |
|
Labour |
Raymond Satur |
1,966 |
49.6 |
+3.8 |
|
Liberal Democrat |
Robert Moffett |
603 |
15.2 |
+5.9 |
|
UKIP |
Jonathan Arnott |
574 |
14.5 |
-1.3 |
|
Conservative |
Laurence Hayward |
546 |
13.8 |
+5.2 |
|
Green |
Daniel Lyons |
278 |
7.0 |
+0.5 |
| Majority |
1363 |
34.4 |
+4.4 |
| Turnout |
3,967 |
30.7 |
-14.4 |
|
Labour hold |
Swing |
-1.0 |
|
References