Sheffield City Council election, 1994
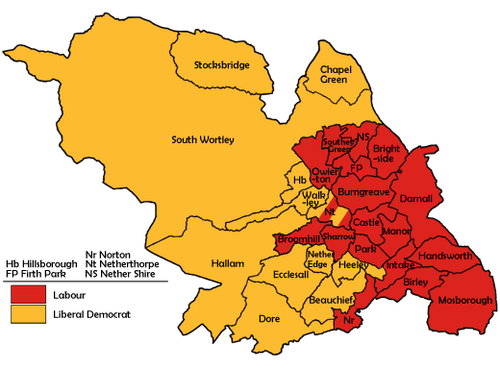
Map of the results for the 1994 Sheffield council election.
Elections to Sheffield City Council were held on 5 May 1994. One third of the council was up for election. Since the previous election, three by-elections had taken place, resulting in two Lib Dem gains from Labour in Brightside and Walkley and a successful hold of a Dore seat by the Conservatives.[1] This, along with a defection from Burngreave councillor James Jamison, left Labour down three, the Liberal Democrats up two and the Conservatives unchanged going into this election.
Election result
| Sheffield Local Election Result 1994 |
| Party |
Seats |
Gains |
Losses |
Net gain/loss |
Seats % |
Votes % |
Votes |
+/− |
| |
Labour |
17 |
0 |
8 |
-8 |
60.7 |
41.2 |
62,741 |
+3.0% |
| |
Liberal Democrat |
11 |
11 |
0 |
+11 |
39.3 |
42.1 |
64,208 |
+14.5% |
| |
Conservative |
0 |
0 |
3 |
-3 |
0.0 |
13.3 |
20,291 |
-19.1% |
| |
Green |
0 |
0 |
0 |
0 |
0.0 |
1.2 |
1,903 |
-0.3% |
| |
Save Our Park and Services |
0 |
0 |
0 |
0 |
0.0 |
1.0 |
1,613 |
+1.0% |
|
Militant Labour |
0 |
0 |
0 |
0 |
0.0 |
0.4 |
682 |
+0.4% |
| |
Independent |
0 |
0 |
0 |
0 |
0.0 |
0.3 |
507 |
+0.3% |
| |
Independent Labour |
0 |
0 |
0 |
0 |
0.0 |
0.2 |
385 |
+0.2% |
| |
Communist League |
0 |
0 |
0 |
0 |
0.0 |
0.0 |
35 |
+0.0% |
This result had the following consequences for the total number of seats on the Council after the elections:
| Party |
Previous council |
New council |
|
Labour |
64 |
56 |
|
Liberal Democrats |
11 |
22 |
|
Conservatives |
11 |
8 |
|
Independent Labour |
1 |
1 |
| Total |
87 |
87 |
| Working majority |
41 |
25 |
Ward results
| Beauchief [2][3] |
| Party |
Candidate |
Votes |
% |
±% |
|
Liberal Democrat |
Peter Moore |
4,652 |
64.5 |
+7.7 |
|
Labour |
Barry Birks |
1,577 |
21.9 |
+4.9 |
|
Conservative |
Michael Young |
859 |
11.9 |
-14.2 |
|
Save Our Park and Services |
Violet Needham |
120 |
1.6 |
+1.6 |
| Majority |
3,075 |
42.6 |
+11.9 |
| Turnout |
7,208 |
49.3 |
+3.5 |
|
Liberal Democrat hold |
Swing |
+1.4 |
|
| Birley [2][3] |
| Party |
Candidate |
Votes |
% |
±% |
|
Labour |
Donald Gow |
3,039 |
55.1 |
+7.0 |
|
Liberal Democrat |
Louise Truman |
1,724 |
31.3 |
+14.4 |
|
Conservative |
Margaret Pigott |
749 |
13.6 |
-21.3 |
| Majority |
1,315 |
23.8 |
+10.6 |
| Turnout |
5,512 |
36.1 |
+9.6 |
|
Labour hold |
Swing |
-3.7 |
|
| Brightside[2][3] |
| Party |
Candidate |
Votes |
% |
±% |
|
Labour |
Alred Meade |
2,076 |
47.6 |
-7.6 |
|
Liberal Democrat |
Joyce Brodie |
1,986 |
45.5 |
+29.1 |
|
Conservative |
Michael Quirke |
210 |
4.8 |
-23.6 |
|
Save Our Park and Services |
Alan Shipley |
90 |
2.0 |
+2.0 |
| Majority |
90 |
2.1 |
-24.7 |
| Turnout |
4,362 |
33.7 |
+14.5 |
|
Labour hold |
Swing |
-18.3 |
|
| Broomhill[2][3] |
| Party |
Candidate |
Votes |
% |
±% |
|
Labour |
Richard Eastall |
2,179 |
38.4 |
+5.4 |
|
Liberal Democrat |
Leonard Hesketh |
1,809 |
31.9 |
+14.9 |
|
Conservative |
Charles Wallis |
1,372 |
24.2 |
-18.5 |
|
Green |
Joseph Otten |
191 |
3.4 |
-3.7 |
|
Save Our Park and Services |
Lorette Bilby |
120 |
2.1 |
+2.1 |
| Majority |
370 |
6.5 |
-3.2 |
| Turnout |
5,671 |
34.6 |
+4.1 |
|
Labour hold |
Swing |
-4.7 |
|
| Burngreave[2][3] |
| Party |
Candidate |
Votes |
% |
±% |
|
Labour |
John Watson |
1,986 |
61.1 |
+0.9 |
|
Liberal Democrat |
Katherine Milson |
630 |
19.4 |
+1.5 |
|
Independent |
Donald Sparkes |
345 |
10.6 |
+10.6 |
|
Conservative |
David Knight |
251 |
7.7 |
-14.1 |
|
Communist League |
Antony Hunt |
35 |
1.1 |
+1.1 |
| Majority |
1,356 |
41.7 |
+3.3 |
| Turnout |
3,247 |
27.9 |
+7.3 |
|
Labour hold |
Swing |
-0.3 |
|
| Castle[2][3] |
| Party |
Candidate |
Votes |
% |
±% |
|
Labour |
Peter Horton |
1,963 |
67.0 |
+3.5 |
|
Liberal Democrat |
Andrew McKerrow |
567 |
19.3 |
+3.8 |
|
Conservative |
Anne Smith |
270 |
9.2 |
-11.8 |
|
Green |
Graham Wroe |
130 |
4.4 |
+4.4 |
| Majority |
1,396 |
47.7 |
+5.2 |
| Turnout |
2,930 |
25.4 |
+6.2 |
|
Labour hold |
Swing |
-0.1 |
|
| Chapel Green[2][3] |
| Party |
Candidate |
Votes |
% |
±% |
|
Liberal Democrat |
Francis Butler |
4,529 |
61.1 |
+0.2 |
|
Labour |
Laurence Kingham |
2,489 |
33.6 |
+7.0 |
|
Conservative |
Michael Boot |
393 |
5.3 |
-7.2 |
| Majority |
2,040 |
27.5 |
-6.8 |
| Turnout |
7,411 |
40.4 |
+7.3 |
|
Liberal Democrat gain from Labour |
Swing |
-3.4 |
|
| Darnall[2][3] |
| Party |
Candidate |
Votes |
% |
±% |
|
Labour |
Choudry Walayat |
2,110 |
47.1 |
-4.3 |
|
Liberal Democrat |
Theresa Hainey |
1,448 |
32.3 |
+20.6 |
|
Conservative |
Laurence Hayward |
571 |
12.7 |
-16.9 |
|
Green |
Gordon Ferguson |
348 |
7.8 |
+0.5 |
| Majority |
662 |
14.8 |
-7.0 |
| Turnout |
4,477 |
30.3 |
+8.2 |
|
Labour hold |
Swing |
-12.4 |
|
| Dore[2][3] |
| Party |
Candidate |
Votes |
% |
±% |
|
Liberal Democrat |
Colin Ross |
3,292 |
45.1 |
+27.2 |
|
Conservative |
John Harthman |
2,627 |
36.0 |
-28.8 |
|
Labour |
Michael King |
1,248 |
17.1 |
-0.2 |
|
Save Our Park and Services |
Joyce Baptie |
124 |
1.7 |
+1.7 |
| Majority |
665 |
9.1 |
-37.8 |
| Turnout |
7,291 |
45.3 |
+6.4 |
|
Liberal Democrat gain from Conservative |
Swing |
+28.0 |
|
| Ecclesall[2][3] |
| Party |
Candidate |
Votes |
% |
±% |
|
Liberal Democrat |
Roger Davison |
3,022 |
42.2 |
+20.4 |
|
Conservative |
Stuart Dawson |
2,433 |
33.9 |
-26.0 |
|
Labour |
Lawrence Samuels |
1,334 |
18.6 |
+2.8 |
|
Save Our Park and Services |
Philip Eastwood |
375 |
5.2 |
+5.2 |
| Majority |
589 |
8.3 |
-29.8 |
| Turnout |
7,164 |
45.5 |
+6.7 |
|
Liberal Democrat gain from Conservative |
Swing |
+23.2 |
|
| Hallam[2][3] |
| Party |
Candidate |
Votes |
% |
±% |
|
Liberal Democrat |
Duncan Kime |
3,729 |
50.4 |
+25.2 |
|
Conservative |
Graham Lawson |
2,350 |
31.7 |
-24.6 |
|
Labour |
William Barnard |
1,159 |
15.6 |
+1.0 |
|
Green |
Peter Scott |
162 |
2.2 |
-1.6 |
| Majority |
1,379 |
18.7 |
-12.4 |
| Turnout |
7,400 |
50.0 |
+10.3 |
|
Liberal Democrat gain from Conservative |
Swing |
+24.9 |
|
| Handsworth[2][3] |
| Party |
Candidate |
Votes |
% |
±% |
|
Labour |
Raymond Satur |
2,553 |
50.0 |
-0.2 |
|
Liberal Democrat |
Michael Ogden |
2,050 |
40.1 |
+20.4 |
|
Conservative |
Shirley Clayton |
501 |
9.8 |
-20.2 |
| Majority |
503 |
9.9 |
-10.3 |
| Turnout |
5,104 |
35.6 |
+10.9 |
|
Labour hold |
Swing |
-10.3 |
|
| Heeley[2][3] |
| Party |
Candidate |
Votes |
% |
±% |
|
Liberal Democrat |
Stephen Ayris |
3,282 |
52.5 |
+19.8 |
|
Labour |
Roy Darke |
2,534 |
40.5 |
-4.9 |
|
Conservative |
Francis Woodger |
297 |
4.7 |
-17.2 |
|
Save Our Park and Services |
Hilary Pickin |
136 |
2.2 |
+2.2 |
| Majority |
748 |
12.5 |
-0.2 |
| Turnout |
6,249 |
43.3 |
+15.5 |
|
Liberal Democrat gain from Labour |
Swing |
+12.3 |
|
| Hillsborough[2][3] |
| Party |
Candidate |
Votes |
% |
±% |
|
Liberal Democrat |
Christine Tosseano |
3,179 |
50.8 |
+19.8 |
|
Labour |
Audrey Hilbert |
2,300 |
36.7 |
+1.2 |
|
Conservative |
Michael Hayman |
659 |
10.5 |
-19.1 |
|
Save Our Park and Services |
Avril Critchley |
122 |
1.9 |
+1.9 |
| Majority |
879 |
14.1 |
+9.6 |
| Turnout |
6,260 |
41.8 |
+9.9 |
|
Liberal Democrat gain from Labour |
Swing |
+9.3 |
|
| Intake[2][3] |
| Party |
Candidate |
Votes |
% |
±% |
|
Labour |
Freda White |
2,449 |
45.4 |
+2.4 |
|
Labour |
David Lawton |
2,428 |
|
|
|
Liberal Democrat |
Christopher Tutt |
2,177 |
40.4 |
+22.7 |
|
Liberal Democrat |
Robert Watson |
2,039 |
|
|
|
Conservative |
Michael Pinder |
595 |
11.0 |
-28.3 |
|
Conservative |
Jack Thompson |
523 |
|
|
|
Save Our Park and Services |
Margaret Stuart |
171 |
3.2 |
+3.2 |
| Majority |
272 |
5.0 |
+1.3 |
| Turnout |
5,392 |
33.8 |
+8.3 |
|
Labour hold |
Swing |
-10.1 |
|
| Manor[2][3] |
| Party |
Candidate |
Votes |
% |
±% |
|
Labour |
Janet Fiore |
1,880 |
66.7 |
+5.2 |
|
Liberal Democrat |
Roy Denton |
709 |
25.2 |
+8.9 |
|
Conservative |
Andrew Watson |
227 |
8.0 |
-14.1 |
| Majority |
1,171 |
41.5 |
+2.1 |
| Turnout |
2,816 |
30.4 |
+9.2 |
|
Labour hold |
Swing |
-1.8 |
|
| Mosborough[2][3] |
| Party |
Candidate |
Votes |
% |
±% |
|
Labour |
Ian Saunders |
4,144 |
52.3 |
+6.6 |
|
Liberal Democrat |
Alan Hatcher |
2,670 |
33.7 |
+18.8 |
|
Conservative |
Thomas Pigott |
1,102 |
13.9 |
-25.5 |
| Majority |
1,474 |
18.6 |
+12.3 |
| Turnout |
7,916 |
31.5 |
+8.4 |
|
Labour hold |
Swing |
-6.1 |
|
| Nether Edge[2][3] |
| Party |
Candidate |
Votes |
% |
±% |
|
Liberal Democrat |
Doreen Huddard |
2,989 |
50.0 |
+1.1 |
|
Labour |
Qurban Hussain |
2,090 |
35.0 |
+4.7 |
|
Conservative |
Marjorie Kirby |
567 |
9.5 |
-7.5 |
|
Green |
R. Southworth |
229 |
3.8 |
+0.1 |
|
Save Our Park and Services |
A. Dronfield |
99 |
1.7 |
+1.7 |
| Majority |
899 |
15.1 |
-3.5 |
| Turnout |
5,974 |
41.3 |
+5.8 |
|
Liberal Democrat gain from Labour |
Swing |
-1.8 |
|
| Nether Shire[2][3] |
| Party |
Candidate |
Votes |
% |
±% |
|
Labour |
D. Newton |
2,238 |
56.0 |
+4.1 |
|
Liberal Democrat |
Wayne Morton |
1,434 |
35.9 |
+10.7 |
|
Conservative |
E. Platts |
328 |
8.2 |
-14.6 |
| Majority |
804 |
20.1 |
-6.6 |
| Turnout |
4,000 |
31.7 |
+8.8 |
|
Labour hold |
Swing |
-3.3 |
|
| Netherthorpe[2][3] |
| Party |
Candidate |
Votes |
% |
±% |
|
Labour |
Michael Bower |
1,849 |
38.2 |
-12.2 |
|
Liberal Democrat |
Sylvia Anginotti |
1,624 |
33.5 |
+16.7 |
|
Liberal Democrat |
Howard Middleton |
1,561 |
|
|
|
Labour |
Michael Smith |
1,455 |
|
|
|
Green |
Barry New |
477 |
9.9 |
-0.7 |
|
Independent Labour |
P. Wallace |
385 |
8.0 |
+8.0 |
|
Conservative |
Maureen Neill |
265 |
5.5 |
-16.6 |
|
Save Our Park and Services |
J. Green |
156 |
3.2 |
+3.2 |
|
Independent Labour |
P. Hughes |
139 |
|
|
|
Independent |
R. Clare |
86 |
1.8 |
+1.8 |
| Majority |
225 |
4.7 |
-23.6 |
| Turnout |
4,842 |
31.8 |
+10.5 |
|
Labour hold |
Swing |
|
|
|
Liberal Democrat gain from Labour |
Swing |
+14.4 |
|
| Norton[2][3] |
| Party |
Candidate |
Votes |
% |
±% |
|
Labour |
James Moore |
2,333 |
46.6 |
+6.0 |
|
Liberal Democrat |
B. Noonan |
1,954 |
39.0 |
+12.5 |
|
Conservative |
Michael Ginn |
723 |
14.4 |
-18.4 |
| Majority |
379 |
7.6 |
-0.2 |
| Turnout |
5,010 |
40.2 |
+6.2 |
|
Labour hold |
Swing |
-3.2 |
|
| Owlerton[2][3] |
| Party |
Candidate |
Votes |
% |
±% |
|
Labour |
George Mathews |
2,166 |
58.8 |
+5.1 |
|
Liberal Democrat |
M. Sloane |
1,031 |
28.0 |
+12.4 |
|
Conservative |
Clive Dearden |
344 |
9.3 |
-19.0 |
|
Green |
Paul Mitchell |
141 |
3.8 |
+1.5 |
| Majority |
1,135 |
30.8 |
+5.4 |
| Turnout |
3,682 |
29.4 |
+7.5 |
|
Labour hold |
Swing |
-3.6 |
|
| Sharrow[2][3] |
| Party |
Candidate |
Votes |
% |
±% |
|
Labour |
C. McDonald |
2,103 |
55.1 |
-0.2 |
|
Liberal Democrat |
Andrew White |
1,289 |
33.8 |
+13.8 |
|
Conservative |
Anne Smith |
252 |
6.6 |
-15.4 |
|
Save Our Park and Services |
W. Pickin |
100 |
2.6 |
+2.6 |
|
Independent |
Simon Rawlins |
74 |
1.9 |
-0.7 |
| Majority |
814 |
21.3 |
-12.0 |
| Turnout |
3,818 |
31.4 |
+9.4 |
|
Labour hold |
Swing |
-7.0 |
|
| South Wortley[2][3] |
| Party |
Candidate |
Votes |
% |
±% |
|
Liberal Democrat |
V. Bowden |
4,645 |
59.8 |
+8.3 |
|
Labour |
John Webster |
2,343 |
30.2 |
+6.9 |
|
Conservative |
Lynn Wilson |
783 |
10.1 |
-15.0 |
| Majority |
2,302 |
29.6 |
+3.2 |
| Turnout |
7,771 |
42.3 |
+7.4 |
|
Liberal Democrat gain from Labour |
Swing |
+0.7 |
|
| Southey Green[2][3] |
| Party |
Candidate |
Votes |
% |
±% |
|
Labour |
Patricia Nelson |
2,182 |
67.4 |
+0.1 |
|
Liberal Democrat |
Alison MacFarlane |
777 |
24.0 |
+10.6 |
|
Conservative |
David Marriott |
278 |
8.6 |
-10.7 |
| Majority |
1,405 |
43.4 |
-4.6 |
| Turnout |
3,237 |
27.7 |
+6.7 |
|
Labour hold |
Swing |
-5.2 |
|
| Stocksbridge[2][3] |
| Party |
Candidate |
Votes |
% |
±% |
|
Liberal Democrat |
David Chadwick |
2,283 |
55.0 |
+15.7 |
|
Labour |
Sylvia Parry |
1,517 |
36.5 |
-0.3 |
|
Conservative |
I. Marshall |
354 |
8.5 |
-15.3 |
| Majority |
766 |
18.4 |
+15.9 |
| Turnout |
4,154 |
39.3 |
+8.7 |
|
Liberal Democrat gain from Labour |
Swing |
+8.0 |
|
| Walkley[2][3] |
| Party |
Candidate |
Votes |
% |
±% |
|
Liberal Democrat |
Andrew Milton |
2,931 |
49.0 |
+27.1 |
|
Labour |
James Bamford |
2,519 |
42.1 |
-1.8 |
|
Conservative |
Veronica Hague |
312 |
5.2 |
-24.0 |
|
Green |
Nicola Watson |
225 |
3.8 |
-1.1 |
| Majority |
412 |
6.9 |
-7.8 |
| Turnout |
5,987 |
41.0 |
+11.8 |
|
Liberal Democrat gain from Labour |
Swing |
+14.4 |
|
References