Sheffield City Council election, 1992
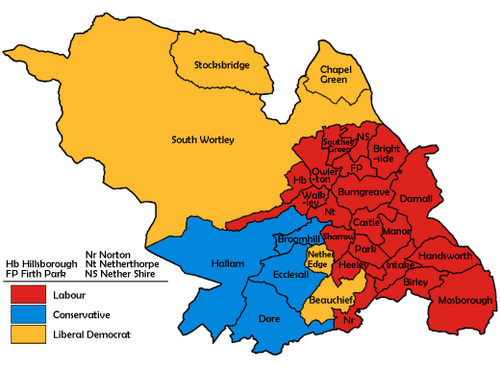
Map of the results for the 1992 Sheffield council election.
Elections to Sheffield City Council were held on 7 May 1992. One third of the council was up for election.
Election result
| Sheffield Local Election Result 1992 |
| Party |
Seats |
Gains |
Losses |
Net gain/loss |
Seats % |
Votes % |
Votes |
+/− |
| |
Labour |
21 |
0 |
3 |
-3 |
67.7 |
38.2 |
45,091 |
-11.4% |
| |
Conservative |
5 |
1 |
1 |
0 |
16.1 |
32.4 |
38,229 |
+8.9% |
| |
Liberal Democrat |
5 |
3 |
0 |
+3 |
16.1 |
27.6 |
32,623 |
+3.0% |
| |
Green |
0 |
0 |
0 |
0 |
0.0 |
1.5 |
1,785 |
+0.1% |
| |
Safer Cycling |
0 |
0 |
0 |
0 |
0.0 |
0.1 |
150 |
+0.1% |
|
Wealth Redistribution |
0 |
0 |
0 |
0 |
0.0 |
0.0 |
65 |
-0.1% |
This result had the following consequences for the total number of seats on the Council after the elections:
| Party |
Previous council |
New council |
|
Labour |
70 |
67 |
|
Conservatives |
11 |
11 |
|
Liberal Democrats |
6 |
9 |
| Total |
87 |
87 |
| Working majority |
53 |
47 |
Ward results
| Beauchief [1] |
| Party |
Candidate |
Votes |
% |
±% |
|
Liberal Democrat |
Roger Hughes |
3,884 |
56.8 |
-3.0 |
|
Conservative |
Francis Woodger |
1,785 |
26.1 |
+3.3 |
|
Labour |
David Lawton |
1,164 |
17.0 |
-0.3 |
| Majority |
2,099 |
30.7 |
-6.3 |
| Turnout |
6,833 |
45.8 |
-6.5 |
|
Liberal Democrat gain from Conservative |
Swing |
-3.1 |
|
| Birley [1] |
| Party |
Candidate |
Votes |
% |
±% |
|
Labour |
Val Shepherd |
1,990 |
48.1 |
-13.0 |
|
Conservative |
Margaret Pigott |
1,447 |
34.9 |
+13.3 |
|
Liberal Democrat |
Audrey Ashworth |
701 |
16.9 |
-0.4 |
| Majority |
543 |
13.2 |
-26.3 |
| Turnout |
4,138 |
26.5 |
-8.9 |
|
Labour hold |
Swing |
-13.1 |
|
| Brightside[1] |
| Party |
Candidate |
Votes |
% |
±% |
|
Labour |
Peter Price |
1,384 |
55.2 |
-13.9 |
|
Conservative |
Marjorie Kirby |
711 |
28.4 |
+12.6 |
|
Liberal Democrat |
Michael Davis |
411 |
16.4 |
+1.3 |
| Majority |
673 |
26.8 |
-26.5 |
| Turnout |
2,506 |
19.2 |
-8.9 |
|
Labour hold |
Swing |
-13.2 |
|
| Broomhill[1] |
| Party |
Candidate |
Votes |
% |
±% |
|
Conservative |
John Levick |
2,025 |
42.7 |
+3.7 |
|
Labour |
Robert Quick |
1,563 |
33.0 |
-0.4 |
|
Liberal Democrat |
Allan Wisbey |
808 |
17.0 |
-1.9 |
|
Green |
Michael Baker |
339 |
7.1 |
-1.6 |
| Majority |
462 |
9.7 |
+4.1 |
| Turnout |
4,735 |
30.5 |
-3.6 |
|
Conservative gain from Labour |
Swing |
+2.0 |
|
| Burngreave[1] |
| Party |
Candidate |
Votes |
% |
±% |
|
Labour |
Phyllis Smith |
1,501 |
60.2 |
-5.4 |
|
Conservative |
Andrew Cook |
544 |
21.8 |
+6.7 |
|
Liberal Democrat |
Katherine Milsom |
447 |
17.9 |
+3.5 |
| Majority |
957 |
38.4 |
-12.1 |
| Turnout |
2,492 |
20.6 |
-8.1 |
|
Labour hold |
Swing |
-6.0 |
|
| Castle[1] |
| Party |
Candidate |
Votes |
% |
±% |
|
Labour |
Thomas Bower |
1,392 |
63.5 |
-11.9 |
|
Conservative |
Anne Smith |
460 |
21.0 |
+8.4 |
|
Liberal Democrat |
Melvin Lockey |
340 |
15.5 |
+3.6 |
| Majority |
938 |
42.5 |
-20.3 |
| Turnout |
2,192 |
19.2 |
-10.3 |
|
Labour hold |
Swing |
-10.1 |
|
| Chapel Green[1] |
| Party |
Candidate |
Votes |
% |
±% |
|
Liberal Democrat |
Kathleen Chadwick |
3,704 |
60.9 |
+5.2 |
|
Labour |
Eldon Hanson |
1,617 |
26.6 |
-10.5 |
|
Conservative |
Michael Boot |
763 |
12.5 |
+5.4 |
| Majority |
2,087 |
34.3 |
+15.7 |
| Turnout |
6,084 |
33.1 |
-7.5 |
|
Liberal Democrat hold |
Swing |
+7.8 |
|
| Darnall[1] |
| Party |
Candidate |
Votes |
% |
±% |
|
Labour |
Sandra Robinson |
1,683 |
51.4 |
-5.8 |
|
Conservative |
Dorothy Kennedy |
968 |
29.6 |
+12.4 |
|
Liberal Democrat |
Motahir Ali |
383 |
11.7 |
-1.9 |
|
Green |
Christine Ferguson |
239 |
7.3 |
+0.7 |
| Majority |
715 |
21.8 |
-18.2 |
| Turnout |
3,273 |
22.1 |
-8.7 |
|
Labour hold |
Swing |
-9.1 |
|
| Dore[1] |
| Party |
Candidate |
Votes |
% |
±% |
|
Conservative |
David Heslop |
4,106 |
64.8 |
+12.3 |
|
Liberal Democrat |
Anthony Richmond |
1,134 |
17.9 |
-3.1 |
|
Labour |
Michael King |
1,098 |
17.3 |
-9.1 |
| Majority |
2,972 |
46.9 |
+20.8 |
| Turnout |
6,338 |
38.9 |
-5.4 |
|
Conservative hold |
Swing |
+7.7 |
|
| Ecclesall[1] |
| Party |
Candidate |
Votes |
% |
±% |
|
Conservative |
Bobbie Fleming |
3,675 |
59.9 |
+14.4 |
|
Liberal Democrat |
Colin Ross |
1,341 |
21.8 |
-1.4 |
|
Labour |
Timothy Plant |
969 |
15.8 |
-5.5 |
|
Safer Cycling |
Simon Gershon |
150 |
2.4 |
+2.4 |
| Majority |
2,334 |
38.1 |
+15.8 |
| Turnout |
6,135 |
38.8 |
-6.7 |
|
Conservative hold |
Swing |
+7.9 |
|
| Firth Park[1] |
| Party |
Candidate |
Votes |
% |
±% |
|
Labour |
Marilyn Mitchell |
1,944 |
63.2 |
-7.7% |
|
Conservative |
Raymond Howard |
833 |
27.1 |
+15.2 |
|
Liberal Democrat |
Ali Qadar |
296 |
9.6 |
-7.6 |
| Majority |
1,111 |
36.1 |
-17.6 |
| Turnout |
3,073 |
22.4 |
-10.8 |
|
Labour hold |
Swing |
-11.4 |
|
| Handsworth[1] |
| Party |
Candidate |
Votes |
% |
±% |
|
Labour |
Dennis Metcalfe |
1,809 |
50.2 |
-10.8 |
|
Conservative |
Shirley Clayton |
1,083 |
30.0 |
+12.5 |
|
Liberal Democrat |
Anita Morris |
712 |
19.7 |
-1.8 |
| Majority |
726 |
20.2 |
-19.3 |
| Turnout |
3,604 |
24.7 |
-9.0 |
|
Labour hold |
Swing |
-11.6 |
|
| Heeley[1] |
| Party |
Candidate |
Votes |
% |
±% |
|
Labour |
David Hayes |
1,876 |
45.4 |
-13.4 |
|
Liberal Democrat |
Stephen Ayris |
1,349 |
32.7 |
+11.2 |
|
Conservative |
Maureen Neill |
904 |
21.9 |
+2.2 |
| Majority |
527 |
12.7 |
-24.6 |
| Turnout |
4,129 |
27.8 |
-6.6 |
|
Labour hold |
Swing |
-12.3 |
|
| Intake[1] |
| Party |
Candidate |
Votes |
% |
±% |
|
Labour |
Janet Wilson |
1,711 |
43.0 |
-13.4 |
|
Conservative |
Andrew Fitzpatrick |
1,567 |
39.3 |
+14.6 |
|
Liberal Democrat |
Susan Alston |
704 |
17.7 |
-1.2 |
| Majority |
144 |
3.7 |
-28.0 |
| Turnout |
3,982 |
25.5 |
-6.2 |
|
Labour hold |
Swing |
-14.0 |
|
| Manor[1] |
| Party |
Candidate |
Votes |
% |
±% |
|
Labour |
Kenneth Curran |
1,239 |
61.5 |
-12.0 |
|
Labour |
William Jordan |
1,238 |
|
|
|
Conservative |
Albert Marsden |
446 |
22.1 |
+9.4 |
|
Conservative |
Andrew Watson |
386 |
|
|
|
Liberal Democrat |
Stuart Bridge |
328 |
16.3 |
+2.6 |
|
Liberal Democrat |
Margaret Davis |
301 |
|
|
| Majority |
792 |
39.4 |
-20.4 |
| Turnout |
2,013 |
21.2 |
-11.3 |
|
Labour hold |
Swing |
|
|
|
Labour hold |
Swing |
-10.7 |
|
| Mosborough[1] |
| Party |
Candidate |
Votes |
% |
±% |
|
Labour |
Dorothy Walton |
2,614 |
45.7 |
-11.0 |
|
Conservative |
Thomas Pigott |
2,255 |
39.4 |
+12.8 |
|
Liberal Democrat |
Louise Truman |
851 |
14.9 |
-1.7 |
| Majority |
614 |
6.3 |
-23.8 |
| Turnout |
5,720 |
23.1 |
-7.5 |
|
Labour hold |
Swing |
-11.9 |
|
| Nether Edge[1] |
| Party |
Candidate |
Votes |
% |
±% |
|
Liberal Democrat |
Gregory Connor |
2,532 |
48.9 |
+15.2 |
|
Labour |
Janet Fiore |
1,568 |
30.3 |
-10.9 |
|
Conservative |
Qari Siddique |
882 |
17.0 |
-8.1 |
|
Green |
Nicola Watson |
194 |
3.7 |
+3.7 |
| Majority |
964 |
18.6 |
+11.1 |
| Turnout |
5,176 |
35.5 |
-0.9 |
|
Liberal Democrat gain from Labour |
Swing |
+13.0 |
|
| Nether Shire[1] |
| Party |
Candidate |
Votes |
% |
±% |
|
Labour |
Jane Bird |
1,510 |
51.9 |
-17.6 |
|
Liberal Democrat |
Doreen Huddart |
734 |
25.2 |
+8.3 |
|
Conservative |
Anthony Cherry |
665 |
22.8 |
+9.3 |
| Majority |
776 |
26.7 |
-25.9 |
| Turnout |
2,909 |
22.9 |
-8.3 |
|
Labour hold |
Swing |
-12.9 |
|
| Netherthorpe[1] |
| Party |
Candidate |
Votes |
% |
±% |
|
Labour |
Anne Phelps |
1,457 |
50.4 |
-9.9 |
|
Conservative |
David Knight |
640 |
22.1 |
+7.8 |
|
Liberal Democrat |
Andrew McKerrow |
486 |
16.8 |
+2.2 |
|
Green |
Barry New |
308 |
10.6 |
-0.2 |
| Majority |
817 |
28.3 |
-17.4 |
| Turnout |
2,891 |
21.3 |
-6.1 |
|
Labour hold |
Swing |
-8.8 |
|
| Norton[1] |
| Party |
Candidate |
Votes |
% |
±% |
|
Labour |
Edward Lamb |
1,777 |
40.6 |
-14.9 |
|
Conservative |
Nicola Wilde |
1,433 |
32.8 |
+9.3 |
|
Liberal Democrat |
Christopher Tutt |
1,161 |
26.5 |
+5.5 |
| Majority |
344 |
7.8 |
-24.2 |
| Turnout |
4,371 |
34.0 |
-6.1 |
|
Labour hold |
Swing |
-12.1 |
|
| Owlerton[1] |
| Party |
Candidate |
Votes |
% |
±% |
|
Labour |
David Jones |
1,501 |
53.7 |
-13.4 |
|
Conservative |
Philip Kirby |
791 |
28.3 |
+12.6 |
|
Liberal Democrat |
Kathryn Taylor |
435 |
15.6 |
-1.6 |
|
Green |
Paul Mitchell |
65 |
2.3 |
+2.3 |
| Majority |
710 |
25.4 |
-24.5 |
| Turnout |
2,792 |
21.9 |
-9.0 |
|
Labour hold |
Swing |
-13.0 |
|
| Park[1] |
| Party |
Candidate |
Votes |
% |
±% |
|
Labour |
Alice Sargent |
1,369 |
61.1 |
-13.8 |
|
Conservative |
Mary Hyatt |
544 |
24.3 |
+13.2 |
|
Liberal Democrat |
Sheila Hughes |
328 |
14.6 |
+0.6 |
| Majority |
825 |
36.8 |
-24.1 |
| Turnout |
2,241 |
16.7 |
-9.8 |
|
Labour hold |
Swing |
-13.5 |
|
| South Wortley[1] |
| Party |
Candidate |
Votes |
% |
±% |
|
Liberal Democrat |
Arthur Dunworth |
3,376 |
51.5 |
+8.1 |
|
Conservative |
Lynn Wilson |
1,646 |
25.1 |
+4.8 |
|
Labour |
Mark Denton |
1,528 |
23.3 |
-13.0 |
| Majority |
1,730 |
26.4 |
+19.3 |
| Turnout |
6,550 |
34.9 |
-6.7 |
|
Liberal Democrat hold |
Swing |
+1.6 |
|
| Southey Green[1] |
| Party |
Candidate |
Votes |
% |
±% |
|
Labour |
John Butler |
1,696 |
67.3 |
-10.9 |
|
Conservative |
Michael Young |
486 |
19.3 |
+10.1 |
|
Liberal Democrat |
Francis Pierce |
339 |
13.4 |
+0.9 |
| Majority |
1,210 |
48.0 |
-17.7 |
| Turnout |
2,521 |
21.0 |
-10.4 |
|
Labour hold |
Swing |
-10.5 |
|
| Stocksbridge[1] |
| Party |
Candidate |
Votes |
% |
±% |
|
Liberal Democrat |
Maureen Brelsford |
1,309 |
39.3 |
+2.6 |
|
Labour |
Alan Law |
1,227 |
36.8 |
-11.0 |
|
Conservative |
Anne Smith |
795 |
23.8 |
+8.4 |
| Majority |
82 |
2.5 |
-8.6 |
| Turnout |
3,331 |
30.6 |
-3.4 |
|
Liberal Democrat gain from Labour |
Swing |
+6.8 |
|
| Walkley[1] |
| Party |
Candidate |
Votes |
% |
±% |
|
Labour |
Jean Cromar |
1,905 |
43.9 |
-12.0 |
|
Conservative |
Veronica Hague |
1,268 |
29.2 |
+11.3 |
|
Liberal Democrat |
Paul Blythe |
952 |
21.9 |
+3.1 |
|
Green |
Janette Moon |
213 |
4.9 |
-2.4 |
| Majority |
637 |
14.7 |
-22.4 |
| Turnout |
4,338 |
29.2 |
-5.2 |
|
Labour hold |
Swing |
-11.6 |
|
By-elections between 1992 and 1994
| Brightside By-Election 8 October 1992[2] |
| Party |
Candidate |
Votes |
% |
±% |
|
Liberal Democrat |
Gail Smith |
1,330 |
50.6 |
+34.2 |
|
Labour |
Alan Law |
924 |
35.2 |
-20.0 |
|
Conservative |
Marjorie Kirby |
374 |
14.2 |
-14.2 |
| Majority |
406 |
15.4 |
-11.4 |
| Turnout |
2,628 |
20.1 |
+0.9 |
|
Liberal Democrat gain from Labour |
Swing |
+27.1 |
|
| Dore By-Election 8 October 1992[2] |
| Party |
Candidate |
Votes |
% |
±% |
|
Conservative |
John Harthman |
2,165 |
52.6 |
-12.2 |
|
Liberal Democrat |
Colin Ross |
1,462 |
35.5 |
+17.6 |
|
Labour |
Mike King |
486 |
11.8 |
-5.5 |
| Majority |
703 |
17.1 |
-29.8 |
| Turnout |
4,113 |
25.2 |
-13.7 |
|
Conservative hold |
Swing |
-14.9 |
|
| Walkley By-Election 26 November 1992[2] |
| Party |
Candidate |
Votes |
% |
±% |
|
Liberal Democrat |
Diane Leek |
1,529 |
42.0 |
+20.1 |
|
Labour |
Jim Bamford |
1,345 |
37.0 |
-6.9 |
|
Conservative |
Veronica Hague |
594 |
16.3 |
-12.9 |
|
Green |
Nicola Watson |
170 |
4.7 |
-0.2 |
| Majority |
184 |
5.1 |
-9.6 |
| Turnout |
3,638 |
24.5 |
-4.7 |
|
Liberal Democrat gain from Labour |
Swing |
+13.5 |
|
| Walkley By-Election 14 January 1993[3] |
| Party |
Candidate |
Votes |
% |
±% |
|
Liberal Democrat |
Diane Leek |
2,526 |
58.5 |
+16.5 |
|
Labour |
Jim Bamford |
1,434 |
33.2 |
-3.8 |
|
Conservative |
Veronica Hague |
262 |
6.1 |
-10.2 |
|
Green |
Nicola Watson |
170 |
1.9 |
-2.8 |
|
Revolutionary Communist |
Colin O'Malley |
18 |
0.4 |
+0.4 |
| Majority |
1,092 |
25.3 |
+20.1 |
| Turnout |
4,321 |
29.1 |
+4.6 |
|
Liberal Democrat hold |
Swing |
+10.1 |
|
References
|
|---|
| | Metropolitan boroughs | |
|---|
| | District councils (England) | |
|---|
| | District councils (Scotland) |
- Aberdeen
- Angus
- Annandale and Eskdale
- Argyll and Bute
- Badenoch and Strathspey
- Banff and Buchan
- Bearsden and Milngavie
- Berwickshire
- Caithness
- Clackmannan
- Clydebank
- Clydesdale
- Cumbernauld and Kilsyth
- Cumnock and Doon Valley
- Cunninghame
- Dumbarton
- Dundee
- Dunfermline
- East Kilbride
- East Lothian
- Eastwood
- Edinburgh
- Ettrick and Lauderdale
- Falkirk
- Glasgow
- Gordon
- Hamilton
- Inverclyde
- Inverness
- Kilmarnock and Loudoun
- Kincardine and Deeside
- Kirkcaldy
- Kyle and Carrick
- Lochaber
- Midlothian
- Monklands
- Moray
- Motherwell
- Nairn
- Nithsdale
- North East Fife
- Perth and Kinross
- Renfrew
- Ross and Cromarty
- Roxburgh
- Skye and Lochalsh
- Stewartry
- Stirling
- Strathkelvin
- Sutherland
- Tweeddale
- West Lothian
- Wigtown
|
|---|
| |
|